 Open Access Article
Creative Commons Attribution 3.0 Unported Licence
Evaluation of Nd0.8−xSr0.2CaxCoO3−δ(x = 0, 0.05, 0.1, 0.15, 0.2) as a cathode material for intermediate-temperature solid oxide fuel cells†
Xu Dua,
Songbo Li *a,
Shengli Anb,
Liangmei Xuea and
Yang Nia
aSchool of Chemistry and Chemical Engineering, Inner Mongolia University of Science and Technology, Baotou 014000, China. E-mail: songboli2021@hotmail.com
bSchool of Material and Metallurgical Engineering, Inner Mongolia University of Science and Technology, Baotou 014010, China
First published on 13th June 2022
Abstract
A series of Nd0.8−xSr0.2CaxCoO3−δ(x = 0, 0.05, 0.1, 0.15, 0.2) cathode materials was synthesized by sol–gel method. The effect of Ca doping amount on the structure was examined by scanning electron microscopy (SEM), X-ray diffraction (XRD), thermal expansion, and X-ray photoelectron spectroscopy (XPS). Electrochemical properties were evaluated for possible application in solid oxide fuel cell (SOFC) cathodes. Results showed that second phase NdCaCoO4+δ is generated when the Ca doping amount is higher than 0.1. The increase in Ca limits the electronic compensation capacity of the material, resulting in a decrease in thermal expansion coefficient (TEC). With the increase of Ca content, the conductivity increases at first and then decreases, and the highest value of 443 S cm−1 is at x = 0.1 and T = 800 °C. Nd0.7Sr0.2Ca0.1CoO3−δ exhibits the lowest area specific resistance of 0.0976 Ω cm2 at 800 °C. The maximum power density of Nd0.7Sr0.2Ca0.1CoO3−δ at 800 °C is 409.31 mW cm−2. The Ca-doped material maintains good electrochemical properties under the coefficient of thermal expansion (CTE) reduction and thus can be used as an intermediate-temperature SOFC (IT-SOFC) cathode.
1. Introduction
The solid oxide fuel cell (SOFC) is an all-solid-state device for efficient energy conversion at high operating temperature. Despite its extremely impressive energy conversion efficiency, its high operating temperature (800–1000 °C) limits the applications for this technology and thus hinders its further development.1 Reducing the operating temperature of SOFCs has become a major research focus for their broad application in this field. The overall performance of SOFCs is mainly influenced by the oxygen reduction reaction (ORR) cathodic activity, which in turn is directly related to temperature.2 Therefore, the choice of cathode material influences the overall SOFC performance. In recent years, Perovskite oxide (ABO3) with mixed ion–electron conductors (MIEC) has been extensively studied and applied in intermediate-temperature solid oxide fuel cells (IT-SOFCs).3 The ABO3 structure has a high concentration of oxygen vacancies that maintain the coexistence of many metal ions with different oxidation states, resulting in good ORR catalytic activity.4 These characteristics render its potential use in SOFC and solid oxide electrolyzer cells.Among available materials, LaCoO3−δ has attracted attention due to its impressive ORR activity and good proton–ion conductivity.5 However, Co-based materials have a high coefficient of thermal expansion (CTE), which results in high thermal stress at high temperature and limits their further development.6 High thermal stress can loosen the bond between cathode and electrolyte, leading to cathode detachment and cell failure. As a solution, La has been replaced with elements such as Pr, Nd, Sm, and Gd in LaCoO3−δ structure.7–9 However, the conductivity and electrochemical properties of LnCoO3−δ (Ln = Pr, Nd, Sm, Gd) decrease with ionic radius, and lanthanide shrinkage reduces lattice symmetry and limits the proton conduction of the material.10,11 NdCoO3−δ exhibits lower electrical conductivity and thermal expansion properties.12,13 Compared with La, Nd has a smaller ionic radius, shorter Nd–O bond, lower electrical conductivity, and better thermal stability.14,15 Although the CTE of NdCoO3−δ is already lower than that of LaCoO3−δ, this property must be further reduced to the level in electrolytes.16 The most common method of improving thermal expansion is to use Sr instead of Nd to enhance the electrochemical properties. Lee et al. reported an increase in conductivity and a decrease in CTE with the increasing Sr content for Nd1−xSrxCoO3−δ.17 Similar to Sr doping, the introduction of Ba and Ca into perovskite oxides has been increasingly investigated.18,19 In some layered perovskite doped with Ca, oxygen loss is reduced, and phase stability at high temperatures is improved, resulting in improved electrochemical properties and decreased CTE.20,21 Therefore, the role of Ca doping in perovskite structure must be extensively examined.
In this work, Ca was used to replace Nd in Nd0.8−xSr0.2CaxCoO3−δ (x = 0, 0.05, 0.1, 0.15, 0.2) to investigate the effect of Ca content on the crystal structure. Improvements in thermal expansion and electrochemical performance were investigated in detail to examine the feasibility of this material as an IT-SOFC cathode.
2. Experimental
2.1 Powder preparation
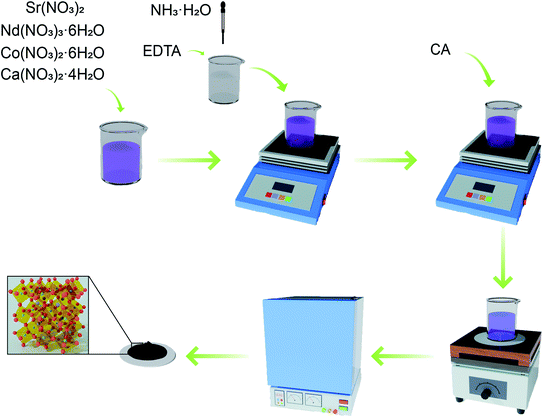
Nd0.8−xSr0.2CaxCoO3−δ(x = 0, 0.05, 0.1, 0.15, 0.2) was prepared by EDTA–citric acid (CA) method. Nd(NO3)3·6H2O (Aldrich, 99%), Sr(NO3)2 (Aldrich, 99.99%), Co(NO3)2·6H2O (Aldrich, 99.99%), and Ca(NO3)2·4H2O (Aldrich, 99%) were dissolved in ammonia and stirred thoroughly. The two complexing agents were weighed in the ratio of metal cation![[thin space (1/6-em)]](https://www.rsc.org/images/entities/char_2009.gif) :
:![[thin space (1/6-em)]](https://www.rsc.org/images/entities/char_2009.gif) EDTA
EDTA![[thin space (1/6-em)]](https://www.rsc.org/images/entities/char_2009.gif) :
:![[thin space (1/6-em)]](https://www.rsc.org/images/entities/char_2009.gif) CA = 1
CA = 1![[thin space (1/6-em)]](https://www.rsc.org/images/entities/char_2009.gif) :
:![[thin space (1/6-em)]](https://www.rsc.org/images/entities/char_2009.gif) 1
1![[thin space (1/6-em)]](https://www.rsc.org/images/entities/char_2009.gif) :
:![[thin space (1/6-em)]](https://www.rsc.org/images/entities/char_2009.gif) 2. EDTA (99.5%) was dissolved in ammonia and added to the above nitrate solution with continuous stirring for 1 h. CA (99.5%) was subsequently added, and the complexation was continued by stirring for 2 h. Solution pH was adjusted to pH ≥ 6 by adding ammonia and heated with stirring to remove excess solvent until a gel was formed. The gel was then heated to spontaneous combustion and calcined in air at 900 °C for 24 h, and the procedure is shown in Fig. 1. Nd0.8−xSr0.2CaxCoO3−δ (x = 0, 0.05, 0.1, 0.15, 0.2) samples were named NSC, NSC0.05C, NSC0.1C, NSC0.15C, and NSC0.2C, respectively.
2. EDTA (99.5%) was dissolved in ammonia and added to the above nitrate solution with continuous stirring for 1 h. CA (99.5%) was subsequently added, and the complexation was continued by stirring for 2 h. Solution pH was adjusted to pH ≥ 6 by adding ammonia and heated with stirring to remove excess solvent until a gel was formed. The gel was then heated to spontaneous combustion and calcined in air at 900 °C for 24 h, and the procedure is shown in Fig. 1. Nd0.8−xSr0.2CaxCoO3−δ (x = 0, 0.05, 0.1, 0.15, 0.2) samples were named NSC, NSC0.05C, NSC0.1C, NSC0.15C, and NSC0.2C, respectively.
Gd0.20Ce0.80O1.90 (GDC) powder for the electrolyte was also synthesized by the EDTA–CA method with stoichiometric amounts of metal cation![[thin space (1/6-em)]](https://www.rsc.org/images/entities/char_2009.gif) :
:![[thin space (1/6-em)]](https://www.rsc.org/images/entities/char_2009.gif) EDTA
EDTA![[thin space (1/6-em)]](https://www.rsc.org/images/entities/char_2009.gif) :
:![[thin space (1/6-em)]](https://www.rsc.org/images/entities/char_2009.gif) CA = 1
CA = 1![[thin space (1/6-em)]](https://www.rsc.org/images/entities/char_2009.gif) :
:![[thin space (1/6-em)]](https://www.rsc.org/images/entities/char_2009.gif) 1
1![[thin space (1/6-em)]](https://www.rsc.org/images/entities/char_2009.gif) :
:![[thin space (1/6-em)]](https://www.rsc.org/images/entities/char_2009.gif) 2. The gel was then heated to remove organic products, and the obtained powders were finally annealed at 1250 °C for 5 h. NiO-GDC powder was synthesized through solid-state reaction. NiO (Aldrich, 99%), GDC, and starch with mass ratio of 6
2. The gel was then heated to remove organic products, and the obtained powders were finally annealed at 1250 °C for 5 h. NiO-GDC powder was synthesized through solid-state reaction. NiO (Aldrich, 99%), GDC, and starch with mass ratio of 6![[thin space (1/6-em)]](https://www.rsc.org/images/entities/char_2009.gif) :
:![[thin space (1/6-em)]](https://www.rsc.org/images/entities/char_2009.gif) 4
4![[thin space (1/6-em)]](https://www.rsc.org/images/entities/char_2009.gif) :
:![[thin space (1/6-em)]](https://www.rsc.org/images/entities/char_2009.gif) 1 were mixed for 15 h in anhydrous alcohol in a zirconia grinding medium. Similar method was used to prepare NSCxC + GDC hybrid powder by ball milling an equal mass mixture of NSCxC/GDC and calcining at 900 °C for 5 h. This power was used to investigate the chemical compatibility of NSCxC and GDC electrolytes.
1 were mixed for 15 h in anhydrous alcohol in a zirconia grinding medium. Similar method was used to prepare NSCxC + GDC hybrid powder by ball milling an equal mass mixture of NSCxC/GDC and calcining at 900 °C for 5 h. This power was used to investigate the chemical compatibility of NSCxC and GDC electrolytes.
2.2 Cell preparation
Electrolyte-supported symmetric cells were prepared for the electrochemical performance tests. Impedance test was conducted using an electrolyte-supported symmetric cell. The GDC powder was pressed into sheets (15 mm in diameter, 0.5 mm in thickness) under 200 MPa pressure, and the GDC electrolyte support was obtained after calcination in air at 1450 °C for 10 h.The cathode part of the symmetric cell was prepared by screen printing. NSCxC powder was mixed with pine oil alcohol (Aldrich, 95%) and ethyl cellulose (Aldrich, 45–55 mPa s) in a mass ratio of 2![[thin space (1/6-em)]](https://www.rsc.org/images/entities/char_2009.gif) :
:![[thin space (1/6-em)]](https://www.rsc.org/images/entities/char_2009.gif) 2
2![[thin space (1/6-em)]](https://www.rsc.org/images/entities/char_2009.gif) :
:![[thin space (1/6-em)]](https://www.rsc.org/images/entities/char_2009.gif) 1 to obtain NSCxC cathode slurry, which was then printed onto both sides of the electrolyte symmetry and calcined in air at 900 °C for 5 h to obtain a symmetrical cell with the NSCxC|GDC|NSCxC structure.
1 to obtain NSCxC cathode slurry, which was then printed onto both sides of the electrolyte symmetry and calcined in air at 900 °C for 5 h to obtain a symmetrical cell with the NSCxC|GDC|NSCxC structure.
The electrochemical performance of this cell was tested by using an anode-supported single cell. In brief, 0.15 g of GDC was laid flat on top of 1.5 g of NiO-GDC and pressed under 200 MPa in a φ = 15 mm diameter mold to obtain the NiO-GDC|GDC anode supported half-cell. The cathode side was prepared in the same way as the symmetric cell to fabricate a single cell with NiO-GDC|GDC|NSCxC structure.
2.3 Characterization
The XRD (Malvern Panalytical, Empyrean, Cu-Kα radiation) patterns of samples were used to confirm their crystalline structure. The morphologies of the materials and cells were tested by SEM (TESCAN, GAIA3). The CTE of the samples was determined by an L75 HS 1600 thermal expansion meter (NETZSCH). The composition and valence of each element on the surface was studied by XPS using ESCALAB 250Xi instrument (Thermo Fisher Scientific).2.4 Electrochemical performance test
The electrochemical performance of NSCxC samples was tested in PGSTAT302N electrochemical workstation (Metrohm). Electrical conductivity was simultaneously measured for all samples by a four-terminal DC arrangement in the range of 200–800 °C with Ag paste as the collector. Electrochemical impedance (EIS) tests for NSCxC|GDC|NSCxC symmetric cells were carried out at a temperature interval of 650–800 °C, a frequency range of 100 kHz–0.1 Hz, and an amplitude of 10 mV in RMS mode. Single cell output performance for NSCxC|GDC|NiO-GDC single cells was examined at 650 °C-800 °C with humidified H2 (3% H2O) as the fuel gas and ambient air as the oxidizing agent.3. Results and discussion
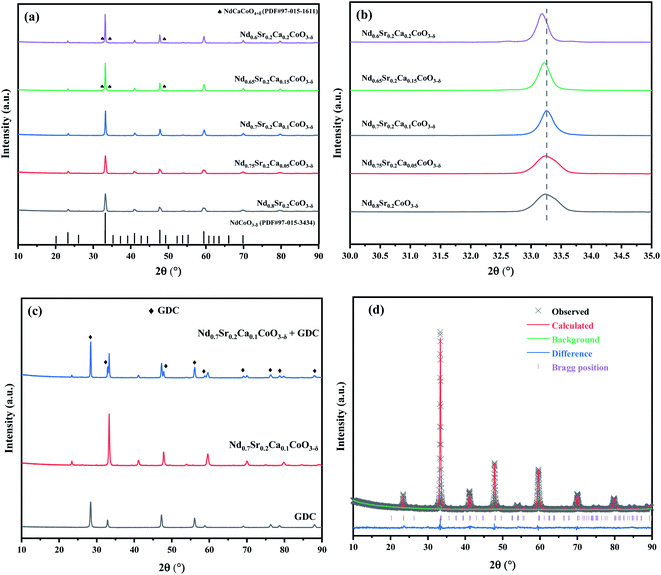
The XRD patterns of the NSCxC powders calcined at 900 °C are shown in Fig. 2(a), and the magnification (30.0°–35.0°) is shown in Fig. 2(b). All the curves are generally consistent, but the generation of the second phase NdCaCoO4+δ (PDF#97-015-1611) is observed only when the Ca doping amount is above 1.5. When the Ca content increases, the main diffraction peak of the XRD patterns shifts to the left with an increasing degree due to lattice expansion.22 The XRD patterns of GDC, NSC0.1C, and NSC0.1C + GDC are presented in Fig. 2(c). The two materials remain two separate entities after mixing and calcination without the formation of a new component, indicating the good chemical compatibility of NSC0.1C and GDC electrolytes. The coordination number of A-site elements in ABO3 structure is 12. Comparing the ion radii, it is found that rCa(II) (1.35 Å) > rNd(III) (1.27 Å). The effects of increasing Ca content in the crystal structure of NSCxC are further investigated, and the XRD patterns are analyzed by Rietveld refinement using GSAS + EXPGUI software as shown in Table 1.23,24 The Rietveld refined XRD patterns for NSC0.1C are shown in Fig. 2(d), and those for the other samples are shown in Fig. S1(a–d).† The results show that the unit cell volume of NSCxC powders increases gradually with the increase in Ca content.| Sample | NSC | NSC0.05C | NSC0.1C | NSC0.15C | NSC0.2C |
|---|---|---|---|---|---|
| Space group | Pbnm | Pbnm | Pbnm | Pbnm | Pbnm |
| Volume (Å) | 215.88 | 216.74 | 217.23 | 217.45 | 218.19 |
| a (Å) | 5.35 | 5.40 | 5.37 | 5.37 | 5.39 |
| b (Å) | 5.33 | 5.33 | 5.33 | 5.34 | 5.31 |
| c (Å) | 7.57 | 7.54 | 7.59 | 7.58 | 7.62 |
| χ2 | 1.969 | 2.471 | 1.714 | 2.299 | 2.31 |
| Rwp (%) | 2.86% | 4.43% | 3.61% | 4.15% | 4.24% |
| Rp (%) | 3.32% | 3.43% | 2.81% | 3.21% | 3.30% |
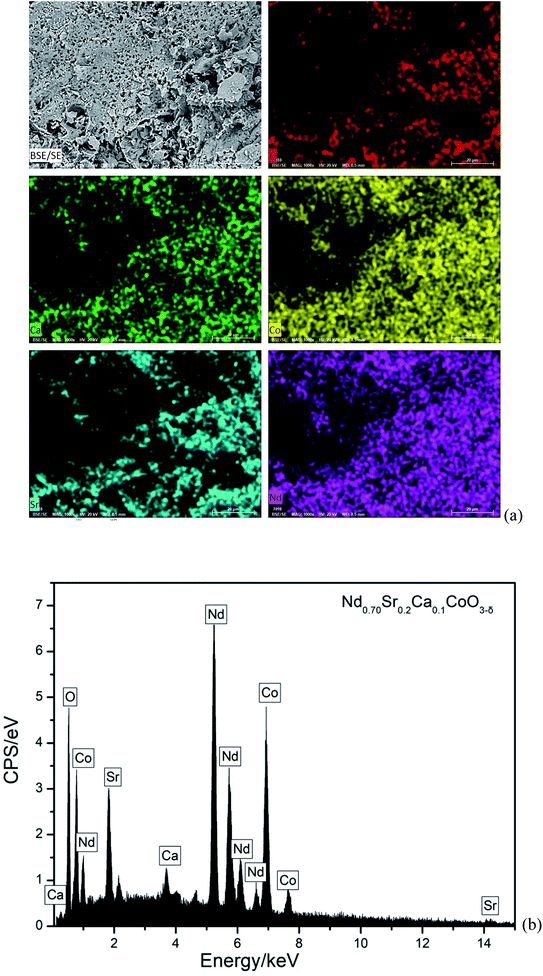
As a representative, Fig. 3(a) illustrates FE-SEM image and elemental mappings of NSC0.1C sample. The morphology of this cathode powder shows a pore structure. Its EDS spectrum is also shown in Fig. 3(b). These reveal that the matrix is made up of Nd, Sr, Ca, Co, and O elements. The elements are homogeneously distributed. Moreover, the atomic content of Nd, Sr, Ca, Co, and O in the Nd0.8−xSr0.2CaxCoO3−δ (x = 0, 0.05, 0.1, 0.15, 0.2) samples are listed in Table 2. The atomic contents are very close to the theoretical atomic contents, which prove the composite of the prepared Nd0.8−xSr0.2CaxCoO3−δ samples.
| x | Atom% | |||||
|---|---|---|---|---|---|---|
| Nd | Sr | Ca | Co | O | ||
| 0 | Actual | 18.18 | 4.55 | 0 | 22.73 | 54.55 |
| Theoretical | 18.09 | 4.42 | 0 | 22.78 | 54.71 | |
| 0.05 | Actual | 17.14 | 4.57 | 1.14 | 22.86 | 54.29 |
| Theoretical | 17.23 | 4.61 | 1.08 | 22.82 | 54.26 | |
| 0.1 | Actual | 16.09 | 4.6 | 2.3 | 22.99 | 54.02 |
| Theoretical | 16.13 | 4.55 | 2.28 | 23.01 | 54.03 | |
| 0.15 | Actual | 15.03 | 4.62 | 3.47 | 23.12 | 53.76 |
| Theoretical | 14.92 | 4.61 | 3.42 | 23.09 | 53.96 | |
| 0.2 | Actual | 13.95 | 4.65 | 4.65 | 23.36 | 53.49 |
| Theoretical | 14.01 | 4.68 | 4.61 | 23.41 | 53.29 | |
The cross-sectional SEM images of the NSCxC|GDC|NiO-GDC cell with an anode support structure are shown in Fig. 4, and 4(a–e) displays the interface between NSCxC and GDC connection. The interface between NSCxC and GDC electrolyte is well defined and in good contact without delamination, indicating the good compatibility between NSCxC and GDC electrolyte.25 A certain amount of closed pores and no open pores are observed in the GDC electrolyte region and can be considered as a dense GDC membrane.26 The well-defined interfaces of the layers in NSC0.1C|GDC|NiO-GDC in Fig. 4(f) confirm their electrochemical properties. NSCxC powders do not show uniform grains, indicating that Ca doping has no evident effect on their microstructure.27
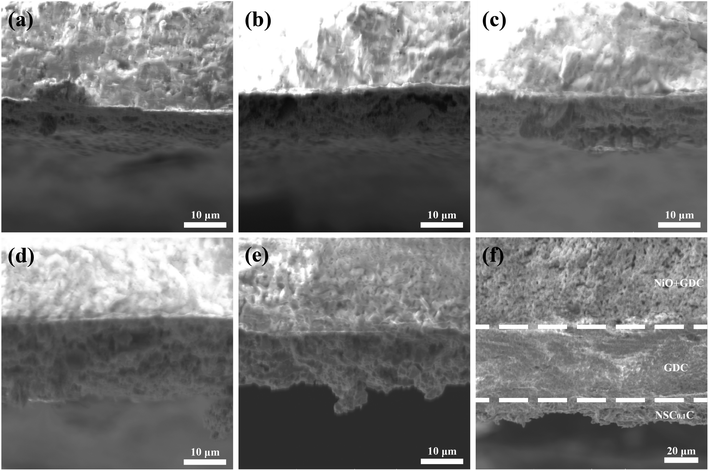 | ||
| Fig. 4 SEM images of the cathode/electrolyte bilayer cross-section (a) NSC|GDC; (b) NSC0.05C|GDC; (c) NSC0.1C|GDC; (d) NSC0.15C|GDC; (e) NSC0.2C|GDC; (f) NSC0.1C|GDC|NiO-GDC. | ||
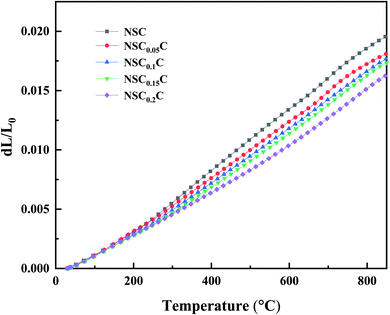
The thermal expansion curves of NSCxC are shown in Fig. 5. The overall thermal expansion characteristics are suppressed with the increasing Ca doping amount. All samples exhibit non-linear thermal expansion behavior with the increasing temperature. This phenomenon occurs because Co3+ at low temperature exists mainly in the form of Co3+  in the low spin state and gradually shifts to either Co3+
  in the high spin state or Co3+
  in the intermediate spin state when the temperature increases; this shift causes the cell to expand.28 In addition, the introduction of Sr2+ and Ca2+ in the NSC reinforces the charge compensation guided by the ionic mechanism, and the elevated temperature further promotes the formation of oxygen vacancies.4,29,30 At 200–600 °C, the thermal expansion behavior of the material gradually shifts from non-linear to linear with the increasing Ca content, and the average CTE gradually decreases in all temperature bands from 25.7603 × 10⁻⁶ K−1 for NSC to 19.7623 × 10⁻⁶ K−1 for NSC0.2C (35–800 °C). Because Ca stabilizes the spin state of Co, the ionic property of Co–O bond is reduced, the covalent property of Co–O bond is improved, and CTE is reduced. The average CTE for each temperature band is shown in Table S1.† The weakening of CTE by Ca addition is relatively limited within the 600–800 °C range and decreases from 24.2049 × 10⁻⁶ K−1 for NSC to 23.9310 × 10⁻⁶ K−1 for NSC0.2C. Compared with its stabilizing effect on Co3+ in the intermediate spin state, Ca2+ gradually increases its enhancement effect on charge compensation guided by the ionic mechanism at high temperatures. Therefore, Ca doping has a progressively weak effect on the CTE of NSC at the range of 600–800 °C.27,31
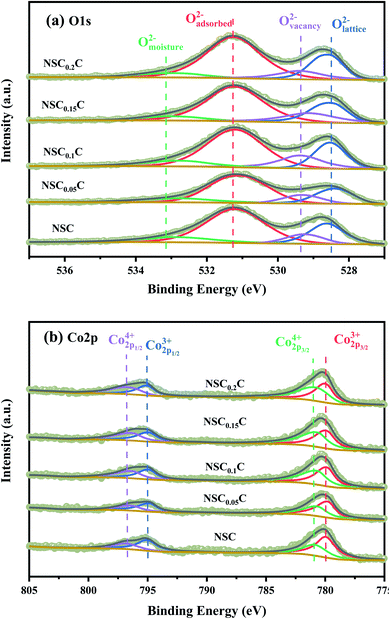
XPS is performed to determine the surface elemental valence states of NSCxC series materials. As shown in Fig. 6(a), deconvolution is performed on the O 1s peak of the NSCxC material. The O 1s shows a high peak and a low peak that are fitted to another four peaks, namely, moisture oxygen (Omoisture), adsorbed oxygen (Oadsorbed), vacancy oxygen (Ovacancy), and lattice oxygen (Olattice). The corresponding binding energy of each peak is shown in Table 3.14 With the increasing temperature, the oxygen in Oadsorbed and Ovacancy is easily removed from the lattice and thus creates oxygen vacancies. The ratio of (Oadsorbed + Ovacancy)/Olattice is therefore calculated and shown in Table S2.† The ratio of (Oadsorbed + Ovacancy)/Olattice increases at x ≤ 0.1, indicating that Ca introduction can increase the generation of oxygen vacancies. When x ≥ 0.1, the reduced ratio is attributed to the additional rock salt-like layer of the newly generated NdCaCoO4+δ compared with the original phase; this layer increased the overall lattice oxygen content.32,33 According to current oxygen ion conduction theory, the increase in oxygen vacancies can improve the oxygen ion migration ability during ORR, and the higher adsorbed oxygen content can promote the migration of oxygen to triple-phase boundary (TPB) and the diffusion rate at the electrolyte–cathode interface. The XPS plots of Co 2p for NSCxC are demonstrated in Fig. 6(b). The curve shows two peaks with high (Co 2p1/2) and low (Co 2p3/2) binding energies. The Co 2p3/2 peaks are classified as Co3+ and Co4+ according to their binding energies of 779.9 ± 0.2 and 780.8 ± 0.2 eV, respectively, and the Co 2p1/2 peaks are classified as Co3+ and Co4+ according to their binding energies of 794.9 ± 0.2 and 796.4 ± 0.2 eV, respectively.14,31,34,35 The binding energy positions and Co3+/Co4+ contents are shown in Table 4. With the increase in Ca content, Co3+ increases and Co4+ decreases, thus further improving the electrochemical performance of the materials.
| Sample | Omoisture (eV) | Oadsorbed (eV) | Ovacancy (eV) | Olattice (eV) | (Oadsorbed + Ovacancy)/Olattice |
|---|---|---|---|---|---|
| NSC | 532.85 | 531.19 | 529.25 | 528.63 | 3.14 |
| NSC0.05C | 532.90 | 531.08 | 529.31 | 528.38 | 3.29 |
| NSC0.1C | 532.72 | 531.20 | 529.34 | 528.54 | 3.35 |
| NSC0.15C | 532.92 | 531.20 | 529.12 | 528.50 | 3.32 |
| NSC0.2C | 532.94 | 531.25 | 529.38 | 528.58 | 3.30 |
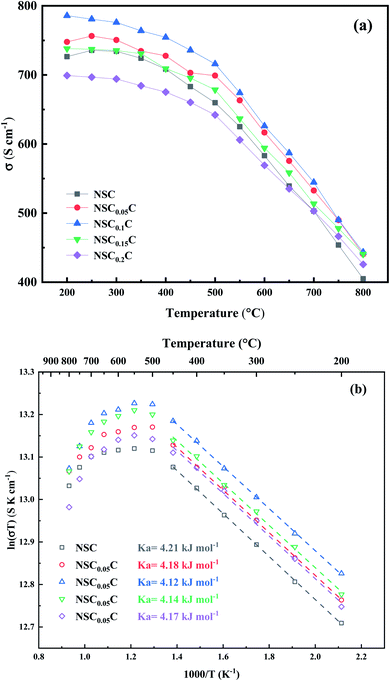
The temperature dependence of the conductivity curve of NSCxC in the range of 200–800 °C is shown in Fig. 7(a). In perovskite structure, the electronic conductivity is higher than the ionic conductivity and therefore is the dominant force.5,36 The joint action of the two compensation modes leads to the phenomenon that the conductivity decreases with the increase of temperature. With the increase of temperature, ion conduction begins to play a role, and the effect of electron conduction weakens. At the same temperature, the conductivity first increases with the increasing doping concentration of Ca2+ and reaches the peak at 0.1, indicating a typical property of semiconductor. But when the Ca2+ doping concentration further increases, the conductivity decreases, indicating a metallic conductive behavior.28 In perovskite oxides, electron conduction relies mainly on the B–O–B conduction mechanism, which is determined by the overlap of the 2p orbital of oxygen with the 3d orbital of transition metal.37,38 Ca2+ doping creates additional holes, which strengthens the electron conduction mechanism:
 | (1) |
But the doping of Ca2+ also leads to the generation of extra oxygen vacancies, which hinder the transition of electrons, and decreases the conductivity:
 | (2) |
The combined action of two mechanisms increases the electrical conductivity when the Ca2+ doping concentration is appropriate for the NSCxC. Goldschmidt tolerance factor is calculated by eqn (3):
 | (3) |
 | (4) |
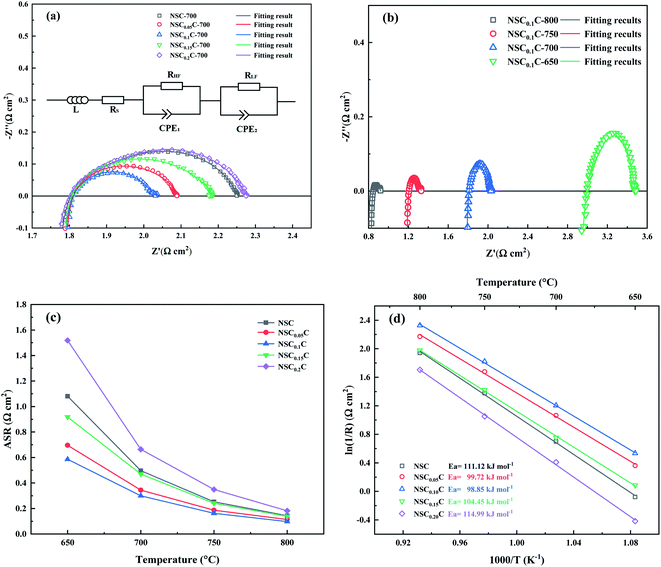
The effect of Ca doping on the performance of NSCxC cathode is investigated by EIS. Fig. 8(a) shows the Nyquist diagram for NSCxC materials with different Ca contents at 700 °C. All the curves show semicircular arcs of different radii and reflect the specific electrochemical processes at a specific temperature. In general, the two arcs correspond to high and low frequency, respectively. The polarization resistance of the arc in the high frequency section is influenced by the charge transfer of oxide ions at the interface of electrode and electrolyte. Meanwhile, the arc in the low frequency region corresponds to oxygen adsorption and dissociation. The Nyquist curves for NSC0.1C at different temperatures are also displayed in Fig. 8(b). The increasing temperature advances the electrocatalytic performance of the cathode, resulting in a smaller arc. The Nyquist curves at other temperatures and their fits are shown in Fig. S2(a–c),† and the polarization resistance (Rp) is calculated from these fits and normalized to obtain the area specific resistance (ASR) with the value placed in Fig. 8(c). With the increase in Ca doping, the ASR first decreases and then increases. ASR is the lowest at all temperature points when x = 0.1 but starts to increase when x > 0.1. The Arrhenius plots of NSCxC at 800–650 °C are drawn using the ASR values obtained in the EIS tests as shown in Fig. 8(d). The activation energy Ea for each material is further calculated by the Arrhenius equation as listed in Fig. 8(d). The symmetric cell exhibits the lowest activation energy of 98.85 kJ mol−1 when x = 0.1. The reduced activation energy at x ≤ 0.1 can be attributed to the following: the replacement of Nd3+ by Ca2+ creates additional oxygen vacancies, increases the oxygen transport rate, expands the adsorption/dissociation pathway, and improves its oxygen adsorption/dissociation and oxygen ion surface diffusion as a cathode material.14,42 By contrast, when x > 0.1, its ASR and Ea increase, indicating that the spin state of Co3+ is induced by the increasing Ca2+ content at high temperatures, thus limiting further the generation of oxygen vacancies.21,31,39
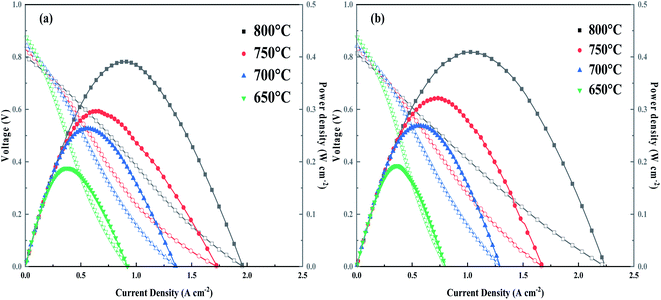
The I–V–P curves with corresponding power density curves for NSC (a) and NSC0.1C (b) at 800–600 °C are depicted in Fig. 9. The OCV is approximately 0.8 V at 800 °C and increases to approximately 0.9 V at 600 °C. The maximum power densities of NSC0.1C at 600 °C, 650 °C, 700 °C, 750 °C, and 800 °C are 409.31, 321.40, 268.69, 192.44, and 158.10 mW cm−2, respectively. The output power density of NSC at 800 °C is 391.03 mW cm−2, which is lower than that of NSC0.1C at all other temperatures (Table S3†). Hence, the power density at x = 0.1 is slightly higher than that of the sample without Ca doping. Therefore, NSC0.1C is a promising cathode material for IT-SOFC.
4. Conclusions
The effects of Ca doping on it's the structural and electrochemical properties of Nd0.8Sr0.2CoO3−δ were investigated, and its performance as an IT-SOFC cathode material was evaluated. When the Ca content increases, the unit cell size of Nd0.8−xSr0.2CaxCoO3−δ increases and CTE decreases. Nd0.7Sr0.2Ca0.1CoO3−δ shows good electrochemical performance, and its conductivity decreases with the increase of temperature, and it is 443 S cm−1 at 800 °C. However, low area-specific resistance values are obtained due to the dominance of ionic compensation. At x = 0.1, its area specific resistance is 0.0976 Ω cm2 at 800 °C, implying good oxygen diffusion. The maximum power density of Nd0.7Sr0.2Ca0.1CoO3−δ is 409.31 mW cm−2 at 800 °C, which is slightly higher than that of Nd0.8Sr0.2CoO3−δ at 391.03 mW cm−2. This finding indicates that the CTE of Nd0.7Sr0.2Ca0.1CoO3−δ can be reduced while maintaining a power density similar to that of the original structure. Therefore, Nd0.7Sr0.2Ca0.1CoO3−δ has good electrochemical properties and can be used as a candidate material for IT-SOFC cathodes.Conflicts of interest
There are no conflicts to declare.Acknowledgements
The work was supported by the National Natural Science Foundation of China (No: 51974167) and Scientific research program of Inner Mongolia higher education institutions (NJZZ22449).References
- E. D. Wachsman and K. T. Lee, Lowering the Temperature of Solid Oxide Fuel Cells, Science, 2011, 334, 935–939 CrossRef CAS PubMed.
- D. J. L. Brett, A. Atkinson, N. P. Brandon and S. J. Skinner, Intermediate temperature solid oxide fuel cells, Chem. Soc. Rev., 2008, 37, 1568–1578 RSC.
- A. J. Jacobson, Materials for Solid Oxide Fuel Cells, Chem. Mater., 2010, 22, 660–674 CrossRef CAS.
- D. Munoz-Gil, M. Teresa Azcondo, C. Ritter, O. Fabelo, D. Perez-Coll, G. C. Mather, U. Amador and K. Boulahya, The Effects of Sr Content on the Performance of Nd1−xSrxCoO3−δ Air–Electrode Materials for Intermediate Temperature Solid Oxide Fuel Cells under Operational Conditions, Inorg. Chem., 2020, 59, 12111–12121 CrossRef CAS PubMed.
- X. Ding, L. Gao, Y. Liu, Y. Zhen and L. Guo, Thermal expansion and electrochemical properties of La0.7AE0.3CuO3−δ (AE = Ca, Sr, Ba) cathode materials for IT-SOFCs, J. Electroceram., 2007, 18, 317–322 CrossRef CAS.
- L. Qiu, T. Ichikawa, A. Hirano, N. Imanishi and Y. Takeda, Ln1−xSrxCo1−yFeyO3−δ (Ln = Pr, Nd, Gd; x = 0.2, 0.3) for the electrodes of solid oxide fuel cells, Solid State Ionics, 2003, 158, 55–65 CrossRef CAS.
- S. Yoo, A. Jun, J. Shin and G. Kim, Electrochemical and Redox Studies of Sm0.5Sr0.5Co1−xNbx (x = 0, 0.1) as Cathode Materials in Intermediate Temperature-Solid Oxide Fuel Cells, ECS Trans., 2013, 57, 1725–1731 CrossRef.
- W. X. Chen, T. L. Wen, H. W. Nie and R. Zheng, Study of Ln0.6Sr0.4CO0.8Mn0.2O3−δ (Ln = La, Gd, Sm or Nd) as the cathode materials for intermediate temperature SOFC, Mater. Res. Bull., 2003, 38, 1319–1328 CrossRef CAS.
- N. Chaubey, D. Jain, B. N. Wani, C. G. S. Pillai, S. R. Bharadwaj and M. C. Chattopadhyaya, Crystal structure, thermal expansion, electrical conductivity and chemical compatibility studies of nanocrystalline Ln0.6Sr0.4Co0.2Fe0.8O3−δ (Ln = Nd, Sm, Gd), J. Indian Chem. Soc., 2011, 88, 127–139 CAS.
- M. A. Tamimi, A. C. Tomkiewicz, A. Huq and S. McIntosh, On the link between bulk and surface properties of mixed ion electron conducting materials Ln0.5Sr0.5Co0.8Fe0.2O3−δ (Ln = La, Pr, Nd), J. Mater. Chem. A, 2014, 2, 18838–18847 RSC.
- F. Heydari, A. Maghsoudipour, M. Alizadeh, Z. Khakpour and M. Javaheri, Synthesis and evaluation of effective parameters in thermal expansion coefficient of Ln0.6Sr0.4Co0.2M0.8O3−δ (Ln = La, Nd and M = Mn, Fe) perovskite oxide, Bull. Mater. Sci., 2015, 38, 1009–1014 CrossRef CAS.
- Y. Zheng, Y. Li, T. Wu, W. Zhang, J. Zhu, Z. Li, J. Chen, B. Yu, J. Wang and J. Zhang, Oxygen reduction kinetic enhancements of intermediate-temperature SOFC cathodes with novel Nd0.5Sr0.5CoO3−δ/Nd0.8Sr1.2CoO4±δ heterointerfaces, Nano Energy, 2018, 51, 711–720 CrossRef CAS.
- X. M. Fu, M. H. Liu, X. W. Meng, S. Q. Lu, D. Y. Wang, Y. H. Zhang, H. B. Liu, M. X. Song, Z. W. Li and L. Z. Wang, Cobalt-free perovskite Ln0.5Sr0.5Fe0.8Cu0.2O3−δ (Ln = Pr, Nd, Sm, and Gd) as cathode for intermediate-temperature solid oxide fuel cell, Ionics, 2020, 26, 1285–1295 CrossRef CAS.
- W. Jia, Z. Huang, W. Sun, L. Wu, L. Zheng, Y. Wang, J. Huang, X. Yang, M. Lv and L. Ge, Flexible A-site doping La0.6−xMxSr0.4Co0.2Fe0.8O3 (M = Ca, Ba, Bi; x = 0, 0.1, 0.2) as novel cathode material for intermediate-temperature solid oxide fuel cells: A first-principles study and experimental exploration, J. Power Sources, 2021, 490, 229564 CrossRef CAS.
- S. Choi, J. Shin, K. M. Ok and G. Kim, Chemical compatibility, redox behavior, and electrochemical performance of Nd1−xSrxCoO3−δ cathodes based on Ce1.9Gd0.1O1.95 for intermediate-temperature solid oxide fuel cells, Electrochim. Acta, 2012, 81, 217–223 CrossRef CAS.
- C. Torres-Garibay, D. Kovar and A. Manthiram, Ln0.6Sr0.4Co1−yFeyO3−δ (Ln = La and Nd; y = 0 and 0.5) cathodes with thin yttria-stabilized zirconia electrolytes for intermediate temperature solid oxide fuel cells, J. Power Sources, 2009, 187, 480–486 CrossRef CAS.
- K. T. Lee and A. Manthiram, Characterization of Nd1−xSrxCoO3−δ (0 ≤ x ≤ 0.5) Cathode Materials for Intermediate Temperature SOFCs, J. Electrochem. Soc., 2005, 152, A197–A204 CrossRef CAS.
- J. H. Kim and A. Manthiram, LnBaCo2O5+δ oxides as cathodes for intermediate-temperature solid oxide fuel cells, J. Electrochem. Soc., 2008, 155, B385–B390 CrossRef CAS.
- Y. Lu, X. Zhao, Z. Wang and X. Ding, Trade-off between oxygen reduction reaction activity and CO2 stability in a cation doped Ba0.9Co0.7Fe0.3O3−δ perovskite cathode for solid oxide fuel cells, Sustainable Energy Fuels, 2020, 4, 5229–5237 RSC.
- C. Y. Gu, X. S. Wu, J. F. Cao, J. Hou, L. N. Miao, Y. P. Xia, F. Chao and W. Liu, High performance Ca-containing La2−xCaxNiO4+δ (0 ≤ x ≤ 0.75) cathode for proton-conducting solid oxide fuel cells, Int. J. Hydrogen Energy, 2020, 45, 23422–23432 CrossRef CAS.
- T. Wei, Y. H. Huang, L. Jiang, J. Y. Yang, R. Zeng and J. B. Goodenough, Thermoelectric solid-oxide fuel cell with Ca2Co2O5 as cathode material, RSC Adv., 2013, 3, 2336–2340 RSC.
- P. Xiaokaiti, T. Yu, A. Yoshida, X. Du, X. G. Hao, Y. Kasai, A. Abudula and G. Q. Guan, Effects of cobalt and iron proportions in Pr0.4Sr0.6Co0.9−xFexNb0.1O3−δ electrode material for symmetric solid oxide fuel cells, J. Alloys Compd., 2020, 831, 154738 CrossRef CAS.
- J. H. Bai, Z. Y. Han, B. Lv, X. Chen, X. F. Zhu and D. F. Zhou, Preparation of 3D structure high performance Ba0.5Sr0.5Fe0.8Cu0.2O3−δ nanofiber SOFC cathode material by low-temperature calcination method, Int. J. Hydrogen Energy, 2021, 46, 8132–8142 CrossRef CAS.
- C. Kim, H. Park, I. Jang, S. Kim, K. Kim, H. Yoon and U. Paik, Morphologically well-defined Gd0.1Ce0.9O1.95 embedded Ba0.5Sr0.5Co0.8Fe0.2O3−δ nanofiber with an enhanced triple phase boundary as cathode for low-temperature solid oxide fuel cells, J. Power Sources, 2018, 378, 404–411 CrossRef CAS.
- S. Liu, B. Yu, W. Zhang, Y. Zhai and J. Chen, Electrochemical performance of Co-containing mixed oxides as oxygen electrode materials for intermediate-temperature solid oxide electrolysis cells, Int. J. Hydrogen Energy, 2016, 41, 15952–15959 CrossRef CAS.
- S. Y. Park, J. H. Ahn, C. W. Jeong, C. W. Na, R. H. Song and J. H. Lee, Ni-YSZ-supported tubular solid oxide fuel cells with GDC interlayer between YSZ electrolyte and LSCF cathode, Int. J. Hydrogen Energy, 2014, 39, 12894–12903 CrossRef CAS.
- K. P. Padmasree, K. Y. Lai, W. Kaveevivitchai and A. Manthiram, Effect of Ca substitution on the electrochemical properties of the Ruddlesden-Popper oxides Sr3.2−xCaxLn0.8Fe1.5Co1.5O10−δ, J. Power Sources, 2018, 374, 249–256 CrossRef CAS.
- D. Fu, F. Jin and T. He, A-site calcium-doped Pr1−xCaxBaCo2O5+δ double perovskites as cathodes for intermediate-temperature solid oxide fuel cells, J. Power Sources, 2016, 313, 134–141 CrossRef CAS.
- W. Y. Gao, J. C. Sun, S. Liu, Y. Liu, C. M. Li and N. L. Tang, Electrical properties and microwave synthesis of mixed rare earth oxide Ln0.7Sr0.3−xCaxCo0.9Fe0.1O3−δ, J. Rare Earths, 2006, 24, 288–292 CrossRef.
- S. R. Bishop, Chemical expansion of solid oxide fuel cell materials: A brief overview, Acta Mech. Sin., 2013, 29, 312–317 CrossRef CAS.
- F. J. Jin, X. L. Liu, X. Y. Chu, Y. Shen and J. H. Li, Effect of nonequivalent substitution of Pr3+/4+ with Ca2+ in PrBaCoFeO5+δ as cathodes for IT-SOFC, J. Mater. Sci., 2021, 56, 1147–1161 CrossRef CAS.
- Y. Cao, H. Gu, H. Chen, Y. Zheng, M. Zhou and L. Guo, Preparation and characterization of Nd2−xSrxCoO4+δ cathodes for intermediate-temperature solid oxide fuel cell, Int. J. Hydrogen Energy, 2010, 35, 5594–5600 CrossRef CAS.
- A. Egger, E. Bucher, M. Yang and W. Sitte, Comparison of oxygen exchange kinetics of the IT-SOFC cathode materials La0.5Sr0.5CoO3−δ and La0.6Sr0.4CoO3−δ, Solid State Ionics, 2012, 225, 55–60 CrossRef CAS.
- C. Lim, Y. Yang, Y.-w. Sin, S. Choi and G. Kim, Ca- and Ni-Doped Pr0.5Ba0.5FeO3−δ as a Highly Active and Robust Cathode for High-Temperature Solid Oxide Fuel Cell, Energy Fuels, 2020, 34, 11458–11463 CrossRef CAS.
- J. H. Kim, X-ray photoelectron spectroscopy analysis of (Ln1−xSrx)CoO3−δ (Ln: Pr, Nd and Sm), Appl. Surf. Sci., 2011, 258, 350–355 CrossRef CAS.
- M. Wu, H. D. Cai, F. J. Jin, N. Sun, J. S. Xu, L. L. Zhang, X. Han, S. B. Wang, X. G. Su, W. Long, L. Wang and L. Zhang, Assessment of cobalt-free ferrite-based perovskite Ln0.5Sr0.5Fe0.9Mo0.1O3−δ (Ln = lanthanide) as cathodes for IT-SOFCs, J. Eur. Ceram. Soc., 2021, 41, 2682–2690 CrossRef CAS.
- A. Niemczyk, A. Olszewska, Z. Du, Z. Zhang, K. Świerczek and H. Zhao, Assessment of layered La2−x(Sr,Ba)xCuO4−δ oxides as potential cathode materials for SOFCs, Int. J. Hydrogen Energy, 2018, 43, 15492–15504 CrossRef CAS.
- A. Subardi, K.-Y. Liao and Y.-P. Fu, Oxygen transport, thermal and electrochemical properties of NdBa0.5Sr0.5Co2O5+δ cathode for SOFCs, J. Eur. Ceram. Soc., 2019, 39, 30–40 CrossRef CAS.
- H. Wang, G. Li, X. Guan, M. Zhao and L. Li, Lightly doping Ca2+ in perovskite PrCoO3 for tailored spin states and electrical properties, Phys. Chem. Chem. Phys., 2011, 13, 17775–17784 RSC.
- M. Ferkhi, M. Rekaik, A. Khaled, M. Cassir and J. J. Pireaux, Neodymium nickelate Nd2−xSrxNi1−yCoyO4±d (x and y = 0 or 0.05) as cathode materials for the oxygen reduction reaction, Electrochim. Acta, 2017, 229, 281–290 CrossRef CAS.
- J. C. Grenier, F. Mauvy, C. Lalanne, J.-M. Bassat, F. Chauveau, J. Mougin, J. Dailly and M. Marrony, A2MO4+δ Oxides: Flexible Electrode Materials for Solid Oxide Cells, ECS Trans., 2019, 25, 2537–2546 CrossRef.
- C. He, S. Eisenberg, C. Jan, H. Zheng, J. F. Mitchell and C. Leighton, Heat capacity study of magnetoelectronic phase separation in La1−xSrxCoO3 single crystals, Phys. Rev. B, 2009, 80, 9 Search PubMed.
Footnote |
| † Electronic supplementary information (ESI) available. See https://doi.org/10.1039/d2ra02546a |
| This journal is © The Royal Society of Chemistry 2022 |

