 Open Access Article
Creative Commons Attribution 3.0 Unported Licence
Mesoporous-rich calcium and potassium-activated carbons prepared from degreased spent coffee grounds for efficient removal of MnO42− in aqueous media†
Suranjana Bose*,
Rebecca D. Kirk ,
Harry Maslen,
Martha A. Pardo Islas
 ,
Benedict Smith,
Thomas I. J. Dugmore
 * and
Avtar S. Matharu
 *
*
Green Chemistry Centre of Excellence, Department of Chemistry, University of York, YO10 5DD, UK. E-mail: suranjana.bose@york.ac.uk; tom.dugmore@york.ac.uk; avtar.matharu@york.ac.uk
First published on 4th July 2022
Abstract
Commercial ACs typically possess high surface areas and high microporosity. However, ACs with appreciable mesoporosity are growing in consideration and demand because they are beneficial for the adsorption of large species, such as heavy metal ions. Thus, in this study, degreased coffee grounds (DCG) were used as precursors for the production of ACs by means of chemical activation at 600 °C for the efficient removal of manganese in the form of MnO42−. One of the most common activating agents, ZnCl2, is replaced by benign and sustainable CaCl2 and K2CO3. Three ratios 1![[thin space (1/6-em)]](https://www.rsc.org/images/entities/char_2009.gif) :
:![[thin space (1/6-em)]](https://www.rsc.org/images/entities/char_2009.gif) 1, 1
1, 1![[thin space (1/6-em)]](https://www.rsc.org/images/entities/char_2009.gif) :
:![[thin space (1/6-em)]](https://www.rsc.org/images/entities/char_2009.gif) 0.5 and 1
0.5 and 1![[thin space (1/6-em)]](https://www.rsc.org/images/entities/char_2009.gif) :
:![[thin space (1/6-em)]](https://www.rsc.org/images/entities/char_2009.gif) 0.1 of precursor-to-activating agent (g g−1) were investigated. Porosimetry indicates 1
0.1 of precursor-to-activating agent (g g−1) were investigated. Porosimetry indicates 1![[thin space (1/6-em)]](https://www.rsc.org/images/entities/char_2009.gif) :
:![[thin space (1/6-em)]](https://www.rsc.org/images/entities/char_2009.gif) 1 CaCl2 DCGAC is highly mesoporous (mesopore volume 0.469 cm3 g−1). CaCl2 DCGAC and K2CO3 DCGAC shows high adsorption capacities of 0.494 g g−1 and 0.423 g g−1, respectively for the uptake of MnO42− in aqueous media. The adsorption process follows pseudo-second order kinetics inline with the Freundlich isotherm (R2 > 0.9). Thermodynamic data revealed negative values of ΔG (approx −0.1751 kJ mol−1) demonstrating that the adsorption process on 1
1 CaCl2 DCGAC is highly mesoporous (mesopore volume 0.469 cm3 g−1). CaCl2 DCGAC and K2CO3 DCGAC shows high adsorption capacities of 0.494 g g−1 and 0.423 g g−1, respectively for the uptake of MnO42− in aqueous media. The adsorption process follows pseudo-second order kinetics inline with the Freundlich isotherm (R2 > 0.9). Thermodynamic data revealed negative values of ΔG (approx −0.1751 kJ mol−1) demonstrating that the adsorption process on 1![[thin space (1/6-em)]](https://www.rsc.org/images/entities/char_2009.gif) :
:![[thin space (1/6-em)]](https://www.rsc.org/images/entities/char_2009.gif) 1 CaCl2DCGAC was spontaneous.
1 CaCl2DCGAC was spontaneous.
1 Introduction
Freshwater availability depletes as the demand for water grows in a higher proportion than the treatment rate. After being used, the quality of water is altered by the presence of pathogens and organic and inorganic chemicals that, in toxic concentrations, make water unsafe for human intake. One particular class of pollutant that is of particular interest are metal ions and salts. Many metal ions in water have harmful, or even toxic properties at very low (<1%) concentrations with most countries imposing strict limits on their concentration in both effluent and drinking water.1,2 The removal of many of these metals from waste water is a serious challenge for water treatment companies worldwide. Many methods for metal contaminant removal from water have been developed including chemical precipitation, ion-exchange, membrane filtration, coagulation–flocculation, flotation or electrochemical separation.3–6 Such methods are generally energy intensive and expensive, and others produce impure sludge as a waste which is difficult to handle, process or valorise.At the same time, the shift towards clean energy technologies and other metal-dependent electronics have dramatically raised the demand of many elements – particularly transition metals and lanthanides, diminishing their availability. Based on current extraction rates and volumes of known reserves, elements such Zn, Se, Sn, Sb, Au, Ti and Pb are referred to as ‘critical elements’ conventional sources of critical elements are projected to be depleted within 5–20 years.7 Recycling metal-rich effluent or sludge from waste water treatment therefore presents a potential means to simultaneously address both of these issues. Coinciding with this growing metal demand is the problem of increasing amounts of unavoidable food supply-chain waste (UFSCW).8 This is an issue identified by the United Nations in the 17 Sustainable Development Goals (SDGs). In particular, SDG12, Target 12.3 states, “By 2030, to halve per capita global food waste at the retail and consumer levels and reduce food losses along production and supply chains, including post-harvest losses”.9 Therefore, material wherever possible should be sourced from waste streams, rather than virgin material, creating an economically favoured waste management route at the end of a material lifecycle. As an example of this, in the coffee industry approximately 6 billion kg of spent coffee grounds (SCGs) are produced annually as UFSCW.10 The common mode of waste management for UFSCW is either biomass burning which, in the case of SCGs, has negative connotations associated with NOx emissions, or aerobic digestion where water soluble ammonia generated from decomposition of SCGs can raise the pH, killing or inhibiting the methanogens that generate methane for renewable fuel. Hence a waste valorisation route for the management of UFSCW spent coffee grounds (SCGs) is highly desirable.
Previously, we reported the production of mesoporous activated carbon (AC) via zinc chloride activation derived from degreased spent coffee grounds (DCGs) in adsorbing gold and chromium from aqueous solutions.10 However, with zinc being a ‘Critical element’, coupled with the health/environmental risks associated with it, it is essential to look for alternative, more benign and sustainable activating agent such as metal chlorides (e.g. Ca, Na). Calcium- and sodium-based activating agents are particularly attractive due to their high availability compared to zinc. Also, the extraction of zinc requires high temperatures to extract the metal from impure ore, whilst calcium carbonate is available in the relatively pure form of limestone and can be extracted at low temperatures using sodium chloride in the Solvay process.11,12 The efficacy of the resultant material was tested for its ability to remove manganese (in the form of MnO42−) from aqueous solutions.
Manganese was selected in part due it being a critical element under severe supply risk but also due to health and environmental risks it poses in effluent streams. Manganese has important functions in biological systems as it is required for many enzymatic processes. A guideline level of 0.05 mg L−1 or 0.1 mg L−1 in drinking water is typically adopted worldwide.1 However, an excess of manganese in the human body can lead to neurological disorders whilst it can cause stunted growth in plants.13 Manganese in water supply services may lead to clogging in the pipelines.14 Additionally, high amounts of manganese can be released to the environment from a range of industrial processes. Manganese is used in the production of alloys, batteries, glass, cleaning products and fireworks13 and is used as a catalyst in many redox reactions.15 Over 90% of all the manganese ores processed is used in steel manufacturing, mostly in the form of ferromanganese.16 Thus, mine tailings and steel processing wastewater are significant sources of manganese pollution. Due to its high solubility in both acid and neutral conditions, manganese is identified as one of the most difficult elements to remove from mine waters with concentrations ranging from 40–140 mg L−1 being reported.17,18 The lack of treatment of these wastes enable manganese to reach surrounding ecosystems, leading to environmental deterioration, where concentrations of manganese in local rivers have been reported to be as high as 200 mg L−1.19 The recovery of manganese from waste streams to reintroduce back into the manufacture and chemical industries therefore presents a valuable opportunity to simultaneously improve the sustainability of these industries whilst also reducing their environmental impact. Reported examples so far have included using KMnO4 doped ACs to oxidise ethylene,20 catalyse reforming of greenhouse gases21 and removal of formaldehyde from indoor air.22
The most stable oxidation state of manganese is +2, hence there has been a substantial amount of work on adsorption of Mn2+ compounds from aqueous media reported.23–27 However, despite being a prominent industrial oxidation agent, adsorption of MnO4− is far less extensively covered with the aforementioned examples focussing primarily on the production and testing of the material for the end purpose, rather than the efficacy of the adsorption of MnO4− to begin with. Herein we report high adsorption capacities of CaCl2 DCGAC and K2CO3 DCGAC for the uptake of MnO42− in aqueous media.
2 Experimental
2.1 Materials and methods
Commercial activated carbon, NORIT, and anhydrous ZnCl2 were purchased from Alfa Aeser. 99% KMnO4, CaCl2, K2CO3 and HCl (analytical grade) were purchased from Fischer Scientific. Spent coffee grounds were sourced from catering outlets at the University of York, oven dried (105 °C) and stored in air-tight polythene bags. All pH measurements were taken using a Jenway model 3505 pH meter and an epoxy-bodied pH electrode with the results shown in the ESI in Table S2.† The nitrogen adsorption–desorption isotherms were recorded at liquid nitrogen temperature (77 K) on a Micromeritics TriStar II Plus porosimeter using the Barrett–Joyner–Halenda (BJH) and Brunauer–Emmett–Teller (BET) method. All SCG and activated DCG samples were carbonised in a ThermoFischer Carbolite muffle furnace. A Genesys 150 UV-Vis spectrometer used for adsorption studies (λmax 525 nm). A 0.00046 M (150 mL) concentration of solution was chosen for analysis and the change in concentration of MnO42− against time agitated with activated carbons (200 mg) was used to determine the adsorption at time t (qt) using eqn (1). This relates the amount of solid added to a known amount of solution, and its change in concentration. Where, C0 is the initial concentration in g mL−1, Ce is the concentration at equilibrium in g mL−1, V is the volume of solution in litres, and W is the quantity of adsorbent in grams. Aliquots (2 mL) were taken every 5 minutes over a 40 minutes interval and their UV-vis spectrum was recorded. The decrease of absorbance at λmax 525 nm was used to determine uptake of MnO42−.
 | (1) |
An Agilent 7700 series ICP-MS was used to conduct ICP-MS semi-quantitative analysis on the activated carbons before and after the adsorption studies. An Exeter Analytical Inc. CE-440 analyser was used to conduct Carbon, Hydrogen & Nitrogen (CHN) composition with the results shown in the ESI in Fig. S2.†
2.2 Production of degreased coffee grounds (DCG)
A mixture of dried spent coffee grounds (25 g) and ethyl acetate (100 mL) was heated to reflux for 2 h. The resulting slurry was cooled, filtered and the filtrate was evaporated in vacuo to dryness, whilst the residue was allowed to air dry until constant weight was achieved to afford the desired degreased coffee grounds (DCG), 21.67 g (86.7%), as a dark brown powder.2.3 Chemical activation of DCG
Three ratios of DCG (10 g)-to-activating agent were investigated: 1![[thin space (1/6-em)]](https://www.rsc.org/images/entities/char_2009.gif) :
:![[thin space (1/6-em)]](https://www.rsc.org/images/entities/char_2009.gif) 1, 1
1, 1![[thin space (1/6-em)]](https://www.rsc.org/images/entities/char_2009.gif) :
:![[thin space (1/6-em)]](https://www.rsc.org/images/entities/char_2009.gif) 0.5 and 1
0.5 and 1![[thin space (1/6-em)]](https://www.rsc.org/images/entities/char_2009.gif) :
:![[thin space (1/6-em)]](https://www.rsc.org/images/entities/char_2009.gif) 0.1, corresponding to 10, 5, and 1 g of activating agent, respectively. The appropriate activating agent (ZnCl2 or CaCl2 or K2CO3) was weighed, dissolved in deionized water (DI) water (30 mL), added to DCG (10 g) and stirred at room temperature for 10 minutes. The slurry was dried at 105 °C for 24 h, ground into a fine powder and transferred to a quartz round-bottom flask to be carbonised. The flask was placed in the muffle furnace under nitrogen flow at 600 °C for 4 h. The resulting carbonised sample was ground into a powder, stirred with 0.5 M aqueous HCl (100 mL) for 10 minutes to remove ash and remaining activating agent, filtered under vacuum, washed with DI water (4 × 25 mL) until neutral pH and dried (105 °C for 24 h) until constant weight was achieved. The yield of DCGs were 22–25%.
0.1, corresponding to 10, 5, and 1 g of activating agent, respectively. The appropriate activating agent (ZnCl2 or CaCl2 or K2CO3) was weighed, dissolved in deionized water (DI) water (30 mL), added to DCG (10 g) and stirred at room temperature for 10 minutes. The slurry was dried at 105 °C for 24 h, ground into a fine powder and transferred to a quartz round-bottom flask to be carbonised. The flask was placed in the muffle furnace under nitrogen flow at 600 °C for 4 h. The resulting carbonised sample was ground into a powder, stirred with 0.5 M aqueous HCl (100 mL) for 10 minutes to remove ash and remaining activating agent, filtered under vacuum, washed with DI water (4 × 25 mL) until neutral pH and dried (105 °C for 24 h) until constant weight was achieved. The yield of DCGs were 22–25%.
3 Results and discussion
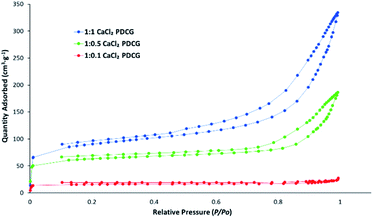
The important characteristic of every adsorbent is its specific surface area that greatly affects its adsorption capacity. The values of specific surface area, micropore volume (below 2 nm) and mesopore volume (2–50 nm) are good indicators of successful manufacture of the ACs before adsorption studies are conducted.The nitrogen porosimetry data is summarised in Table 1 and Fig. 1 shows N2 adsorption–desorption isotherms for CaCl2 impregnated activated carbons. Except for the 1![[thin space (1/6-em)]](https://www.rsc.org/images/entities/char_2009.gif) :
:![[thin space (1/6-em)]](https://www.rsc.org/images/entities/char_2009.gif) 0.1 K2CO3 DCGAC and non-treated (SCDCG and DCGAC), all chemically-treated activated carbons were successfully produced. The ZnCl2 (1
0.1 K2CO3 DCGAC and non-treated (SCDCG and DCGAC), all chemically-treated activated carbons were successfully produced. The ZnCl2 (1![[thin space (1/6-em)]](https://www.rsc.org/images/entities/char_2009.gif) :
:![[thin space (1/6-em)]](https://www.rsc.org/images/entities/char_2009.gif) 1 ZnCl2DCGAC) and K2CO3 (1
1 ZnCl2DCGAC) and K2CO3 (1![[thin space (1/6-em)]](https://www.rsc.org/images/entities/char_2009.gif) :
:![[thin space (1/6-em)]](https://www.rsc.org/images/entities/char_2009.gif) 1 K2CO3DCGAC) activated carbons exhibited surface areas that are considered comparable with commercial NORIT (684 and 556 m2 g−1, respectively). The 1
1 K2CO3DCGAC) activated carbons exhibited surface areas that are considered comparable with commercial NORIT (684 and 556 m2 g−1, respectively). The 1![[thin space (1/6-em)]](https://www.rsc.org/images/entities/char_2009.gif) :
:![[thin space (1/6-em)]](https://www.rsc.org/images/entities/char_2009.gif) 1 CaCl2DCGAC showed a substantial increase in mesoporosity and mesopore volume compared to commercial activated carbon NORIT and in a higher proportion than 1
1 CaCl2DCGAC showed a substantial increase in mesoporosity and mesopore volume compared to commercial activated carbon NORIT and in a higher proportion than 1![[thin space (1/6-em)]](https://www.rsc.org/images/entities/char_2009.gif) :
:![[thin space (1/6-em)]](https://www.rsc.org/images/entities/char_2009.gif) 1 ZnCl2 DCGAC. Also surface area and total pore volume decreases as the amount of activating agent decreases. Hence 1
1 ZnCl2 DCGAC. Also surface area and total pore volume decreases as the amount of activating agent decreases. Hence 1![[thin space (1/6-em)]](https://www.rsc.org/images/entities/char_2009.gif) :
:![[thin space (1/6-em)]](https://www.rsc.org/images/entities/char_2009.gif) 0.1CaCl2DCG has 91% less total pore volume than 1
0.1CaCl2DCG has 91% less total pore volume than 1![[thin space (1/6-em)]](https://www.rsc.org/images/entities/char_2009.gif) :
:![[thin space (1/6-em)]](https://www.rsc.org/images/entities/char_2009.gif) 1 CaCl2DCGAC (Fig. 1) and the chemically unactivated ACs (SCGAC and DCGAC) are non-porous.
1 CaCl2DCGAC (Fig. 1) and the chemically unactivated ACs (SCGAC and DCGAC) are non-porous.
| Activated carbon | Surface area (m2 g−1) | Micropore vol. (cm3 g−1) | Mesopore vol. (cm3 g−1) |
|---|---|---|---|
| NORIT | 677 | 0.497 | 0.272 |
1![[thin space (1/6-em)]](https://www.rsc.org/images/entities/char_2009.gif) : :![[thin space (1/6-em)]](https://www.rsc.org/images/entities/char_2009.gif) 1 ZnCl2 DCGAC 1 ZnCl2 DCGAC |
684 | 0.234 | 0.526 |
1![[thin space (1/6-em)]](https://www.rsc.org/images/entities/char_2009.gif) : :![[thin space (1/6-em)]](https://www.rsc.org/images/entities/char_2009.gif) 1 CaCl2 DCGAC 1 CaCl2 DCGAC |
305 | 0.142 | 0.469 |
1![[thin space (1/6-em)]](https://www.rsc.org/images/entities/char_2009.gif) : :![[thin space (1/6-em)]](https://www.rsc.org/images/entities/char_2009.gif) 0.5 CaCl2 DCGAC 0.5 CaCl2 DCGAC |
205 | 0.103 | 0.223 |
1![[thin space (1/6-em)]](https://www.rsc.org/images/entities/char_2009.gif) : :![[thin space (1/6-em)]](https://www.rsc.org/images/entities/char_2009.gif) 0.1 CaCl2 DCGAC 0.1 CaCl2 DCGAC |
50.8 | 0.030 | 0.022 |
1![[thin space (1/6-em)]](https://www.rsc.org/images/entities/char_2009.gif) : :![[thin space (1/6-em)]](https://www.rsc.org/images/entities/char_2009.gif) 1 K2CO3 DCGAC 1 K2CO3 DCGAC |
477 | 0.253 | 0.105 |
1![[thin space (1/6-em)]](https://www.rsc.org/images/entities/char_2009.gif) : :![[thin space (1/6-em)]](https://www.rsc.org/images/entities/char_2009.gif) 0.5 K2CO3 DCGAC 0.5 K2CO3 DCGAC |
556 | 0.291 | 0.134 |
1![[thin space (1/6-em)]](https://www.rsc.org/images/entities/char_2009.gif) : :![[thin space (1/6-em)]](https://www.rsc.org/images/entities/char_2009.gif) 0.1 K2CO3 DCGAC 0.1 K2CO3 DCGAC |
2.74 | 0 | 0 |
| SCGAC (unactivated) | 0.63 | 0 | 0 |
| DCGAC (unactivated) | 0.38 | 0 | 0 |
The use of calcium chloride as an activating agent is less commonly seen in literature; therefore, the mechanism of its action is less decided. What is known though is that calcium chloride is hygroscopic and can form hydrated solids. That the DCGs were impregnated with a concentrated aqueous solution of calcium chloride before drying at 105 °C suggests a large presence of calcium chloride monohydrate and dihydrate (CaCl2(H2O)x, where x = 1, 2) in the sample before pyrolysis.28 These would undergo gasification at 600 °C, contributing to pore development in a similar manner to the gasification of potassium carbonate.
The mechanism of activation by potassium carbonate is well understood and documented in literature.29,30 Because potassium carbonate is a weak base, it cannot induce the same dehydrations as zinc chloride upon impregnation. At 600 °C, the temperature is sufficient to induce the decomposition of surface oxygen groups, releasing CO2 and CO.31,32 Throughout the pyrolysis step, resultant char (carbon) reduces the potassium carbonate to metallic K and CO, or the potassium carbonate undergoes degasification to K2O and CO2.29,30 The molten, metallic K is credited with expanding adjacent layers of the carbon network and developing porosity, and the evolution of the gases is effective at minimising tar formation within the structure.
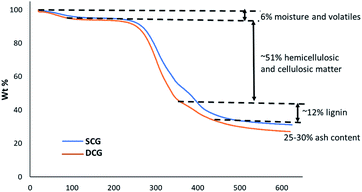
Fig. 2 shows the thermogravimetric analysis (TGA) for spent coffee grounds (SCG) and degreased coffee grounds (DCG) at the heating rate of 10 °C min−1 under nitrogen flow. A typical thermogram for the thermal decomposition of (ligno)cellulosic matter is observed. The thermogram reveals approx. 6% moisture and volatiles, 55–60% hemicellulosic and cellulosic matter and at 625 °C, approximately 25–30% of residual matter.
Table 2 shows the maximum amount of MnO42− adsorbed onto the DCGACs for each experiment, qmax, using 0.00046 M KMnO4 solution alongside values obtained from literature for comparison.
| Activated carbons | qmax (MnO42−) (g g−1) |
|---|---|
| NORIT | 0.494 |
1![[thin space (1/6-em)]](https://www.rsc.org/images/entities/char_2009.gif) : :![[thin space (1/6-em)]](https://www.rsc.org/images/entities/char_2009.gif) 1 ZnCl2DCGAC 1 ZnCl2DCGAC |
0.492 |
1![[thin space (1/6-em)]](https://www.rsc.org/images/entities/char_2009.gif) : :![[thin space (1/6-em)]](https://www.rsc.org/images/entities/char_2009.gif) 1 CaCl2DCGAC 1 CaCl2DCGAC |
0.494 |
1![[thin space (1/6-em)]](https://www.rsc.org/images/entities/char_2009.gif) : :![[thin space (1/6-em)]](https://www.rsc.org/images/entities/char_2009.gif) 0.5 CaCl2DCGAC 0.5 CaCl2DCGAC |
0.392 |
1![[thin space (1/6-em)]](https://www.rsc.org/images/entities/char_2009.gif) : :![[thin space (1/6-em)]](https://www.rsc.org/images/entities/char_2009.gif) 0.1 CaCl2DCGAC 0.1 CaCl2DCGAC |
0.256 |
1![[thin space (1/6-em)]](https://www.rsc.org/images/entities/char_2009.gif) : :![[thin space (1/6-em)]](https://www.rsc.org/images/entities/char_2009.gif) 1 K2CO3DCGAC 1 K2CO3DCGAC |
0.279 |
1![[thin space (1/6-em)]](https://www.rsc.org/images/entities/char_2009.gif) : :![[thin space (1/6-em)]](https://www.rsc.org/images/entities/char_2009.gif) 0.5 K2CO3DCGAC 0.5 K2CO3DCGAC |
0.423 |
1![[thin space (1/6-em)]](https://www.rsc.org/images/entities/char_2009.gif) : :![[thin space (1/6-em)]](https://www.rsc.org/images/entities/char_2009.gif) 0.1 K2CO3DCGAC 0.1 K2CO3DCGAC |
0.372 |
| Unactivated DCGAC | 0.173 |
| Animal bone AC33 | 0.028 |
| Coconut shell AC20 | 0.024 |
| Commercial AC34 | 0.037 |
| Corncob AC33 | 0.026 |
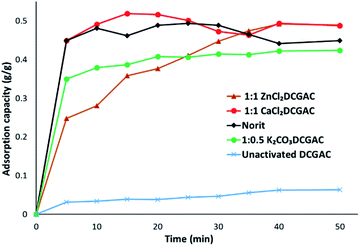
Fig. 3 shows that 1![[thin space (1/6-em)]](https://www.rsc.org/images/entities/char_2009.gif) :
:![[thin space (1/6-em)]](https://www.rsc.org/images/entities/char_2009.gif) 1 ZnCl2 and 1
1 ZnCl2 and 1![[thin space (1/6-em)]](https://www.rsc.org/images/entities/char_2009.gif) :
:![[thin space (1/6-em)]](https://www.rsc.org/images/entities/char_2009.gif) 1 CaCl2DCGACs have similar adsorptive properties to that of NORIT over a 40 minutes timeframe. NORIT was chosen as the commercial standard due to its high surface area (677 m2 g−1), high micropore volume (0.497 cm3 g−1) and appreciable mesopore volume (0.272 cm3 g−1).
1 CaCl2DCGACs have similar adsorptive properties to that of NORIT over a 40 minutes timeframe. NORIT was chosen as the commercial standard due to its high surface area (677 m2 g−1), high micropore volume (0.497 cm3 g−1) and appreciable mesopore volume (0.272 cm3 g−1).
Fig. 4 shows the change in qmax of CaCl2DCGACs when varying the quantity of activating agent between ratios 1![[thin space (1/6-em)]](https://www.rsc.org/images/entities/char_2009.gif) :
:![[thin space (1/6-em)]](https://www.rsc.org/images/entities/char_2009.gif) 1 (10 g DCG
1 (10 g DCG![[thin space (1/6-em)]](https://www.rsc.org/images/entities/char_2009.gif) :
:![[thin space (1/6-em)]](https://www.rsc.org/images/entities/char_2009.gif) 10 g activating agent), 1
10 g activating agent), 1![[thin space (1/6-em)]](https://www.rsc.org/images/entities/char_2009.gif) :
:![[thin space (1/6-em)]](https://www.rsc.org/images/entities/char_2009.gif) 0.5 (10 g DCG
0.5 (10 g DCG![[thin space (1/6-em)]](https://www.rsc.org/images/entities/char_2009.gif) :
:![[thin space (1/6-em)]](https://www.rsc.org/images/entities/char_2009.gif) 5 g activating agent) and 1
5 g activating agent) and 1![[thin space (1/6-em)]](https://www.rsc.org/images/entities/char_2009.gif) :
:![[thin space (1/6-em)]](https://www.rsc.org/images/entities/char_2009.gif) 0.1 (10 g DCG
0.1 (10 g DCG![[thin space (1/6-em)]](https://www.rsc.org/images/entities/char_2009.gif) :
:![[thin space (1/6-em)]](https://www.rsc.org/images/entities/char_2009.gif) 1 g activating agent). This shows that qmax decreases as the amount of CaCl2 decreases, i.e., 1
1 g activating agent). This shows that qmax decreases as the amount of CaCl2 decreases, i.e., 1![[thin space (1/6-em)]](https://www.rsc.org/images/entities/char_2009.gif) :
:![[thin space (1/6-em)]](https://www.rsc.org/images/entities/char_2009.gif) 1 CaCl2DCGAC (qmax, approx. 0.5 g g−1) > 1
1 CaCl2DCGAC (qmax, approx. 0.5 g g−1) > 1![[thin space (1/6-em)]](https://www.rsc.org/images/entities/char_2009.gif) :
:![[thin space (1/6-em)]](https://www.rsc.org/images/entities/char_2009.gif) 0.5 CaCl2DCGAC (qmax, approx. 0.4 g g−1) > 1
0.5 CaCl2DCGAC (qmax, approx. 0.4 g g−1) > 1![[thin space (1/6-em)]](https://www.rsc.org/images/entities/char_2009.gif) :
:![[thin space (1/6-em)]](https://www.rsc.org/images/entities/char_2009.gif) 0.1 CaCl2DCGAC (qmax, approx. 0.22 g g−1). This is to be expected given that the mesopore volume also decreases as the amount of CaCl2 (activating agent) decreases. Given that the Topological Polar Surface Area of the MnO4− is computed to be 7.43 nm it would therefore be expected that it's adsorption onto surfaces would be affected more by the availability of mesopores (2–50 nm) than micropores. Hence 1
0.1 CaCl2DCGAC (qmax, approx. 0.22 g g−1). This is to be expected given that the mesopore volume also decreases as the amount of CaCl2 (activating agent) decreases. Given that the Topological Polar Surface Area of the MnO4− is computed to be 7.43 nm it would therefore be expected that it's adsorption onto surfaces would be affected more by the availability of mesopores (2–50 nm) than micropores. Hence 1![[thin space (1/6-em)]](https://www.rsc.org/images/entities/char_2009.gif) :
:![[thin space (1/6-em)]](https://www.rsc.org/images/entities/char_2009.gif) 1 ZnCl2DCGAC and 1
1 ZnCl2DCGAC and 1![[thin space (1/6-em)]](https://www.rsc.org/images/entities/char_2009.gif) :
:![[thin space (1/6-em)]](https://www.rsc.org/images/entities/char_2009.gif) 1 CaCl2DCGAC show highest uptake of MnO4− ions as they have considerably higher mesopore volume than other DCGACs (Table 1). This is further reflected by the fact that the values for MnO4− on microporous activated carbons reported in Table 2 are of an order of magnitude lower. Notably, the qmax of the coconut shell AC was just 0.024 g g−1, despite using an AC that had a superior surface area of 1940 m2 g−1, but an average pore diameter of just 2.36 nm.35
1 CaCl2DCGAC show highest uptake of MnO4− ions as they have considerably higher mesopore volume than other DCGACs (Table 1). This is further reflected by the fact that the values for MnO4− on microporous activated carbons reported in Table 2 are of an order of magnitude lower. Notably, the qmax of the coconut shell AC was just 0.024 g g−1, despite using an AC that had a superior surface area of 1940 m2 g−1, but an average pore diameter of just 2.36 nm.35
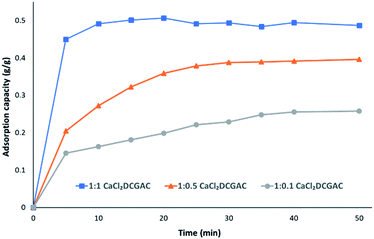 | ||
Fig. 4 Adsorption capacity data for 1![[thin space (1/6-em)]](https://www.rsc.org/images/entities/char_2009.gif) : :![[thin space (1/6-em)]](https://www.rsc.org/images/entities/char_2009.gif) 1 CaCl2DCGAC, 1 1 CaCl2DCGAC, 1![[thin space (1/6-em)]](https://www.rsc.org/images/entities/char_2009.gif) : :![[thin space (1/6-em)]](https://www.rsc.org/images/entities/char_2009.gif) 0.5 CaCl2DCGAC and 1 0.5 CaCl2DCGAC and 1![[thin space (1/6-em)]](https://www.rsc.org/images/entities/char_2009.gif) : :![[thin space (1/6-em)]](https://www.rsc.org/images/entities/char_2009.gif) 0.1 CaCl2DCGAC agitated with 0.00046 M KMnO4 solution at room temperature and atmospheric pressure. 0.1 CaCl2DCGAC agitated with 0.00046 M KMnO4 solution at room temperature and atmospheric pressure. | ||
The adsorption capacity was mapped onto pseudo-first and -second order kinetic theorems to investigate the rate of uptake of the contaminant using eqn (2) and (3) respectively.
| qt = qe(1 − ekft) | (2) |
 | (3) |
Kinetic analysis (Fig. 5) was undertaken for the adsorption of MnO42− by 1![[thin space (1/6-em)]](https://www.rsc.org/images/entities/char_2009.gif) :
:![[thin space (1/6-em)]](https://www.rsc.org/images/entities/char_2009.gif) 0.5 CaCl2DCGAC in 0.00046 M KMnO4 solution at room temperature. The data showed that adsorption follows pseudo second order kinetics at a near perfect precision to the theoretical prediction. This indicates that the adsorbent concentration is independent of the adsorption capacity of the adsorbent. The mechanism in the rate-limiting step is chemisorption, presumably entailing valence bonds between the metal ions and the materials surface.36
0.5 CaCl2DCGAC in 0.00046 M KMnO4 solution at room temperature. The data showed that adsorption follows pseudo second order kinetics at a near perfect precision to the theoretical prediction. This indicates that the adsorbent concentration is independent of the adsorption capacity of the adsorbent. The mechanism in the rate-limiting step is chemisorption, presumably entailing valence bonds between the metal ions and the materials surface.36
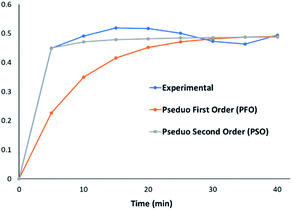 | ||
Fig. 5 Kinetic modelling for the adsorption of MnO42− by 1![[thin space (1/6-em)]](https://www.rsc.org/images/entities/char_2009.gif) : :![[thin space (1/6-em)]](https://www.rsc.org/images/entities/char_2009.gif) 1 CaCl2DCGAC in 0.00046 M KMnO4 solution at room temperature. 1 CaCl2DCGAC in 0.00046 M KMnO4 solution at room temperature. | ||
The strength of binding of the adsorbate and adsorbent was investigated using the Freundlich isotherm (eqn (4)), in particular its linearised form (eqn (5)).37
 | (4) |
 | (5) |
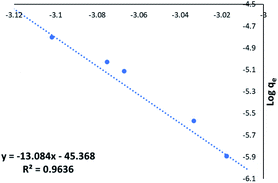
The Freundlich plot for NORIT (Fig. 6) showed excellent linearity (R2 = 0.9636). The Langmuir isotherm was also investigated and is shown in ESI (Fig. S2†) but its regression was poorer (R2 = 0.7895). An excellent fit with the Freundlich model predicts strong adsorption to the adsorbent surface (NORIT) and the rate of binding is independent of the concentration of MnO42− ions in the adsorbent solution. Furthermore, it predicts a large capacity for adsorption by the material.
Fig. 7a shows excellent linearity of the Freundlich plot for the 1![[thin space (1/6-em)]](https://www.rsc.org/images/entities/char_2009.gif) :
:![[thin space (1/6-em)]](https://www.rsc.org/images/entities/char_2009.gif) 1 CaCl2DCGAC indicating strong adsorption and a match to the Freundlich theory, similar to NORIT. Therefore, the CaCl2 treated DCGACs are expected to have a strong binding mechanism with adsorbent, without any effect of the adsorbent concentration. Fig. 7b shows the Freundlich plot of the 1
1 CaCl2DCGAC indicating strong adsorption and a match to the Freundlich theory, similar to NORIT. Therefore, the CaCl2 treated DCGACs are expected to have a strong binding mechanism with adsorbent, without any effect of the adsorbent concentration. Fig. 7b shows the Freundlich plot of the 1![[thin space (1/6-em)]](https://www.rsc.org/images/entities/char_2009.gif) :
:![[thin space (1/6-em)]](https://www.rsc.org/images/entities/char_2009.gif) 1 K2CO3 DCGAC for MnO42− uptake. As seen previously, there is excellent linearity to this isotherm (R2 = 0.9888). This shows that these ACs follow the Freundlich isotherm with accurate proximity. Therefore, the binding of MnO42− ions onto the DCGAC is strong and the rate of binding is independent of the concentration of MnO42− ions in the adsorbent solution.
1 K2CO3 DCGAC for MnO42− uptake. As seen previously, there is excellent linearity to this isotherm (R2 = 0.9888). This shows that these ACs follow the Freundlich isotherm with accurate proximity. Therefore, the binding of MnO42− ions onto the DCGAC is strong and the rate of binding is independent of the concentration of MnO42− ions in the adsorbent solution.
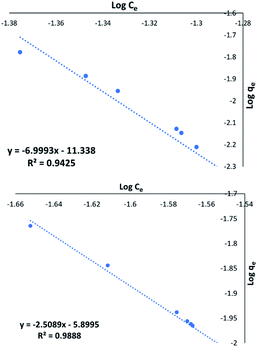 | ||
Fig. 7 (a) Freundlich plot for the MnO42− uptake by 1![[thin space (1/6-em)]](https://www.rsc.org/images/entities/char_2009.gif) : :![[thin space (1/6-em)]](https://www.rsc.org/images/entities/char_2009.gif) 1 CaCl2DCGAC in 0.00046 M KMnO4, (b) Freundlich plot for the MnO42− uptake by 1 1 CaCl2DCGAC in 0.00046 M KMnO4, (b) Freundlich plot for the MnO42− uptake by 1![[thin space (1/6-em)]](https://www.rsc.org/images/entities/char_2009.gif) : :![[thin space (1/6-em)]](https://www.rsc.org/images/entities/char_2009.gif) 1 K2CO3 DCGAC in 0.00046 M KMnO4 solution. 1 K2CO3 DCGAC in 0.00046 M KMnO4 solution. | ||
Thermodynamic studies were conducted to develop insight into the effect of temperature on the uptake of the adsorbent and to calculate thermodynamic parameters of the adsorption reactions. This effect was measured at 4 varying temperatures, 293 K, 308 K, 318 K and 328 K. The changes in concentration of the KMnO4 solution were examined and eqn (6) was used to determine the standard Gibbs free energy of each of the reactions occurring at the varying temperatures.38
ΔGθ = −RT![[thin space (1/6-em)]](https://www.rsc.org/images/entities/char_2009.gif) ln ln![[thin space (1/6-em)]](https://www.rsc.org/images/entities/char_2009.gif) K K
| (6) |
 | (7) |
![[thin space (1/6-em)]](https://www.rsc.org/images/entities/char_2009.gif) :
:![[thin space (1/6-em)]](https://www.rsc.org/images/entities/char_2009.gif) 1 CaCl2DCGAC was a spontaneous process, and the increase of ΔG values with the increase of temperature indicated that the adsorption became less favourable at higher temperatures.
1 CaCl2DCGAC was a spontaneous process, and the increase of ΔG values with the increase of temperature indicated that the adsorption became less favourable at higher temperatures.
![[thin space (1/6-em)]](https://www.rsc.org/images/entities/char_2009.gif) :
:![[thin space (1/6-em)]](https://www.rsc.org/images/entities/char_2009.gif) 1 CaCl2DCGAC
1 CaCl2DCGAC
| T (K) | ΔG (kJ mol−1) | ΔH (kJ mol−1) | ΔS (J K−1 mol−1) |
|---|---|---|---|
| 293 | −0.1841 | −0.2627 | 0.1418 |
| 308 | −0.1751 | ||
| 318 | −0.1696 | ||
| 328 | −0.1645 |
ICP-MS analysis of the DCGACs post adsorption studies gave an insight into the increase in the elemental concentration of the relevant elements from the solutions. Table 4 shows the increase in percentage of Mn after the adsorption studies clearly indicating a significant uptake of MnO42−.
| Activated carbons | Mn content originally (%) | Mn content after MnO42− adsorption studies (%) |
|---|---|---|
1![[thin space (1/6-em)]](https://www.rsc.org/images/entities/char_2009.gif) : :![[thin space (1/6-em)]](https://www.rsc.org/images/entities/char_2009.gif) 0.5 CaCl2DCGAC 0.5 CaCl2DCGAC |
Below detection limit | 0.025 |
1![[thin space (1/6-em)]](https://www.rsc.org/images/entities/char_2009.gif) : :![[thin space (1/6-em)]](https://www.rsc.org/images/entities/char_2009.gif) 0.5 K2CO3 DCGAC 0.5 K2CO3 DCGAC |
0.0019 | 0.040 |
Conclusions
Remediation of manganese from effluent is both an environmental problem but also, an opportunity for resource recovery. Activated carbons and their production from CaCl2 and K2CO3 activated degreased spent coffee grounds can be successfully employed as an alternative to ZnCl2 to produce good quality ACs. Porosimetry indicates 1![[thin space (1/6-em)]](https://www.rsc.org/images/entities/char_2009.gif) :
:![[thin space (1/6-em)]](https://www.rsc.org/images/entities/char_2009.gif) 1 CaCl2DCGAC is highly mesoporous (mesopore volume 0.469 cm3 g−1). CaCl2DCGAC and K2CO3DCGAC showed high adsorption capacities of 0.494 g g−1 and 0.423 g g−1 respectively for the uptake of MnO42− in aqueous medium.
1 CaCl2DCGAC is highly mesoporous (mesopore volume 0.469 cm3 g−1). CaCl2DCGAC and K2CO3DCGAC showed high adsorption capacities of 0.494 g g−1 and 0.423 g g−1 respectively for the uptake of MnO42− in aqueous medium.
As the consumption of filtered and brewed coffee continues to increase then the volume of this under-utilised resource will also increase. Although this study provides new insights in to the valorization of spent coffee grounds, its offering as a commercial activity will require a full techno-economic assessment, including security of supply and full life-cycle assessment.
Author contributions
R. K., H. M., B. S. and M. P. I. investigation and methodology. S. B., investigation, methodology, writing the first draft and editing. T. I. J. D. & A. S. M. – funding acquisition, conception, supervision and final editing.Conflicts of interest
There are no conflicts to declare.Acknowledgements
A. S. M. would like to thank the British Council and the Newton Fund to support S. B. as a research technician. This work was supported by an Institutional Links grant, ID 527663548, under the UK-Colombia partnership. The grant is funded by the UK Department for Business, Energy and Industrial Strategy and Minciencias (formerly Colciencias) and delivered by the British Council. For further information, please visit https://www.newtonfund.ac.uk.Notes and references
- W. H. Organization, WHO. and W. H. O. Staff, Guidelines for drinking-water quality, World Health Organization, 2004 Search PubMed.
- M. Kumar and A. Puri, Indian J. Occup. Environ. Med., 2012, 16, 40–44 CrossRef PubMed.
- F. Fu and Q. Wang, J. Environ. Manage., 2011, 92, 407–418 CrossRef CAS PubMed.
- W. C. Leung, M.-F. Wong, H. Chua, W. Lo, P. Yu and C. Leung, Water Sci. Technol., 2000, 41, 233–240 CrossRef CAS.
- M. S. M. Yusof, M. H. D. Othman, R. A. Wahab, K. Jumbri, F. I. A. Razak, T. A. Kurniawan, R. A. Samah, A. Mustafa, M. A. Rahman and J. Jaafar, J. Hazard. Mater., 2020, 383, 121214 CrossRef CAS PubMed.
- T. A. Kurniawan, G. Y. Chan, W.-H. Lo and S. Babel, Chem. Eng. J., 2006, 118, 83–98 CrossRef CAS.
- N. Supanchaiyamat and A. J. Hunt, ChemSusChem, 2019, 12, 397–403 CrossRef CAS PubMed.
- J. Stone, G. Garcia-Garcia and S. Rahimifard, Waste Biomass Valorization, 2020, 11, 5733–5748 CrossRef CAS.
- F. Stewart, J. Glob. Ethics, 2015, 11, 288–293 CrossRef.
- T. I. Dugmore, Z. Chen, S. Foster, C. Peagram and A. S. Matharu, ChemSusChem, 2019, 12, 4074–4081 CrossRef CAS PubMed.
- R. Kemp and S. E. Keegan, in Ullmann's Encyclopedia of Industrial Chemistry, 2000, DOI:10.1002/14356007.a04_547.
- U.S. Geological Survey, Mineral commodity summaries 2020: U.S. Geological Survey, 2020, p. 200, DOI:10.3133/mcs2020.
- P. Rumsby, L. Rockett, H. Clegg, J. Jonsson, V. Benson, M. Harman, T. Doyle, L. Rushton, D. Wilkinson and P. Warwick, Toxicol. Lett., 2014, S120 CrossRef.
- J. E. Tobiason, A. Bazilio, J. Goodwill, X. Mai and C. Nguyen, Curr. Pollut. Rep., 2016, 2, 168–177 CrossRef CAS.
- C. Freire, C. Pereira, A. F. Peixoto and D. M. Fernandes, in Sustainable Catalysis, 2015, pp. 278–343 Search PubMed.
- R. Singh, in Applied Welding Engineering, ed. R. Singh, Butterworth-Heinemann, (2nd edn), 2016, pp. 7–11, DOI:10.1016/B978-0-12-804176-5.00002-5.
- A. M. Silva, E. C. Cunha, F. D. Silva and V. A. Leão, J. Cleaner Prod., 2012, 29, 11–19 CrossRef.
- R. G. M. Meza, M. T. C. Barragán, P. Z. Rivera, A. G. Álvarez and L. A. A. Holguín, Rev. Int. Contam. Ambiental, 2017, 55–63 CrossRef.
- A. Gómez-Álvarez, A. Villabla-Atondo, G. Acosta-Ruíz, M. Castañeda-Olivares and D. Kamp, Rev. Int. Contam. Ambiental, 2004, 20, 5–12 Search PubMed.
- F. Aprilliani, E. Warsiki and A. Iskandar, IOP Conf. Ser. Earth Environ. Sci., 2018, 141, 012003 CrossRef.
- G. Zhang, Y. Sun, P. Zhao, Y. Xu, A. Su and J. Qu, J. CO2 Util., 2017, 20, 129–140 CrossRef CAS.
- S.-C. Hu, Y.-C. Chen, X.-Z. Lin, A. Shiue, P.-H. Huang, Y.-C. Chen, S.-M. Chang, C.-H. Tseng and B. Zhou, Environ. Sci. Pollut. Res., 2018, 25, 28525–28545 CrossRef CAS PubMed.
- A. Omri and M. Benzina, Alexandria Eng. J., 2012, 51, 343–350 CrossRef CAS.
- D. Savova, N. Petrov, M. Yardim, E. Ekinci, T. Budinova, M. Razvigorova and V. Minkova, Carbon, 2003, 41, 1897–1903 CrossRef CAS.
- R. Buamah, B. Petrusevski, D. De Ridder, T. Van de Wetering and J. Shippers, Water Sci. Technol.: Water Supply, 2009, 9, 89–98 CAS.
- K. Emmanuel and A. V. Rao, E-J. Chem., 2009, 6, 693–704 CrossRef CAS.
- N. Y. Rachel, N. J. Nsami, B. B. Placide, K. Daouda, A. A. Victoire, T. M. Benadette and K. J. Mbadcam, Int. J. Innov. Sci. Eng. Technol., 2015, 2, 606–614 Search PubMed.
- PubChem, Calcium Chloride, https://pubchem.ncbi.nlm.nih.gov/compound/Calcium-chloride, (accessed 13 August 2021) Search PubMed.
- A. F. Abbas and M. J. Ahmed, J. Water Proc. Eng., 2016, 9, 201–207 CrossRef.
- D. Adinata, W. M. A. W. Daud and M. K. Aroua, Bioresour. Technol., 2007, 98, 145–149 CrossRef CAS PubMed.
- T. Horikawa, Y. Kitakaze, T. Sekida, J. i. Hayashi and M. Katoh, Bioresour. Technol., 2010, 101, 3964–3969 CrossRef CAS PubMed.
- J. L. Figueiredo, M. Pereira, M. Freitas and J. Orfao, Carbon, 1999, 37, 1379–1389 CrossRef CAS.
- J. Ezeugo and C. Anadebe, Equatorial Journal of Engineering, 2018, 2018, 14–21 Search PubMed.
- G. S. Reddy and M. M. Reddy, J. Chem. Pharm. Res., 2014, 6, 480–488 Search PubMed.
- I. A. W. Tan, A. L. Ahmad and B. H. Hameed, J. Hazard. Mater., 2008, 154, 337–346 CrossRef CAS PubMed.
- Y.-S. Ho and G. McKay, Process Biochem., 1999, 34, 451–465 CrossRef CAS.
- B. Van der Bruggen, in Encyclopedia of Membranes, ed. E. Drioli and L. Giorno, Springer Berlin Heidelberg, Berlin, Heidelberg, 2016, pp. 834–835, DOI:10.1007/978-3-662-44324-8_254.
- A. M. Aljeboree, A. N. Alshirifi and A. F. Alkaim, Arabian J. Chem., 2017, 10, S3381–S3393 CrossRef CAS.
Footnote |
| † Electronic supplementary information (ESI) available. See https://doi.org/10.1039/d2ra02214a |
| This journal is © The Royal Society of Chemistry 2022 |

