 Open Access Article
The co-adsorption of thymohydroquinone dimethyl ether (THQ) and coumarin present in the aqueous extract of Ayapana triplinervis on mild steel and its protection in hydrochloric acid up to 323 K: computational and physicochemical studies
Jeeja Rani AT a,
Asha Thomasa,
Mathew Kuruvillab,
Muhammed Arshada and
Abraham Joseph
 *a
*a
aDepartment of Chemistry, University of Calicut, Kerala-673 635, India. E-mail: abrahamjoseph@uoc.ac.in
bSt. Thomas College, Ranni, Pathanamthitta, Kerala, India
First published on 12th May 2022
Abstract
This study evaluates the corrosion inhibition property of the aqueous and alcoholic leaf extracts of the medicinal plant Ayapana triplinervis. The major components in the extracts are thymohydroquinone dimethyl ether (THQ) and coumarin. It is clear from the weight-loss studies that the water extract of the leaves (AYW) is superior to the alcoholic extract (AYA) in terms of offering corrosion inhibition. The 96% efficiency of 4% (v/v) AYW in 0.5 N HCl at room temperature changes to 84.62% at 323 K. The mixed-type inhibition behaviour of AYW shows slight dominance in the anodic direction. Studies suggest the multilayer adsorption of phytochemicals on the metal surface and that the adsorption follows the Temkin model. Theoretical studies using DFT and BIOVIA Materials Studio investigations establish THQ as a good inhibitor with high adsorption characteristics. Even though the concentration of coumarin in the extract is low, its presence in the extract facilitates the adsorption of THQ on the metal surface, which is evident from the MD simulation study. The changes in the surface topography and elemental composition of the metal specimen in the inhibited and uninhibited solution are monitored by SEM and EDX spectral studies. XPS data support the presence of both THQ and coumarin on the metal surface and the existence of co-ordinate bonding between the metal's d orbital and the O atoms of THQ. Theoretical and experimental studies support the mixed mode of adsorption of THQ as physisorption followed by chemisorption.
1 Introduction
Corrosion, though undesirable, is an unavoidable natural process leading to the destruction of metals and alloys. This material deterioration leads to environmental pollution to different extents including loss of resources, maintenance problems, serious damage to the entire ecosystem, and economic recession. In this context, researchers and scientists all over the world are in search of better and viable remedies to resolve these problems.1,2 The use of eco-friendly inhibitors is one of the accepted strategies for managing material dissolution in aggressive environments. In the early days, we used synthetic organic and inorganic compounds as corrosion inhibitors. However, recent environmental issues have made scientists and researchers focus on these issues before applying different chemicals as corrosion inhibitors. Hence, research in the area of corrosion inhibitors is targeted at environmentally benign, economically viable, easily available, and more effective materials in terms of efficiency over synthetic ones.3–5 Most of these requirements could be met by the usage of plant extracts as corrosion inhibitors. Extracts can be made from leaves, stems, roots, bark, fruits, peels, seeds, flowers, and from the entire plant itself. The extracts serve as efficient inhibitors as all plant parts are ‘reservoirs’ of many phytochemicals that possess several heteroatoms, aromatic rings, electron-rich groups, and heterocyclic ring systems. These phytochemicals alone or their synergistic interaction make the plant extract an effective inhibitor for different metals in different environments. These organic inhibitors mitigate the corrosion rate mainly by getting adsorbed on the metal surface through their polar functional groups and multiple bonds, while inorganic inhibitors reduce the corrosion rate by influencing the anodic or cathodic processes of corrosion.6 Vashi et al. demonstrated Bacopa monnieri leaf extract as an efficient corrosion inhibitor for Al in HCl. This inhibitor shows a maximum efficiency of 91.85% at 1.2 g L−1. EI-Housseiny et al. investigated the inhibition ability of Cannabis plant extract as a mixed-type inhibitor for Zn in 0.5 M sulphuric acid using electrochemical methods. Umoren et al. carried out a comparative study on the inhibition efficacy of ethanolic extracts of date palm leaves and seeds on carbon steel in HCl. They found that the inhibitory action of the leaf extract is superior to that of the seed extract.7 Electrochemical, theoretical and gravimetric studies on the corrosion inhibition ability of Holoptelea integrifolia leaf extract for mild steel corrosion in 1 M HCl reported that the extract shows a maximum efficiency of 93.91% at 400 mg L−1 and the mechanism involves adsorption that follows Langmuir monolayer adsorption.8Saxena et al. tested Cuscuta reflexa fruit extract as a green inhibitor for mild steel corrosion in 0.5 M H2SO4. The extract contains the active component 3-methoxy-3,4,5,7-tetrahydroxyl flavone, which is responsible for the inhibitory action, and it shows a maximum efficiency at an inhibitor concentration of 500 mg L−1.9 Fang et al. illustrated the inhibitive action of seven plant-derived aromatic compounds, by cyclic voltammetry. They found that all the seven compounds have the same electrochemical behaviour, which is attributed to their aromatic structure.10 Deyab et al. conducted a green approach to establish the corrosion inhibition properties of lemongrass extract on carbon steel in oilfield water. The extract shows maximum inhibitory action at a concentration of 400 ppm. SEM, EDX and FT-IR results confirm the presence of the extract on the carbon steel surface. Through theoretical investigations, they demonstrated that the most abundant components ‘neral’ and ‘geraniol’ have comparable adsorption tendencies on the Fe surface.11 The corrosion inhibition behaviours of citrulline, quercetin and bonducellin were studied theoretically for mild steel corrosion. Among these, quercetin shows maximum efficiency and citrulline shows the least inhibitory nature.12 Salmasifar et al. demonstrated the corrosion inhibition properties of aquatic artichoke extract molecules using both electrochemical and computer modelling methods. The electrochemical methods show a maximum efficiency of 98.7% at 1000 ppm. The artichoke extract acts as a mixed-type inhibitor and inhibits the corrosion rate via the physicochemical interaction that occurs between the adsorption film and steel surface. Bahlakeh et al. investigated the inhibitory behaviour of mustard seed extract for mild steel corrosion in HCl solution and found that it acts as a mixed-type inhibitor and shows a maximum efficiency of 94% at 200 mg L−1 of extract.13
The current study focuses on the corrosion inhibition ability of the aqueous leaf extract of the plant Ayapana triplinervis (AYW) (Eupatorium ayapana Vent, Eupatorium triplinerve Vahl), which belongs to the Asteraceae family. The leaves are a rich source of aromatics, borne directly from the stem, are shaped like a lance head, tapering to a point at each end and the stems are reddish-brown. It is a traditional plant with considerable antimicrobial, antifungal, anti-inflammatory, antioxidant, sedative and stimulant activities. Its oil is rich in thymohydroquinone dimethyl ether (THQ) and coumarins. GC/MS data report that the essential oil contains 89.9% to 92.8% THQ.14 It is assumed that the corrosion inhibition property of the leaf extract is mainly due to the presence of the most abundant phytochemical component of the leaves, i.e., THQ, which shows greater corrosion inhibition ability when subjected to theoretical calculations using Gaussian 09 and Materials Studio software analysis. This herb extract can be used as a tonic when used in a smaller dosage but serves as a laxative in larger quantities.15 It is used as an antihemorrhagic agent and to clean ulcers.16 The aqueous extract is used as a cardiac stimulant, which increases the rate of blood flow. Even bare fresh leaves are used to cure wounds and stomach pain. The main phytochemicals present in the leaves of Ayapana triplinervis include essential oils and coumarins, along with ayapanin, ayapin, stigmasterol, esculetin methylene ether, vitamin C, and carotene. The volatile fraction of this extract is rich in THQ, while the non-volatile fraction is enriched mainly with coumarins and alkaloids. A total of seven coumarins were identified in the oil, from which 7-hydroxy coumarin is responsible for its anti-inflammatory and anti-microbial activities, while the presence of THQ is responsible for inhibiting the Zika virus.14 7-Hydroxy coumarin also has anti-tumor and enzyme-inhibitory activity. The presence of THQ along with coumarin makes this extract an effective traditional medicine as well as an effective inhibitor for mild steel corrosion in acidic media.14,15,17–21
For a molecule to act as a good inhibitor, it is reported that it should have the ability to both donate electrons to the vacant d orbital of the metal and to accept back electrons from the filled metal d orbital to its empty orbital. During their interaction, the HOMO of the inhibitor acts as the electron donor to the metal, while the LUMO as the electron acceptor from the metal. Since the energy gap of the active component of AYW, THQ, is comparable with that of mild steel, it is assumed that the extract, which is enriched with THQ, can act as a good inhibitor system for mild steel corrosion in an acidic environment. The electronic properties of the THQ molecule suggest that it is the best inhibitor system for resisting mild steel corrosion.
2 Materials and methods
2.1 Preparation of the extract
Ayapana leaves were washed thoroughly under running water, shadow dried for about 28 days and then crushed into powder. AYW (aqueous) and AYA (alcoholic) extracts were prepared by refluxing 5 g of this powder with 100 mL water and ethanol at 95 °C and 65 °C, respectively, for about 3 hours. The residual solution was kept overnight and filtered to obtain the respective extracts.2.2 Test solutions
0.5 N HCl solution was formulated using 12 mol L−1 concentrated hydrochloric acid (E Merk) and double-distilled water. Then, different volumes of the AYW extract were added to the hydrochloric acid solutions to prepare the electrolytic medium for electrochemical studies.2.3 Characterization of AYW
FT-IR analysis was performed on the AYW extract as well as on the film separated from the metal surface after dipping it in an electrolytic solution containing 28 mL AYW. Infrared analysis was performed using the KBr pelletized extract and the film with a Jasco IR spectrometer in the wavenumber range of 400–4000 cm−1. UV-visible absorbance measurement of the extract was performed using a Jasco spectrometer in the wavelength region of 200–800 nm.2.4 Gravimetric studies
Gravimetric analyses were conducted for mild steel coupons under total immersion conditions at room temperature. Square metal samples of the composition Fe (98.75%), C (0.20%), Mn (1.0%), P (0.030%) and S (0.020%) with 3.6 cm2 area were used for these studies. The metal specimens were cleaned as per ASTM recommendations22 and weighed accurately before and after the immersion process. The volume of the inhibitor at which it offers maximum inhibition efficiency was found at 303 K. From the weight loss obtained, the corrosion rate in mm per year was calculated using eqn (1),
 | (1) |
2.5 Electrochemical analysis
A Gill AC model no. 1475 potentiostat was used to monitor the corrosion of the metal in corrosive media. Electrochemical impedance spectroscopy, one of the simplest, most effective and non-destructive electrochemical tools to monitor the corrosion rate of a sample, was carried out by applying a potential as a sinusoidal wave of 10 mV amplitude and the response was measured as an AC between the working electrode and auxiliary electrode. Before carrying out the electrochemical measurements, the working electrode was immersed in the electrolytic medium (with or without the inhibitor) for about one hour to attain a steady state. For that, the open circuit potential was recorded for the first three minutes (potential versus time) and it was ensured that there was not much variation in the potential value (<10 mV) with time. Electrochemical analyses such as EIS and PDP were performed only after attaining the steady-state condition. In the electrochemical impedance technique, a small potential of 10 mV was applied in a frequency range of 0.1 Hz to 10 KHz to the system and the responses were recorded and analysed by fitting the non-linear data to the equivalent Randle's circuit.The impedance of the system is measured as
 | (2) |
Since the applied potential and current response are sine waves of the same frequency with a phase angle change, their ratio is taken as the impedance, which is a complex number with a real and imaginary part, i.e.
| Z(ω) = Z1(ω) + jZ2(ω) | (3) |
The Nyquist plot was obtained by plotting the real part of impedance on the X-axis and the imaginary part on the Y-axis. The magnitude of the impedance was also obtained from the Bode plots in which phase angle variation is plotted against log(frequency). Various corrosion parameters were thus obtained by fitting the EIS data to an equivalent electrical circuit.
During the electrochemical polarization studies, the working electrode was first polarized cathodically followed by anodic polarization by applying a potential of 250 mV from the corrosion potential. The polarization of the electrode surface resulted in the flow of current due to the electrochemical reactions at the electrode surface. Corrosion current density was obtained from these plots by extrapolating both the cathodic and anodic regions of the Tafel plots to the equilibrium corrosion potential. The percentage efficiency is calculated from the corrosion current density using the equation
 | (4) |
2.6 Theoretical studies
Quantum chemical methods and molecular modelling techniques can be used for deriving the electron density functions in molecular fragments and for a molecule as a whole. The molecular structure and other electronic properties of molecules are obtained by performing theoretical calculations using the Gaussian 09 software. In these calculations, the B3LYP functional with double-zeta plus polarization and 6-311G(d,p) basis set were employed. An idea about the inhibition ability of the molecule is obtained from the various parameters calculated using the global descriptors of theoretical analysis as| IE = −EHOMO | (5) |
| EA = −ELUMO | (6) |
 | (7) |
 | (8) |
 | (9) |
MC simulation is an important theoretical approach for monitoring the interaction of an inhibitor with a metal surface. BIOVIA Materials Studio calculations were performed to get an idea about the mode of interaction between the inhibitor and the metal surface as well as to have a glimpse of the extent of interaction between them. The Fe(110) plane of iron built by the builder module of the software is selected as the adsorbent as it is the most stable plane, possessing a close-packed structure. The maximum surface interaction with larger molecules is possible only by enlarging the iron surface. For that, 10 × 10 supercells were created with a thickness of 10 Å and using the adsorption locator module, the adsorption process of the inhibitor on the metal surface was studied after geometry optimization using DMol3 calculation. The interaction parameters were then calculated utilizing the COMPASS force field.
2.7 SEM, EDX and XPS studies
Surface characterization of the metal coupons dipped in 4% (v/v) AYW taken after 24 hours was done using XPS (PH1 5000 versa probe II, ULVAC-PHI Inc; USA) equipped with a micro focussed monochromatic X-ray source with an energy of 1486.6 eV from Al-Kα. An X-ray source with a pass energy of 187.85 eV was needed to record the survey scan, while 46.95 eV pass energy was required to record the deconvoluted spectra in XPS. The SEM and EDX analyses of the mild steel coupons immersed in blank and inhibited solution after 24 hours of immersion were carried out using a scanning electron microscope (JEOL JSM 6380 LA). By comparing the topology of the surface of the sample in blank and inhibited solutions, we can find out whether the metal is protected in the presence of the inhibitor. By examining the EDX spectra, the surface composition of the samples in the presence and absence of the inhibitor can be obtained.3 Results and discussion
3.1 Spectral analysis
The FT-IR spectrum of the AYW extract was obtained in KBr pellets using a Jasco IR spectrometer using the drop-casting method in the wavenumber range of 400–4000 cm−1.The Ayapana triplinervis extract is rich in many phytochemicals including THQ and coumarins, especially 7-hydroxy coumarin in excess over others, as evident from the existence of many peaks corresponding to different functional groups. The sharp peak at 3433 cm−1 is due to the presence of the O–H group in the extract. Two intense peaks are present at 2915 cm−1 and 2864 cm−1, which can be attributed to the C–H stretching from an aliphatic group, representing the presence of methyl and isopropyl groups in the extract. The band at 1632 cm−1 represents the presence of an aromatic ring and C![[double bond, length as m-dash]](https://www.rsc.org/images/entities/char_e001.gif) O group in the extract. Another peak at 1374 cm−1 is for the CH3 bending vibration. The broad peak at 1001 cm−1 is ascribed to C–O–C stretching vibration and a weak band at 556 cm−1 is due to the C–H bending vibration.26–28 The presence of THQ was detected from the electronic spectrum with an absorption maximum of 200–360 nm with an absorption maximum of around 290 nm. AYW shows an absorption maximum at 279.01 nm, indicating the presence of THQ in the extract in the wavelength range of 200–800 nm. These spectral data are enough to show the presence of both THQ and coumarin in AYW29,30 (Fig. 1).
O group in the extract. Another peak at 1374 cm−1 is for the CH3 bending vibration. The broad peak at 1001 cm−1 is ascribed to C–O–C stretching vibration and a weak band at 556 cm−1 is due to the C–H bending vibration.26–28 The presence of THQ was detected from the electronic spectrum with an absorption maximum of 200–360 nm with an absorption maximum of around 290 nm. AYW shows an absorption maximum at 279.01 nm, indicating the presence of THQ in the extract in the wavelength range of 200–800 nm. These spectral data are enough to show the presence of both THQ and coumarin in AYW29,30 (Fig. 1).
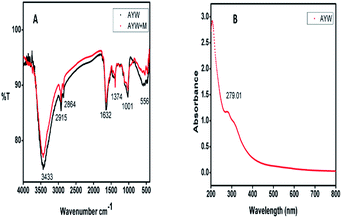 | ||
| Fig. 1 (A) IR spectra of the AYW extract and coated film obtained from the metal surface and (B) UV-visible spectra of AYW. | ||
3.2 Gravimetric analysis
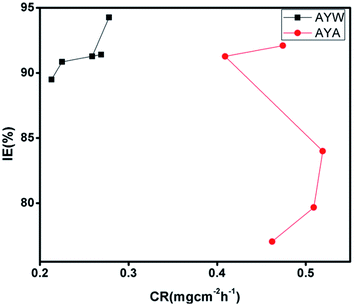
The ‘gold standard’ weight-loss technique is the simplest and most efficient corrosion monitoring technique, although its sensitivity is limited to 0.1 mg. It is particularly useful when the exposure period is extended to the order of weeks and months. Weight-loss analyses were conducted separately for the water and alcoholic extract of Ayapana triplinervis (AYW and AYA, respectively) after 24, 48, 72, 96, and 120 hours of immersion in an aggressive acidic medium. From Fig. 2, it is clear that the aqueous extract is superior in action to its alcoholic counterpart in terms of resisting the corrosion process of mild steel in 0.5 N HCl. Since the alcoholic counterpart, which is more expensive, has less inhibition efficiency than the economically benign water extract in inhibiting the mild steel corrosion in an acidic medium, it has been excluded from further electrochemical techniques. 4% (v/v) AYW exhibits about 94% efficiency even after 48 hours of immersion, and after 120 hours, the inhibition efficiency (IE) reduces to 89.50%. At the same time, the corrosion rate decreased from 0.278 mg cm−2 h−1 to 0.213 mg cm−2 h−1 for 4% (v/v) AYW on increasing the immersion time from 24 to 120 hours. However, for the alcoholic counterpart, the inhibition efficiency decreases from 92.10% to 91.27% on increasing the immersion time from 24 to 48 hours. After 120 hours of immersion, the inhibition efficiency of 4% (v/v) AYA decreases to 77.05% at room temperature. The weight-loss, CR (mg cm−2 h−1) and IE (%) of AYW and AYA are given in Fig. 2.3.3 Impedance spectroscopic studies
Randle's circuit was identified as the ideal electrochemical circuit to fit the electrochemical data obtained during the analysis. However, some depressions were observed in the Nyquist plot during the analysis. It was realized that the phenomenon of ‘frequency dispersion’ (frequency dispersion is a term describing various physical characteristics such as surface roughness, inhomogeneity, grain boundaries, and impurities) was the reason for such depressions and it was rectified by placing a constant phase element of admittance Y0 in place of the double layer capacitance, as follows:
 | (10) |
| Cdl = (Y0Rct1−n)1/n | (11) |
The nature of the constant phase element depends on the constant phase exponent. That is, the constant phase element acts as a perfect capacitor when n is unity, as a resistor when n equals zero and as an inductor when n approaches −1. The addition of inhibitor solution to the blank electrolytic solution causes a shift of the constant phase element towards a more capacitive nature, which is evidenced from the n value change (Table 1).
| T (K) | Cinh (%, v/v) | Rct (ohm cm−2) | Cdl (μF cm−2) | Icorr (mA cm−2) | CR (mm per year) | Y0 | n | IE (%) |
|---|---|---|---|---|---|---|---|---|
| 303 | 0 | 21.40 | 0.00053 | 1.2190 | 14.13 | 0.0014 | 0.77 | — |
| 1 | 30.11 | 0.00034 | 0.8664 | 10.04 | 0.0008 | 0.80 | 28.93 | |
| 2 | 85.63 | 0.00020 | 0.3046 | 3.531 | 0.0005 | 0.82 | 75.01 | |
| 3 | 298.9 | 0.00006 | 0.0873 | 1.012 | 0.0001 | 0.83 | 92.84 | |
| 4 | 539.0 | 0.00007 | 0.0484 | 0.561 | 0.0002 | 0.79 | 96.03 | |
| 313 | 0 | 12.05 | 0.00055 | 2.1650 | 25.09 | 0.0024 | 0.76 | — |
| 1 | 14.12 | 0.00046 | 1.8480 | 21.41 | 0.0013 | 0.83 | 14.66 | |
| 2 | 40.35 | 0.00028 | 0.6465 | 7.493 | 0.0010 | 0.79 | 70.14 | |
| 3 | 65.06 | 0.00019 | 0.4010 | 4.647 | 0.0006 | 0.81 | 81.48 | |
| 4 | 84.38 | 0.00020 | 0.3092 | 3.583 | 0.0004 | 0.87 | 85.72 | |
| 323 | 0 | 8.352 | 0.00096 | 3.1230 | 36.20 | 0.0037 | 0.77 | — |
| 1 | 9.746 | 0.00119 | 2.6770 | 31.02 | 0.0048 | 0.75 | 14.30 | |
| 2 | 19.90 | 0.00041 | 1.3110 | 15.19 | 0.0015 | 0.79 | 58.03 | |
| 3 | 27.19 | 0.00038 | 0.9594 | 11.12 | 0.0017 | 0.76 | 69.28 | |
| 4 | 54.31 | 0.00020 | 0.4803 | 5.567 | 0.0006 | 0.81 | 84.62 |
The Nyquist plot obtained for mild steel coupons in 0.5 N HCl without and with various concentrations of AYW at different temperatures is shown in Fig. 3. It is clear from the figure that even after adding 4% (v/v) AYW to the electrolytic medium, the shape of the curve remains the same, which is an indication of the constancy in the corrosion mechanism in the presence or absence of an inhibitor. In the higher frequency region, the Nyquist plot shows a capacitive loop due to the presence of an electric double layer at the metal-solution interface. On analysing Table 1, it is seen that there is an opposite trend in the values of Rct and Cdl during the addition of the inhibitor. This may be due to the formation of a protective layer of phytochemicals on the metal surface. The inhibitor molecules adsorb on the metal surface by replacing the water molecules and other ions that had adsorbed there previously, causing an increase in the thickness of the double layer at the metal-solution interface. This event results in the decrease of the double-layer capacitance value according to the Helmholtz equation:
 | (12) |
 | (13) |
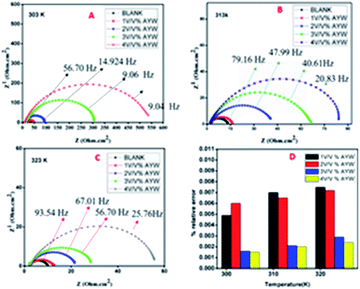 | ||
| Fig. 3 Nyquist plot for mild steel corrosion in 0.5 N HCl with and without inhibitors at (A) 303 K, (B) 313 K, and (C) 323 K; and (D) % relative error for the extracts at different temperatures. | ||
3.4 Bode plots
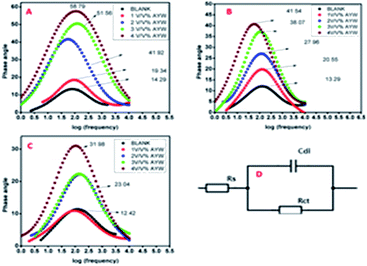
Bode plots of metals in an acidic solution containing AYW at different temperatures are shown in Fig. 4. Since the electrode–electrolyte interface acts as a ‘leaky’ capacitor, there is a deviation in phase angle from the perfect capacitance value of 90°. When there are smaller deviations from 90°, the capacitive response is high and hence the inhibition efficiency is also high. This deviation is more pronounced for an uninhibited solution, especially at a higher temperature. With the increase in the concentration of the extract, the extent of adsorption of phytochemicals on the metal surface increases, and the increased surface coverage on the metal surface leads to the broadening of the Bode plots (i.e., at higher concentration). It is clear from Fig. 4 that the deviation from the perfect capacitive angle is minimum for 4% (v/v) AYW at room temperature (58.790) and maximum for the blank electrolyte at 323 K (12.420).27,363.5 Tafel polarization studies
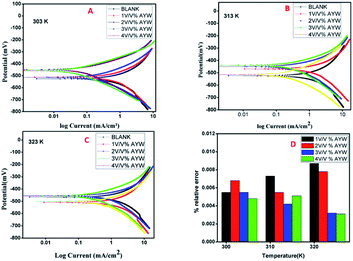
The general principle behind Tafel polarization studies involves the excitation of the working electrode electrochemically by the application of a potential sweep of ±250 mV to Ecorr and then measuring the current response in terms of potential or time domain. In linear polarization, a linear relationship exists between the applied potential and the current response as we are perturbing the system by a small potential of 20–25 mV. However, in Tafel polarization, the linearity is seen between the potential and log current density at a potential of 50–70 mV far from OCP. Anodic and cathodic polarizations create Tafel regions and the extrapolation of the linear portions of these curves to a single point will give the potential and the corresponding current density, which are called the corrosion potential and corrosion current, respectively. Once we obtain the corrosion current, the inhibition efficiency can be calculated by eqn (4).Anodic and cathodic polarization studies were conducted for mild steel coupons immersed in 0.5 N HCl in the presence and absence of different concentrations of AYW at three different temperatures (Fig. 5). The corrosion parameters thus obtained, such as corrosion current density, corrosion potential, and Tafel slopes, are given in Table 3. It is clear from Table 2 and Fig. 5 that the incremental addition of inhibitors to the blank electrolytic media considerably decreases the corrosion rate of the metal. Corrosion inhibitors retard the corrosion rates of mild steel by acting either as anodic or cathodic inhibitors. It is seen that on adding different volumes of the extract to the electrolytic medium, the current density (both anodic and cathodic) decreases. It is also observed here that with the incremental addition of the extract, the corrosion potential value shifts towards lower negative values at all temperatures, indicating an anodic predominant mechanism for the inhibitor. That is, the inhibitor system decreases the corrosion rate of mild steel mainly by resisting the anodic dissolution process of mild steel. Since the shift in Ecorr values remains within ±85 mV, mixed inhibition nature is attributed to the inhibitor system. That is, it resists the corrosion process not only by retarding the anodic reaction but also by preventing the cathodic hydrogen evolution reaction. An irregular trend in the Tafel slopes is observed, which again supports the mixed inhibition behaviour of AYW. The corrosion current density of the sample decreases from 1.1791 mA cm−2 to 0.0497 mA cm−2 with the addition of only 4% (v/v) AYW to the reaction medium, showing its high inhibition ability (95.78%) at room temperature. At the same time, the corrosion rate decreases from 19.371 to 4.3649 mm per year for the sample at room temperature. With further increase of temperature to 313 K, no considerable increase in the corrosion current and corrosion rate is observed in the presence of 4% (v/v) AYW, giving a high efficiency of 81.36% at 313 K. AYW decreases the corrosion rate by getting adsorbed on the available active sites of the sample, leading to lesser interaction with the acidic electrolyte. However, on increasing the temperature, the rate of desorption of the adsorbate layer from the surface increases, exposing more active sites to the aggressive environment. Moreover, with increase in temperature, the rate of evaporation and degradation of the active organic components of AYW on the metal surface may also increase, leading to greater corrosion.37–41
| T (K) | Concentration of AYW (%, v/v) | −Ecorr (mV) | βa | −βc | Icorr (mA cm−2) | CR (mm per year) | IE (%) |
|---|---|---|---|---|---|---|---|
| 303 | 0 | 524.62 | 238.81 | 338.54 | 1.1791 | 19.371 | — |
| 1 | 513.41 | 183.37 | 243.79 | 0.7604 | 14.426 | 35.51 | |
| 2 | 514.33 | 135.63 | 157.92 | 0.2688 | 7.6903 | 77.20 | |
| 3 | 451.56 | 89.176 | 147.96 | 0.0868 | 4.5079 | 92.64 | |
| 4 | 458.8 | 86.835 | 132.59 | 0.0497 | 4.3649 | 95.78 | |
| 313 | 0 | 523.09 | 262.71 | 302.82 | 1.7238 | 28.152 | — |
| 1 | 468.38 | 166.15 | 247.68 | 1.5029 | 26.45 | 12.81 | |
| 2 | 450.79 | 120.4 | 202.12 | 0.5683 | 13.553 | 67.03 | |
| 3 | 438.75 | 103.96 | 189.49 | 0.3332 | 10.417 | 80.67 | |
| 4 | 514.33 | 129.36 | 150.4 | 0.2418 | 7.330 | 85.97 | |
| 323 | 0 | 463.89 | 226.16 | 297.64 | 1.9815 | 33.534 | — |
| 1 | 508.83 | 237.22 | 231.83 | 1.7672 | 27.802 | 10.82 | |
| 2 | 455.95 | 129.58 | 223.65 | 1.0129 | 21.234 | 48.88 | |
| 3 | 500.87 | 123.48 | 204.7 | 0.7410 | 16.091 | 62.60 | |
| 4 | 456.8 | 113.02 | 184.71 | 0.3693 | 11.725 | 81.36 |
3.6 Quantum chemical calculations
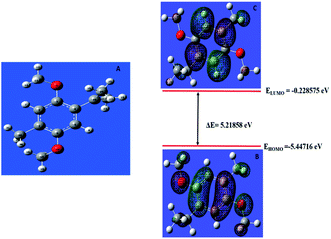
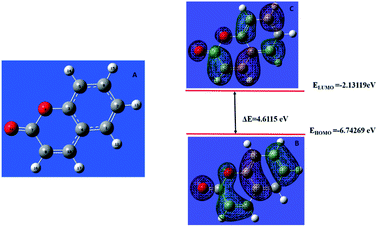
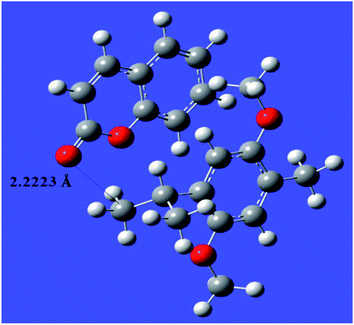
The donor–acceptor mechanism is responsible for the adsorption of an inhibitor molecule on a metal surface, i.e., electron-rich sites of the inhibitor donate electrons to the metal surface. The excess electrons in the metal surface will create repulsive interaction and hence these electrons are donated back from the metal surface to the electron-deficient/vacant antibonding orbitals of the inhibitor molecule. The electron-rich centres include the heteroatoms and aromatic rings present in the inhibitor molecule. The HOMO and LUMO of the inhibitor molecule respectively afford the electron-donating and electron-accepting centres.The quantum chemical parameters obtained from the most stable configuration of the active component THQ obtained by Gaussian 09 are listed in Table 3. It is clear from the table that the molecular parameters of THQ are responsible for the extract's performance as a good corrosion-inhibitive system. From Fig. 6, it is evident that the HOMO of THQ is located mainly on O atoms and the aromatic rings, while the LUMO is distributed over the C atoms. These centres of the HOMO and LUMO are involved in interaction with the Fe surface to cause the adsorption of the inhibitor molecule on the metal surface. The high energy of the HOMO of THQ (−5.44716 eV) accounts for its capacity to donate electrons to the vacant d orbital of Fe. At the same time, the low energy of the LUMO (−0.228575 eV) validates its tendency to accept the electrons from the filled metal d orbital to its empty p orbital. Hence, the energy required to remove the electrons from the outermost orbital is very low (obtained from its energy gap), which accounts for its high inhibition ability. The inhibitor molecule considerably retards the corrosion process of iron by transferring a larger fraction of electrons from it to the metal surface. The inhibition ability has a direct relationship with this fraction transferred according to Lukovit's theory. The inhibitor has a great ability to bind with the soft Fe surface (in acid media), which is evidenced by its low hardness value, and which eventually leads to the adsorption phenomena according to Pearson's HSAB theory. The lower dipole moment value of the inhibitor facilitates its accumulation on the metal surface, leading to better inhibition ability. The second active component present in AYW is coumarin, which is also a good inhibitor as evidenced by its electronic molecular structure obtained through DFT calculations (Fig. 7). The presence of THQ alone or its synergistic interaction with the other minor components, mainly coumarins, makes the extract a more efficient corrosion inhibitor for mild steel corrosion. The active components THQ and coumarin present in AYW are separated by a distance of 2.22235 Å on the metal surface after adsorption12,27,28,34,41–45 (Fig. 8).
| Parameters | THQ | Coumarin |
|---|---|---|
| Total energy (a.u.) | −618.72177 | −497.1482 |
| EHOMO (eV) | −5.44716 | −6.74269 |
| ELUMO (eV) | −0.228575 | −2.13119 |
| ΔE (eV) | 5.21858 | 4.6115 |
| IE (eV) | 5.44716 | 6.74269 |
| EA (eV) | 0.22857 | 2.13119 |
| Dipole moment (D) | 0.23490 | 4.7775 |
| χ | 2.83786 | 4.43694 |
| η | 2.60929 | 2.30575 |
| ΔN | 0.79756 | 0.55579 |
3.7 MD simulations
MD simulations were carried out separately for THQ, coumarin, and THQ and coumarin together (THQ + CU) on the Fe(110) plane in a homogeneous environment using the BIOVIA Materials Studio package to gather information on the most favourable interaction. The result obtained is presented in Table 4.| Molecule | Total energy (eV) | Adsorption energy (eV) | Rigid adsorption energy (eV) | Deformation energy (eV) | dE/dNi |
|---|---|---|---|---|---|
| THQ | −83.6693 | −94.6419 | −95.7429 | 1.10106 | −94.6419 |
| Coumarin | −94.4323 | −77.1024 | −65.6780 | −11.4244 | −77.1024 |
| THQ + coumarin | −182.5147 | −172.1930 | −158.6195 | −13.5735 | −172.1930 |
From the table, it is clear that the combination (THQ + CU) has maximum adsorption on the metal surface, followed by THQ, and lastly coumarin. Although coumarin is found to be quite suitable for inhibition according to the DFT studies, THQ acts as the main contributor of AYW's corrosion inhibition because of the lower concentration of coumarin in AYW. The binding energy values are also higher for the combination (THQ + CU) than for THQ and hence it is confirmed that the adsorption process of THQ is supplemented and enhanced by coumarin. The total energy value of THQ obtained from DFT calculations is found to be 10.9725 kcal mol−1. However, when it gets adsorbed on the metal surface, the total energy of the system becomes negative (−83.6693 kcal mol−1), which means that THQ is highly stabilised on the metal surface compared to its free state of existence in AYW. Rigid adsorption energy (a type of binding energy, i.e., the energy released when molecules are adsorbed on the metal surface before its optimisation procedure) is also maximum for the combination, indicating that these clusters of molecules are preferred more on the surface than their individual existence. The 3D atomistic dE/dNi is also a representation of the energy of the adsorbate–adsorbent system. The negative value of energy indicates that the adsorption characteristics of the adsorbate are prominent in a given adsorbent. It is evident from Fig. 9 that the adsorption and surface coverage of AYW are maximum on the mild steel surface when the coumarin is arranged in parallel and THQ in a vertical orientation. All the data obtained after MD simulations show that even though the concentration of coumarin is small in AYW compared to THQ, its combination with THQ makes it an excellent combination to offer corrosion protection to mild steel in 0.5 N HCl.46–50
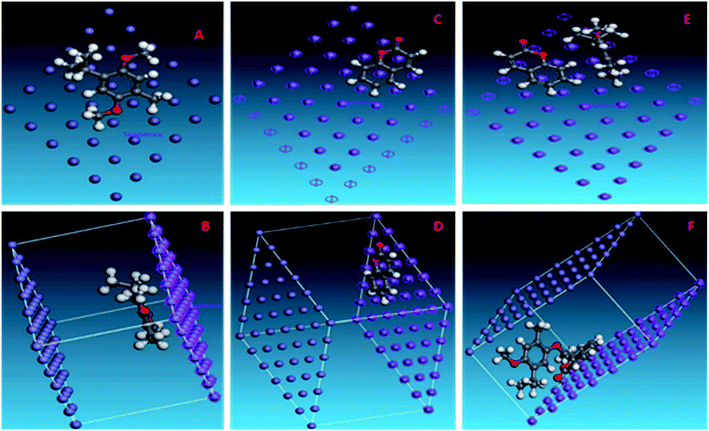 | ||
| Fig. 9 Snapshots showing the adsorption of (A), (B) THQ; (C), (D) coumarin; and (E), (F) both THQ and coumarin of AYW on the mild steel surface using the BIOVIA Materials Studio software. | ||
3.8 Adsorption isotherm
The phenomenon of adsorption is considered an effective contributor that retards the corrosion rate of metals in acidic electrolytic media containing organic inhibitor molecules. The physicochemical aspects of such a reaction at a specified temperature can be well illustrated using the thermodynamic adsorption parameters. To evaluate these, various adsorption isotherms like Langmuir, Temkin, and Freundlich are plotted separately for the corrosion process of mild steel in HCl medium containing different concentrations (%, v/v) of AYW. Insight regarding the ease of a process can be drawn by analysing the thermodynamic parameters. The magnitude and sign of both the heat and entropy of adsorption also influence the spontaneity of a reaction.51 The best fitted isotherm is selected using its R2 values for different adsorption isotherms, and in this case, among the three isotherms, Temkin is found to be the best one with a regression constant close to unity, and obeys the equation
θ = ln![[thin space (1/6-em)]](https://www.rsc.org/images/entities/char_2009.gif) CR + Kads CR + Kads
| (14) |
Table 5 shows the thermodynamic adsorption parameters derived at various temperatures. It is seen that the Kads values are positive, showing the feasibility of adsorbing the constituents of AYW on the mild steel surface. It is also seen that with an increase in temperature, the equilibrium is shifted to the adsorption side rather than the desorption side. Table 5 also presents the variation in Gibbs free energy with temperature and in this case, the values are negative and point to the ease of the expected adsorption reaction. Here the values are below 20 kJ mol−1, and hence it may be concluded that the adsorption of active phytochemicals present in AYW on the mild steel surface is a feasible process that follows physisorption, not by a mere physical force but through a substantial contribution from a type of co-ordinate interaction between the metal and active components of AYW. This is because Fe has a great tendency to form co-ordinate bonds with heteroatoms like O and N. Since AYW is rich in these atoms, co-ordinate interactions are very well possible between Fe and AYW, which are sufficiently strong and hence stable even at reasonably high temperatures.52,53 Since the adsorption isotherm obtained is of the Temkin-type, it suggests the multilayer adsorption of phytochemicals on the metal surface. The first layer of phytochemicals is formed on the metal surface by mild physisorption followed by the formation of the second layer through strong co-ordinate covalent bond-mediated chemical adsorption (Fig. 10).54
| Acid concentration | Temp. (K) | R2 | Kads (M−1) | ΔG0ads (kJ mol−1) | ||
|---|---|---|---|---|---|---|
| Langmuir | Temkin | Freundlich | ||||
| 0.5 N HCl | 303 | 0.51769 | 0.93037 | 0.85951 | 3.00444 | −12.89144 |
| 313 | −0.12913 | 0.87280 | 0.77919 | 4.66962 | −14.46468 | |
| 323 | −0.09546 | 0.96843 | 0.86615 | 5.86200 | −15.53762 | |
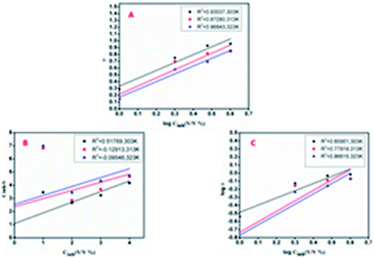 | ||
| Fig. 10 Temkin, Langmuir and Freundlich adsorption isotherms for the mild steel specimen immersed in 0.5 N HCl solution containing AYW at different temperatures. | ||
3.9 Kinetic studies
Arrhenius and transition state plots were drawn to obtain kinetic information about the corrosion process involving mild steel and 0.5 N HCl in the presence of AYW (Fig. 11). The perfect fit for the data implies the reliability of the results. From the slopes of the plot, the activation energy values were calculated for the blank and inhibited solutions. The activation energy is higher for the inhibited solutions and the value increases with increasing inhibitor concentration. In an inhibited solution with a greater extract concentration, the metal has to overcome higher energy barriers to get corroded in acidic solution, while in the uninhibited solution, the metal has to face a smaller energy barrier to get corroded. Hence, the metal suffers greater corrosion in both blank and inhibited solutions with lower AYW concentrations due to the lower activation energy barrier. It is therefore seen that the higher activation energy value obtained in the presence of the optimum concentration of the inhibitor is an indication of the decrease in the corrosion rate. The thin coating of phytochemicals formed through the adsorptive interaction prevents the transfer of both matter and energy, eventually leading to corrosion retardation. The variation in the values of enthalpy and entropy with temperature is included in Table 6. The enthalpy values are positive and increase with increasing inhibitor concentration. The result confirms the endothermic nature of the dissolution process. The entropy values for the blank solution are negative, but for 4% (v/v) AYW, the values are highly positive, suggesting the formation of an activated complex during the corrosion inhibition process, and the disorder goes on increasing when the reactants get transformed to products.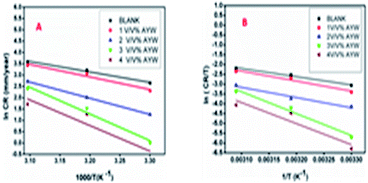 | ||
| Fig. 11 Arrhenius and transition state plots for mild steel corrosion in the blank and inhibited solutions containing different concentrations of AYW at different temperatures. | ||
| Acid concentration | Inhibitor concentration (%, v/v) | Arrhenius plot (ln(CR) vs. 1000/T) | Transition state plot (ln(CR/T) vs. 1/T) | |||
|---|---|---|---|---|---|---|
| Ea (kJ mol−1) | ΔS0a (kJ mol−1) | ΔH0a (kJ mol−1) | Ea − ΔH0a (kJ mol−1) | |||
| AYW | 0.5 N HCl | 0 | 38.3405 | −107.8990 | 34.8203 | 3.5202 |
| 1 | 46.0388 | −85.7058 | 42.3384 | 3.7004 | ||
| 2 | 59.3484 | −52.3583 | 55.2190 | 4.1294 | ||
| 3 | 97.7415 | 61.6779 | 92.6995 | 5.0420 | ||
| 4 | 93.9357 | 46.0842 | 89.1545 | 4.7812 | ||
Activation energy is more important in kinetic studies and its difference from the enthalpy of the corrosion process is constant, suggesting the unimolecular nature of the metal dissolution process (Fig. 12).52,55
3.10 Surface analysis
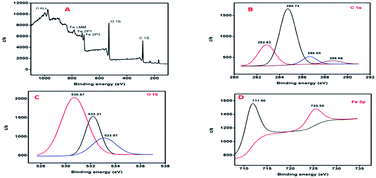
On analysing the deconvoluted spectra of C 1s, four peaks are observed giving different profiles for the carbon on the metal surface.
The peak with a binding energy of 284.74 eV is attributed to C–C and C–H bonds. The second peak at 286.65 eV refers to the ethereal oxygen, i.e., C–O–C groups in THQ and coumarin. The 282.83 eV peak is responsible for the unsaturated C![[double bond, length as m-dash]](https://www.rsc.org/images/entities/char_e001.gif) C bond and the fourth peak at 288.66 eV is responsible for the carbonyl group (C
C bond and the fourth peak at 288.66 eV is responsible for the carbonyl group (C![[double bond, length as m-dash]](https://www.rsc.org/images/entities/char_e001.gif) O of coumarin).57 The O 1s spectrum with three deconvolutions at 530.67 eV, 532.21 eV and 533.07 eV shows that O is observed in three different bonding environments. The one with a binding energy of 530.67 eV attributes to Fe–O bonding strategies.
O of coumarin).57 The O 1s spectrum with three deconvolutions at 530.67 eV, 532.21 eV and 533.07 eV shows that O is observed in three different bonding environments. The one with a binding energy of 530.67 eV attributes to Fe–O bonding strategies.
Here, Fe–O bonding may have resulted from the co-ordinate type of interaction between the lone pair of O and the vacant d orbital of the metal.27 The second peak at 532.21 eV is ascribed to the presence of carbonyl oxygen. Hence, this peak represents the C![[double bond, length as m-dash]](https://www.rsc.org/images/entities/char_e001.gif) O bonding of the coumarins of AYW. The third one with a binding energy of 533.07 eV corresponds to the oxygen of the ethereal groups, i.e., the C–O–C of both THQ and coumarins.
O bonding of the coumarins of AYW. The third one with a binding energy of 533.07 eV corresponds to the oxygen of the ethereal groups, i.e., the C–O–C of both THQ and coumarins.
The Fe 2p spectrum also has two major peaks at 711.90 eV (Fe 2p3/2) and 725.55 eV (Fe 2p1/2). The first peak represents the Fe–O bond as it has been already confirmed from the O 1s deconvolution. The Fe–O bond arises mainly due to the existence of co-ordinate bonding between Fe (metal surface) and the O atoms of inhibitor molecules. The second peak at 725.55 eV was contributed by the Fe 2p1/2 of the iron oxides. The various oxide species that could be identified on the surface include Fe2O3, Fe3O4 and FeO.36,46 Hence, it can be concluded that the major constituents of AYW (THQ and coumarin) are adsorbed on the metal specimen after 24 hours of immersion in 0.5 N HCl containing 4% (v/v) AYW. There is also evidence for the formation of co-ordinate bonding between the metal's d orbital and the oxygen atoms of THQ. Although the concentration of coumarin is low in AYW when compared with that of THQ, it is also adsorbed with THQ on the metal surface through synergistic interaction to offer extra protection to the metal against acid attack.37,58
3.11 Mechanism of inhibition
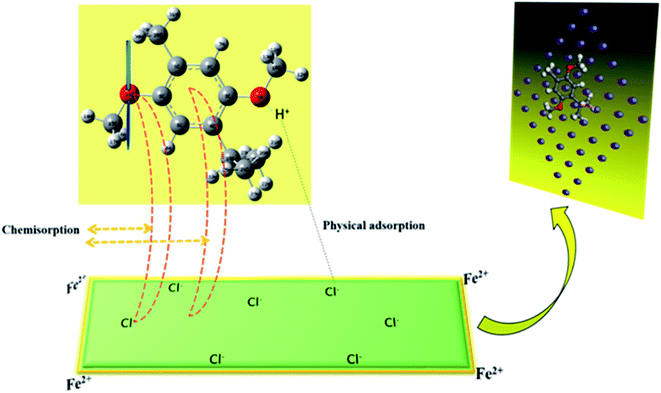
The inhibitive action of AYW can be ascribed primarily to the adsorption of THQ from AYW on the metal-electrolyte interface by the replacement of pre-adsorbed water molecules (evidenced from the reduction in Cdl value shown in Table 2). In acidic electrolytic media, THQ undergoes protonation to form the THQ-H+ entity (protonation occurs mainly at the more electronegative center). The Fe surface also undergoes oxidation in 0.5 N HCl to form Fe2+ ions. Through the characteristic adsorption phenomena, the Cl− ions from HCl get attached to the Fe2+ surface. Through the coulombic force of attraction, the protonated THQ is attracted to the negatively charged chloride ions on the metal surface, causing the adsorption of THQ-H+ on the metal surface. The increased surface coverage of THQ on the metal surface causes the desorption of other ions (corrosion enhancers) adsorbed previously on the metal surface. Meanwhile, THQ-H+ accepts the free electrons generated during the oxidation process of iron from the metal surface. Simultaneously, the aromatic ring and the electron-rich oxygen atoms of THQ donate its π and lone pair of electrons to the empty d orbital of Fe, forming a co-ordinate type bond with the metal surface. The bonding and the back bonding of the THQ molecule by the donation and acceptance of electrons with the metal surface lead to better adsorption of it on the metal surface, enhancing the corrosion resistance of mild steel in HCl media (Fig. 15).59–614 Conclusions
(1) AYW is a more efficient corrosion inhibitor for mild steel in 0.5 N HCl than its alcoholic counterpart. The 4% (v/v) AYW extract has an efficiency of 96% at 303 K and with an increase in temperature, the inhibition efficiency goes on decreasing and reaches a value of 84.62% at 323 K.(2) The decrease in inhibition efficiency with increasing temperature suggests that the predominant mechanism of adsorption is physisorption.
(3) The activation energy values support the formation of a co-ordinate-type complex between the Fe surface and THQ and coumarin.
(4) Adsorption studies point out that multilayer adsorption of phytochemicals occurs on the metal surface during the exposure and the adsorption isotherm follows the Temkin model.
(5) PDP studies suggest the mixed-type behaviour of AYW since both the anodic and cathodic slopes vary with a more prominent shift towards lower potential values on adding the inhibitor solution, indicating anodic predominance rather than the cathodic hydrogen evolution process.
(6) The adsorption and inhibitive action of THQ is evident from the theoretical calculation of global descriptors using DFT and the BIOVIA Materials Studio software. These calculations support the observation that the coumarin in AYW, though low in concentration, facilitates the adsorption of THQ on the metal surface. THQ and coumarin present in AYW sit at a distance of 2.2223 Å on the metal surface after adsorption. The combination of THQ and coumarin affords maximum efficiency since it allows for maximum surface coverage due to the vertical orientation of THQ and the horizontal arrangement of coumarin.
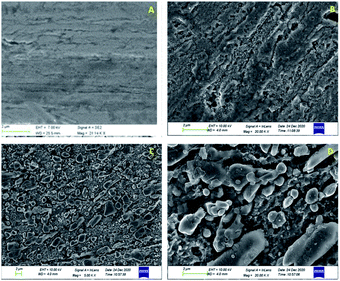
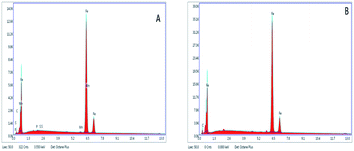
(7) SEM and EDX analyses assure that corrosion of the mild steel surface is greatly prevented in 0.5 N HCl in the presence of AYW. The surface topography as well as the elemental composition of the surface almost match those of the uncorroded metal specimen.
(8) XPS data affirm the presence of both THQ and coumarin on the surface of the metal sample. XPS spectral analysis also supports the formation of co-ordinate-type bonding between the metal's d orbital and the oxygen atoms of THQ.
(9) Both theoretical and activation energy value calculations agree with the assumption that the adsorption of THQ on the metal surface is initiated through physisorption and is completed through chemisorption.
Author contributions
Conceptualization and experimental studies were carried out by Jeeja Rani AT, and software support and data interpretation were performed by Asha Thomas, Mathew Kuruvilla, Muhammed Arshad and Abraham Joseph. The manuscript was prepared by Jeeja Rani and the same was edited by Abraham Joseph.Conflicts of interest
There are no conflicts to declare.Acknowledgements
Jeeja Rani AT acknowledges the support and help received from the authorities of Malabar Christian College, Calicut, Affiliated to University of Calicut, and the CSIF, University of Calicut, and FIST facility department of chemistry and KSCSTE facility at the Centre for Corrosion Studies (CCS) of the Department of Chemistry, University of Calicut.References
- K. Tamalmani and H. Husin, Appl. Sci., 2020, 10, 3389 CrossRef CAS.
- V. Izionworu, C. Ukpaka and E. Oguzie, Chem. Int., 2020, 6, 232–259 CAS.
- N. Chaubey, A. Qurashi, D. S. Chauhan and M. Quraishi, J. Mol. Liq., 2020, 114385 Search PubMed.
- A. Kadhim, A. Al-Amiery, R. Alazawi, M. Al-Ghezi and R. Abass, Int. J. Corros. Scale Inhib., 2021, 10, 54–67 CAS.
- S. H. Alrefaee, K. Y. Rhee, C. Verma, M. Quraishi and E. E. Ebenso, J. Mol. Liq., 2020, 114666 Search PubMed.
- A. Miralrio and A. Espinoza Vázquez, Processes, 2020, 8, 942 CrossRef CAS.
- S. A. Umoren, M. M. Solomon, I. B. Obot and R. K. Suleiman, J. Adhes. Sci. Technol., 2018, 32, 1934–1951 CrossRef CAS.
- C. Verma, M. Quraishi, E. E. Ebenso and I. Bahadur, J. Bio- Tribo-Corros., 2018, 4, 1–12 CrossRef.
- A. Saxena, D. Prasad and R. Haldhar, Bioelectrochemistry, 2018, 124, 156–164 CrossRef CAS PubMed.
- Y. Fang, B. Suganthan and R. P. Ramasamy, J. Electroanal. Chem., 2019, 840, 74–83 CrossRef CAS.
- M. Deyab, M. Osman, A. Elkholy and F. E.-T. Heakal, RSC Adv., 2017, 7, 45241–45251 RSC.
- K. O. Sulaiman, A. T. Onawole, O. Faye and D. T. Shuaib, J. Mol. Liq., 2019, 279, 342–350 CrossRef CAS.
- G. Bahlakeh, A. Dehghani, B. Ramezanzadeh and M. Ramezanzadeh, J. Mol. Liq., 2019, 293, 111559 CrossRef CAS.
- A. Gauvin-Bialecki and C. Marodon, Biochem. Syst. Ecol., 2008, 36, 853–858 CrossRef CAS.
- L. Jelager, A. Gurib-Fakim and A. Adsersen, Pharm. Biol., 1998, 36, 153–161 CrossRef.
- S. R. Sari, B. Elya and K. Basah, Int. J. Appl. Pharm., 2020, 12, 122–125 CrossRef CAS.
- S. R. Sari, B. Elya and K. Basah, Int. J. Appl. Pharm., 2020, 122–125 CrossRef CAS.
- A. M. Kouyaté, P. Van Damme, S. Goyens, S. De Neve and G. Hofman, Tropicultura, 2007, 25, 65–69 Search PubMed.
- B. Elya and A. Noviani, Int. J. Appl. Pharm., 2020, 107–111 Search PubMed.
- J. G. Haddad, M. Picard, S. Bénard, C. Desvignes, P. Desprès, N. Diotel and C. El Kalamouni, Molecules, 2019, 24, 3447 CrossRef CAS PubMed.
- S. Facknath and B. Lalljee, Tropicultura, 2008, 26, 119–124 Search PubMed.
- A. Lasia, in Modern Aspects of Electrochemistry, Springer, 2002, pp. 143–248. Search PubMed.
- A. Lasia, in Modern aspects of electrochemistry, Springer, 2002, pp. 143–248 Search PubMed.
- S. Papavinasam, in Techniques for Corrosion Monitoring, Elsevier, 2021, pp. 45–77. Search PubMed.
- J. Macdonald, Impedance Spectroscopy, John Wiley & Sons Inc., New York, NY, USA, 1987 Search PubMed.
- S. J. Mohammed, H. H. Amin, S. B. Aziz, A. M. Sha, S. Hassan, J. M. Abdul Aziz and H. S. Rahman, Evidence-Based Complementary and Alternative Medicine, 2019 Search PubMed.
- A. J. Rani, A. Thomas and A. Joseph, J. Mol. Liq., 2021, 334, 116515 CrossRef.
- A. Thomas, M. Prajila, K. Shainy and A. Joseph, J. Mol. Liq., 2020, 312, 113369 CrossRef CAS.
- J. Taborsky, M. Kunt, P. Kloucek, J. Lachman, V. Zeleny and L. Kokoska, Cent. Eur. J. Chem., 2012, 10, 1899–1906 CAS.
- A. A. Laskar, M. A. Khan, F. Askari and H. Younus, Int. J. Biol. Macromol., 2017, 103, 99–110 CrossRef CAS PubMed.
- X.-Z. R. Yuan, C. Song, H. Wang and J. Zhang, Electrochemical impedance spectroscopy in PEM fuel cells: fundamentals and applications, Springer Science & Business Media, 2009 Search PubMed.
- R. Solmaz, M. Mert, G. Kardaş, B. Yazici and M. Erbil, Acta Phys.-Chim. Sin., 2008, 24, 1185–1191 CrossRef CAS.
- R. Solmaz, M. Mert, G. Kardaş, B. Yazici and M. Erbil, Acta Phys.-Chim. Sin., 2008, 24, 1185–1191 CrossRef CAS.
- A. Thomas, P. R. Ammal and A. Joseph, Chem. Pap., 2020, 74, 3025–3037 CrossRef CAS.
- K. K. Anupama, K. Ramya and A. Joseph, Measurement, 2017, 95, 297–305 CrossRef.
- A. Berrissoul, A. Ouarhach, F. Benhiba, A. Romane, A. Zarrouk, A. Guenbour, B. Dikici and A. Dafali, J. Mol. Liq., 2020, 313, 113493 CrossRef CAS.
- A. Berrissoul, A. Ouarhach, F. Benhiba, A. Romane, A. Zarrouk, A. Guenbour, B. Dikici and A. Dafali, J. Mol. Liq., 2020, 313, 113493 CrossRef CAS.
- B. Tan, J. He, S. Zhang, C. Xu, S. Chen, H. Liu and W. Li, J. Colloid Interface Sci., 2021, 585, 287–301 CrossRef CAS PubMed.
- M. Mehdipour, B. Ramezanzadeh and S. Y. Arman, J. Ind. Eng. Chem., 2015, 21, 318–327 CrossRef CAS.
- K. K. Anupama, K. Ramya and A. Joseph, J. Mol. Liq., 2016, 216, 146–155 CrossRef CAS.
- K. Anupama, K. Ramya, K. Shainy and A. Joseph, Mater. Chem. Phys., 2015, 167, 28–41 CrossRef CAS.
- K. Anupama, K. Ramya and A. Joseph, Measurement, 2017, 95, 297–305 CrossRef.
- K. Anupama, K. Shainy and A. Joseph, J. Bio- Tribo-Corros., 2016, 2, 2 CrossRef.
- N. Asadi, M. Ramezanzadeh, G. Bahlakeh and B. Ramezanzadeh, J. Taiwan Inst. Chem. Eng., 2019, 95, 252–272 CrossRef CAS.
- K. Anupama, K. Ramya and A. Joseph, J. Mol. Liq., 2016, 216, 146–155 CrossRef CAS.
- K. Shamsheera, A. R. Prasad, P. Jaseela and A. Joseph, J. Mol. Liq., 2021, 331, 115807 CrossRef CAS.
- K. Shamsheera, R. P. Anupama and J. Abraham, J. Taiwan Inst. Chem. Eng., 2020, 2, 100054 CAS.
- S. Kaya, B. Tüzün, C. Kaya and I. B. Obot, J. Taiwan Inst. Chem. Eng., 2016, 58, 528–535 CrossRef CAS.
- G. Bahlakeh, M. Ramezanzadeh and B. Ramezanzadeh, J. Mol. Liq., 2017, 248, 854–870 CrossRef CAS.
- E. Alibakhshi, M. Ramezanzadeh, G. Bahlakeh, B. Ramezanzadeh, M. Mahdavian and M. Motamedi, J. Mol. Liq., 2018, 255, 185–198 CrossRef CAS.
- A. S. A. Khan, Turk. J. Chem., 2012, 36, 437–443 CAS.
- O. A. Akinbulumo, O. J. Odejobi and E. L. Odekanle, Results Mater., 2020, 5, 100074 CrossRef.
- K. C. Emregül and O. Atakol, Mater. Chem. Phys., 2003, 82, 188–193 CrossRef.
- K. C. Emregül and O. Atakol, Mater. Chem. Phys., 2003, 82, 188–193 CrossRef.
- P. R. Ammal, M. Prajila and A. Joseph, Egypt. J. Pet., 2018, 27, 823–833 CrossRef.
- A. A. Fadhil, A. A. Khadom, S. K. Ahmed, H. Liu, C. Fu and H. B. Mahood, Surf. Interfaces, 2020, 20, 100595 CrossRef CAS.
- M. Ahangar, M. Izadi, T. Shahrabi and I. Mohammadi, J. Mol. Liq., 2020, 314, 113617 CrossRef CAS.
- B. Chugh, A. K. Singh, D. Poddar, S. Thakur, B. Pani and P. Jain, Carbohydr. Polym., 2020, 234, 115945 CrossRef PubMed.
- M. Li, Y. Ouyang, W. Yang, Y. Chen, K. Zhang, Z. Zuo, X. Yin and Y. Liu, J. Mol. Liq., 2021, 322, 114535 CrossRef CAS.
- X. Wang, W. Gui, C. Yang and Y. Wang, Int. J. Miner. Process., 2011, 98, 113–117 CrossRef CAS.
- X. Zheng, S. Zhang, W. Li, L. Yin, J. He and J. Wu, Corros. Sci., 2014, 80, 383–392 CrossRef CAS.
| This journal is © The Royal Society of Chemistry 2022 |

