 Open Access Article
Influence of redox initiator component ratios on the emulsion copolymerisation of vinyl acetate and neodecanoic acid vinyl ester†
Laurence Isabelle Jacoba,
Werner Pauer a and
Baldur Schroeter
 *b
*b
aInstitute for Technical and Macromolecular Chemistry, University of Hamburg, Bundesstraße 45, 20146 Hamburg, Germany
bInstitute of Thermal Separation Processes, Hamburg University of Technology, Eißendorfer Straße 38, 21073 Hamburg, Germany. E-mail: baldur.schroeter@tuhh.de; Tel: +49 40 42878 3962
First published on 11th May 2022
Abstract
Redox initiated emulsion polymerisation of vinyl acetate and neodecanoic acid vinyl ester was investigated at temperatures ranging from −1 °C to 87 °C (initiation temperature between −1 °C and 60 °C), using varying molar ratios of the following redox components: L-ascorbic acid, tert-butyl hydroperoxide and ammonium iron(III) sulfate dodecahydrate as a catalyst. The high flexibility of redox initiators enables product properties, as well as space-time-yield, to be adjusted as required. Polymers being products by process, it was presumed that modifying the conversion rate would lead to a different product. However, it was shown that the reaction rate is adjustable by varying the catalyst amount without changing the product properties, such as molecular weight, particle size, glass transition temperature and polymer structure, while reducing the overall process time by 40–86% (at equimolar ratios of reducing and oxidising agent). In contrast, variation of the tert-butyl hydroperoxide content resulted in changes of the molecular weight. The influence of the initiation temperature and of the redox system on the reaction rate was determined, enabling control over the reaction rate in the whole temperature range. Meanwhile, overall process times of approximately 2–240 min and high conversions of 90–99% could be achieved. Statistical modelling confirmed the results and facilitated predictions, enabling the conversion rate to be adjusted to the desired properties. The possibility of being able to adjust the conversion rate and product properties independently of each other creates additional degrees of freedom in process design.
1. Introduction
Poly vinyl acetate is widely produced via bulk, solvent and emulsion polymerisation for use in many applications, for example, in paint or adhesives.1–5 However, though polymerisation processes in bulk or solvent may still be necessary to obtain the best adhesive properties, they are less suited for paint and varnish, as monomer and organic solvent residues can be harmful to users, as well as to the environment. The emulsion polymerisation process uses water as a solvent and is suitable for any application where the polymer is applied as a latex dispersion.6 Therefore, emulsion polymerisation is the most commonly used process for the production of water-borne latex polymers.7–11 The importance of emulsion polymerisation in industry and in a continuously growing field, leads to a high demand for different process optimisation strategies. Most of the radical based emulsion polymerisation processes are initiated by using thermal initiators.12–16 Due to the high temperatures required to achieve sufficient radical generation, while at the same time staying below the boiling point of water, the remaining temperature range required for the process is limited (60–95 °C), unless pressure is applied to increase the temperature even further.12,17–19 The initiation temperature (ϑ0) mainly affects the conversion rate of the polymerisation and therefore impacts the number of particles, as well as the resulting product properties, such as the molecular weight and its distribution. According to Lovell and Schork, reducing initiation temperature (ϑ0) also lowers the rate of chain transfer into polymer, as the activation energy is higher than the propagation energy, reducing the possibility of side chain reactions.19,20 In order to extend the accessible temperature range to lower temperatures, and to broaden the variety of final product properties, water soluble redox initiators have been introduced to emulsion polymerisation. Redox initiation enables the generation of free radicals by a one-electron transfer reaction, using an oxidising and reducing agent, sometimes complemented by a catalyst, depending on the system. The redox initiation results in a sufficient radical generation rate at milder conditions, since the activation energy is significantly lower compared to thermal initiators (only 40–80 kJ mol−1 instead of 125–60 kJ mol−1).20 One substantial optimisation aim in emulsion polymerisation is the increase in space-time-yield, while, at the same time, keeping the product properties constant. However, conversion rate and product properties cannot be adjusted independently of one another when using conventional thermal initiators, since variation of temperature commonly results in changes in the molecular weight (higher molecular weights at lower temperatures).19,21 The use of redox initiators is promising in this regard, as they offer the possibility of adjusting the radical generation rate (and thus the conversion rate of the polymerisation) by varying the component ratios and environmental settings (such as pH value), while keeping the initiation temperature constant. It has indeed been shown that the initiation temperature of emulsion polymerisations (e.g. of methyl methacrylate, styrene and butyl acrylate) can be lowered to 40 °C, without significantly affecting product properties, such as particle size or conversion.22–24 A further decrease of the process initiation temperature down to 30 °C and room temperature was achieved in the production of polyaniline.25,26 Reducing the initiation temperature without altering the product contributes positively to process intensification and process safety.27–29 For example, reducing the temperature can thereby result in a reduction of the production costs, since less heating of the reactor is required (which saves energy). Slowing down the conversion rate through process optimisation also reduces the risk of leakage when approaching the boiling point of the chemicals used, therefore increasing the safety of employees or workforce.30 Yet, until now, very few emulsion polymerisations have been successfully performed at lower temperatures while achieving high overall conversions. For instance, although the reaction temperature for poly vinyl acetate was reduced to the range of 8–22 °C by using a redox system composed of potassium persulfate and dimethylethanolamine, the overall conversion was limited to 48–88% after 4 h of reaction, therefore resulting in a comparatively low space-time-yield.31,32 Considering that the emulsion polymerisation of poly vinyl acetate at 60 °C can achieve a conversion of 99% after 15 min, 4 h of reaction for less conversion cannot be considered an efficient alternative.33,34 Even the use of Macro RAFT agents in combination with ascorbic acid and tert-butyl hydroperoxide at 25 °C sufficed only for a conversion of 55–89% after 24–48 h reaction time.35 Since redox initiated emulsion polymerisation at low temperatures has only scarcely been investigated, it is of great interest to expand research in this direction.In addition to the benefits that result from the extension of an applicable temperature range, the use of redox initiator systems considerably widens the possibilities of affecting the radical generation rate and therefore control of the whole polymerisation kinetics. For instance, adjustments of the pH, the type of peroxide, the ratio of oxidant to reducing agent, the amount of oxygen, the amount of catalyst, as well as the type and amount of other metal ions present in the dispersion can all affect the radical generation.36 While the above factors result in a high flexibility of the systems, they demand precise reaction control and fundamental understanding of the redox initiator kinetics under different reaction conditions.37
In this work, we have chosen to apply a redox initiator consisting of L-ascorbic acid (AsAc) as reducing agent, ammonium iron(III) sulfate dodecahydrate (Fe-cat.) as catalyst and tert-butyl hydroperoxide (tBHP) as oxidising and radical generating agent, since AsAc based systems have proven to be successful for emulsion polymerisation in the past, not only in batch or semi-batch but also in continuous processes (see Fig. 1).21,33–35 Although the reaction mechanism has not yet been fully proven, Fig. 1 shows a formal reaction scheme based on the iron catalysed reaction of H2O2 and Fe(II) as well as AsAc with Fe(III).37–39
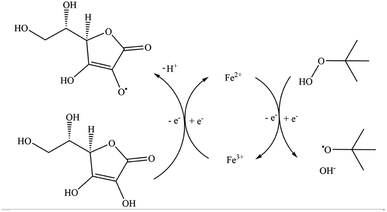 | ||
| Fig. 1 Schematic representation of the reaction mechanism of the redox system (AsAc/tBHP/Fecat.).37 | ||
The monomer system chosen for this study consists of vinyl acetate and neodecanoic acid vinyl ester (Versa®10), since vinyl acetate based latices are industrially relevant and have already been investigated in conjunction with the chosen redox components.34,37,40,41 Previous studies showed, that controlling the decomposition kinetic of ascorbic acid permits control of the reaction rate of emulsion polymerisation of vinyl acetate and Versa®10 in the temperature range of 10–70 °C.37 While this evidence indicates a high flexibility and achievable process control, the effect of reaction rate and temperature on the properties of the produced products were not documented.
There are different ways of influencing the process, either through modifying the set-up, the process parameters, or the kinetics of the reaction. In this work, the focus was placed on the influence of the reaction kinetics on the obtained product properties, so that the reactor set-up, as well as the different parameters, such as chemical compounds and stirrer speed, were kept constant. Ensuring consistent product qualities requires not only a thorough analysis of the final product, but the process must also be robust and reproducible. Therefore, most factors influencing the radical generation were also kept constant, and the focus was placed on the ratio of ascorbic acid to peroxide, on the amount of catalyst and on the initiation temperature.
The aim of this work is to significantly lower the initiation temperature, while achieving a full conversion and maintaining control over the desired product properties, such as the molecular weight (MW) and distribution (MWD), the particle size, or the glass transition temperature (Tg). Additionally, sufficient reaction rates and their control should be achieved in the whole temperature range.
The influence of the initiation temperature and of the amount of tBHP and Fe-catalyst is quantified in terms of product properties and polymerisation rate in order to achieve better process control in the whole temperature range from −1 to 87 °C.
2. Materials and methods
All chemicals were used directly and without further purification (Table 1).| Component | Abbreviation | Supplier | Purity |
|---|---|---|---|
| Vinyl acetate | VA | Wacker Chemie AG | 99% |
| Versa®10 | — | Wacker Chemie AG | 99% |
| Mowiol 4-88 | — | Sigma-Aldrich | MQ200 |
| L-Ascorbic acid | AsAc | Sigma-Aldrich | ACS |
| tert-Butyl hydroperoxide | tBHP | Sigma-Aldrich | MQ200 |
| Ammonium iron(III) sulfate dodecahydrate | Fe-cat. | Merck KGaA | ACS |
The initial charge (Table 2) of the reaction was first degassed with nitrogen for at least 30 minutes. The gas flow was fed into the initial charge through a metal pipe with a diameter of 2 mm and with a flow of approximately 120 bubbles per minute. The initial charge was stirred at 300 rpm during degassing. The finished emulsion was continually flushed with nitrogen throughout the entire reaction to avoid interferences due to oxygen influx. The amount of water evacuated by the continuous nitrogen flow was not taken into account, as it affects only 0.5–1.5% of the total amount, depending on the initiation temperature and reaction time.
2.1. Emulsion polymerisation – 0.5 L RC1mx calorimeter
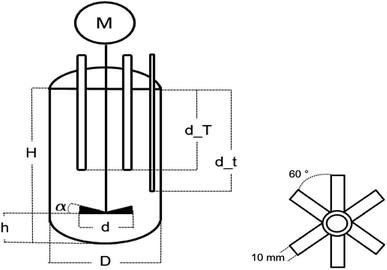
The emulsion polymerisations were carried out in a 0.5 L RC1mx glass calorimeter of Mettler Toledo as a batch process at 1 bar. The process was controlled via the IControl 6.1 software.The reactor is 16.5 cm deep, has a diameter of 6.88 cm and a dish-like bottom with the sample outlet in the middle. The reaction solution was stirred with a 45° pitched six blade stainless steel turbine with a diameter of 4.5 cm and at a stirring rate of 300 rpm. The stirrer was located in the center and 3.5 cm above the bottom of the reactor (cf. Fig. 2). The reactor was filled with 312 mL demineralised water with a conductivity of 0.8 uS cm−1, 80 g of a monomer mixture consisting of vinyl acetate and Versa®10 in a molar ratio of 9![[thin space (1/6-em)]](https://www.rsc.org/images/entities/char_2009.gif) :
:![[thin space (1/6-em)]](https://www.rsc.org/images/entities/char_2009.gif) 1 and 15 g L−1 Mowiol 4-88 as an emulsifier, representing 7.5 wt% of the monomer amount (Table 2). Prior to initiation, the emulsion was heated/cooled to the initiation temperatures of −1, 5, 15, 25 and 60 °C. The temperature was controlled by the RC1mx calorimeter and supported by a Julabo FP50 Cryostat.
1 and 15 g L−1 Mowiol 4-88 as an emulsifier, representing 7.5 wt% of the monomer amount (Table 2). Prior to initiation, the emulsion was heated/cooled to the initiation temperatures of −1, 5, 15, 25 and 60 °C. The temperature was controlled by the RC1mx calorimeter and supported by a Julabo FP50 Cryostat.
| Component | Water | Vinyl acetate/Versa®10 | Mowiol 4-88 | AsAc |
|---|---|---|---|---|
| Molar ratio | 9![[thin space (1/6-em)]](https://www.rsc.org/images/entities/char_2009.gif) : :![[thin space (1/6-em)]](https://www.rsc.org/images/entities/char_2009.gif) 1 1 |
|||
| Mass [g] | 312 | 80 | 6 | 0.83 |
| Concentration [g L−1] | — | — | 15 | 2.08 |
| wt% (based on total mass) | 78 | 20 | 1.5 | 0.2 |
| wt% (based on monomer) | — | — | 7.5 | 1.04 |
A redox initiator system was used to initiate the polymerisation reaction. It consisted of L-ascorbic acid (AsAc) acting as reducing agent, tert-butyl hydroperoxide (tBHP, 70%) acting as an oxidising agent and ammonium iron(III) sulfate dodecahydrate (Fe-cat.) as a catalyst. AsAc was previously dissolved in 3 g of demineralised water. tBHP was used without further modification and the Fe-cat. was dissolved in 1 g of demineralised water. The oxygen brought into the reaction through the initiation was insignificant due to the small amount compared to the initial charge and due to the continuous degassing throughout the reaction.
All three redox initiator components were each added as a one shot by using a polyethylene syringe from Henke-Sass, Wolf GmbH.
The amounts of oxidising agent and catalyst were varied, whereas the amount of AsAc was kept constant (Table 3). In the following Table 3, the molar ratio between the components AsAc:tBHP:Fe-cat. is defined as rredox. The ratio of the Fe-cat. component is defined as rFe-cat. and the ratio of tBHP as rtBHP. All ratios are given with respect to the component AsAc.
2.2. Determination of conversion
To determine the conversion of each reaction, a sample was taken at the end of each reaction through the outlet at the bottom of the reactor, inhibited with a 7 wt% hydroquinone solution, and then measured by gas chromatography (GC). In addition to the offline determination methods, an inline monitoring of the amount of monomer was performed by Raman spectroscopy.The end of the reaction was defined by the time at which the temperature of the reactor and the temperature of the jacket remained constant at the initial temperature and confirmed by Raman spectroscopy.
The signal at 1650 cm−1 shows an overlap of the C![[double bond, length as m-dash]](https://www.rsc.org/images/entities/char_e001.gif) C bond of both monomers, vinyl acetate and Versa®10, and can therefore be tracked during the reaction to determine the total monomer conversion.42
C bond of both monomers, vinyl acetate and Versa®10, and can therefore be tracked during the reaction to determine the total monomer conversion.42
 Q˙R the heat transfer coefficient of the reaction and
  Q˙baseline that of the baseline.
 | (1) |
2.3. Determination of mean particle size
The mean particle size was determined by dynamic light scattering (Zetasizer Nano ZS, Malvern Instruments). One drop of the sample previously used to determine the conversion was diluted in 5 mL demineralised water and then measured in a polyethylene UV-cuvette. Each particle size presented in the following work was obtained by a triple determination each consisting of 18 measurements at 25 °C.The refractive index (1.48) and density (1.167 g cm−1) of the copolymer were determined in a previous work and implemented in the dynamic light scattering software for all measurements.34
2.4. Determination of glass transition temperature
The Tg was determined by differential scanning calorimetry (DSC 1, Mettler Toledo). Approximately 3 g of the sample were dried in an aluminium sample pan in a drying cabinet at 60 °C for five days. 7–14 mg of the dried polymer were weighed into the sample crucible and measured with a temperature gradient of −30 °C to +250 °C. The heating rate was 10 °C min−1 and the cooling rate was 20 °C min−1. The accuracy of the measurements is approximately ±2 °C.432.5. Determination of molecular weight distribution
The molecular weight distribution was determined by gel permeation chromatography at room temperature using a Knauer Autosampler Smartline 3800, a Knauer K-4002 2-channel Degasser, an AI-12-13 intelligent pump from Flom, an RI 2000 Detector from Schambeck SFD GmbH and three columns (one PLgel 10 μm guard column and two PLgel 10 μm mixed-B) from Agilent. Tetrahydrofuran was used as eluent (flow rate: 1 mL min−1) and the device was calibrated with different molecular weight distributions of linear polystyrene. Adjusting the obtained molecular weight distribution by using the universal calibration and the Mark–Houwink equation, with the parameters summarised in Table 4, resulted in an increase of the molecular weight by approximately 5%.44–47| a | K [10−5 cm3 g−1] | |
|---|---|---|
| Poly styrene | 0.703 | 16 |
| Polyvinyl acetate | 0.791 | 5.1 |
For the measurements, 200 mg of the sample, previously homogenised by shaking, were withdrawn with a 100–1000 μL Eppendorf research micropipette and then dissolved in 5 mL N,N-dimethylacetamide. After complete dissolution of the polymer, 1.5 mL of the solution were transferred into an amber glass vial and sealed with a PTFE/silicone septum.
2.6. Determination of minimal film forming temperature (MFFT)
The minimal film forming temperature (MFFT) was determined using an MFFT 10 device from Coesfeld Materialtest.The MFFT was determined by spreading a 0.3 mm thick film onto the device, which was previously set to a temperature gradient ranging from 12.6 °C to 22.0 °C. The section where the previously applied and subsequently dried latex formed an even and transparent film was identified as the MFFT. The determination of the MFFT through this method has an accuracy of ±1 section, which, in this case, is equal to approximately ±2 °C.
The different temperature sections of the gradient are summarised in Table 5.
| Temperature section | 1 | 2 | 3 | 4 | 5 | 6 | 7 | 8 | 9 | 10 |
| Temperature [°C] | 12.6 | 13.8 | 14.9 | 16 | 17.1 | 18.2 | 18.9 | 20.1 | 21.1 | 22 |
2.7. Nuclear magnetic resonance (NMR) spectroscopy analysis
1H and 2D COSY NMR spectra were measured with an AV4001 spectrometer (Bruker Biospin GmbH, 400 MHz, 295 K). 10–13 mg of the dried polymer (previously dried for Tg measurements) were dissolved in 0.8 mL of DMSO-d6 and measured in a disposable NMR tube (Deutero BORO eco 5 mm 7′′). The spectra were analysed using MestReNova 14.0.1.2.8. Determination of the number of particles
The number of particles (Np) was calculated based on the total conversion and on the average particle size (dp) at each temperature. The following equation was used (eqn (2))
 | (2) |
3. Results and discussion
3.1. Conversion
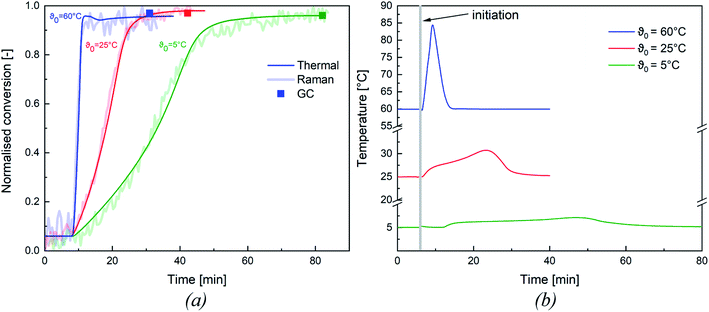
All experiments were tracked inline via Raman spectroscopy (cf. Appendix Fig. S1† for Representative Raman spectrum) and via reaction calorimetry to determine whether the monomer was fully consumed during the reaction. After completion of the reaction, a sample of the dispersion was taken and analysed by gas chromatography to confirm the final conversion of the emulsion polymerisation. In order to validate these methods, both methods were compared to the thermal conversion and assessed as to whether they were all suitable for an adequate representation of the conversion.Fig. 3 shows an overview of the normalised thermal and Raman conversion at different initiation temperatures, as well as the corresponding conversion determined by GC. Both trends concur and the conversion determined by GC also matches the inline conversions. To simplify the following analysis of our results, we have focused on the thermal conversion, as this method could be validated by the other two methods. An overview of the thermal conversion of all emulsion polymerisations considered in this work can be found in the ESI (cf. Appendix Fig. S2†).
While the presented example clearly demonstrates the influence of the initiation temperature on the reaction rate at constant redox initiator component ratios, the following sections further analyses the factors influencing polymerisation kinetics and product properties.
The conversion of all experiments are summarised in Table 6: all experiments show a near full conversion in the whole temperature range from ϑ0 = 60 °C to ϑ0 = −1 °C. It is therefore possible to achieve full conversion in reasonable time, even at a considerably reduced initiation temperature (cf. Fig. 3, conversion >95% after 80 min at ϑ0 = 5 °C). While no significant influence of ϑ0 and rFe-cat. was observed, slightly lower conversions (average = 94.7 ± 3.0%) were obtained at rtBHP = 0.7. Since emulsion polymerisation is a complex process and overall conversion can be influenced by many factors (e.g. mixing, initiation, emulsifier type & content, temperature, choice of monomer, etc.), a direct comparison of our results with other works is possible only to a limited extend. For instance, slightly lower conversions were achieved in a continuous process (residence time 5–15 min) where the same material system was polymerised in a tubular reactor: increasing the monomer content from 20 wt% to 40 wt% resulted in a decrease of the average conversion from 92% to 81%.33 Guan et al. obtained conversions in the range of 48–88%, but required longer reaction times (240 min) for the redox initiated emulsion polymerisation of vinyl acetate, using a potassium persulfate/N,N-dimethylethanolamine based initiator system.31 However, they did identify a significant influence of the reaction temperature on the overall conversion. This would indicate a significant advantage in using AsAc based redox systems compared to the example above. Guan et al. also noted an influence of the emulsifier content, which, however, was kept constant in this work and therefore cannot be verified.
| rredox | ϑ0 [°C] | ||||
|---|---|---|---|---|---|
| 60 | 25 | 15 | 5 | −1 | |
1![[thin space (1/6-em)]](https://www.rsc.org/images/entities/char_2009.gif) : :![[thin space (1/6-em)]](https://www.rsc.org/images/entities/char_2009.gif) 0.7 0.7![[thin space (1/6-em)]](https://www.rsc.org/images/entities/char_2009.gif) : :![[thin space (1/6-em)]](https://www.rsc.org/images/entities/char_2009.gif) 0.01 0.01 |
95.5 | 98.1 | 94.3 | 95.5 | 90.0 |
1![[thin space (1/6-em)]](https://www.rsc.org/images/entities/char_2009.gif) : :![[thin space (1/6-em)]](https://www.rsc.org/images/entities/char_2009.gif) 1.3 1.3![[thin space (1/6-em)]](https://www.rsc.org/images/entities/char_2009.gif) : :![[thin space (1/6-em)]](https://www.rsc.org/images/entities/char_2009.gif) 0.01 0.01 |
99.0 | 99.4 | 99.6 | 99.7 | — |
1![[thin space (1/6-em)]](https://www.rsc.org/images/entities/char_2009.gif) : :![[thin space (1/6-em)]](https://www.rsc.org/images/entities/char_2009.gif) 1 1![[thin space (1/6-em)]](https://www.rsc.org/images/entities/char_2009.gif) : :![[thin space (1/6-em)]](https://www.rsc.org/images/entities/char_2009.gif) 0.01 0.01 |
98.4 | 99.4 | 99.4 | 99.1 | — |
1![[thin space (1/6-em)]](https://www.rsc.org/images/entities/char_2009.gif) : :![[thin space (1/6-em)]](https://www.rsc.org/images/entities/char_2009.gif) 1 1![[thin space (1/6-em)]](https://www.rsc.org/images/entities/char_2009.gif) : :![[thin space (1/6-em)]](https://www.rsc.org/images/entities/char_2009.gif) 0.03 0.03 |
97.1 | 98.0 | 98.5 | 99.1 | 99.1 |
1![[thin space (1/6-em)]](https://www.rsc.org/images/entities/char_2009.gif) : :![[thin space (1/6-em)]](https://www.rsc.org/images/entities/char_2009.gif) 1 1![[thin space (1/6-em)]](https://www.rsc.org/images/entities/char_2009.gif) : :![[thin space (1/6-em)]](https://www.rsc.org/images/entities/char_2009.gif) 0.003 0.003 |
99.1 | 99.8 | 99.6 | 99.4 | — |
In the context of this work, we can conclude that the initiator provides a sufficient radical generation rate at all initiation temperatures. Furthermore, at least an equimolar ratio of tBHP and AsAc should be used to maximise the overall conversion. However, a high conversion is not the only criterion to assess a successful polymerisation at lower temperatures. It is also essential that the obtained product properties meet the desired requirements (see next section).
3.2. Product properties
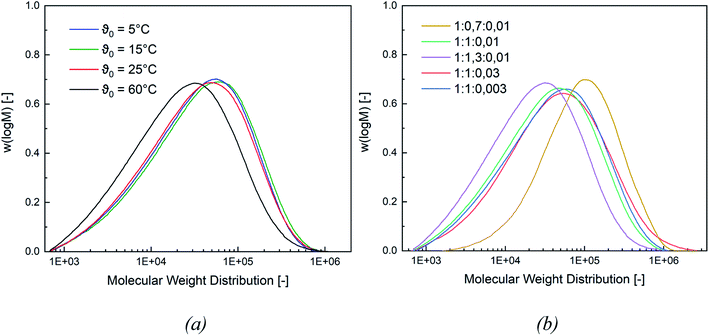
In this section, the correlation between the redox composition and initiation temperature on the product properties, such as particle size, molecular weight (MW), minimal film forming temperature (MFFT), as well as glass transition temperature (Tg), is discussed.Fig. 4 shows a representative comparison of the MW distributions obtained at a constant rredox and at different temperatures (for MW distributions of the remaining molar ratios cf. Appendix Fig. S5 and S6†). While a lower MW is obtained at ϑ0 = 60 °C, the average molecular weight stays constant at lower initiation temperatures. At the same molar ratio of the redox components, lowering the temperature will lead to higher MW, while a higher temperature favours termination reactions and therefore results in a lower MW. However, the change in ϑ0 has no effect on the MW below an initiation temperature of ≤25 °C.
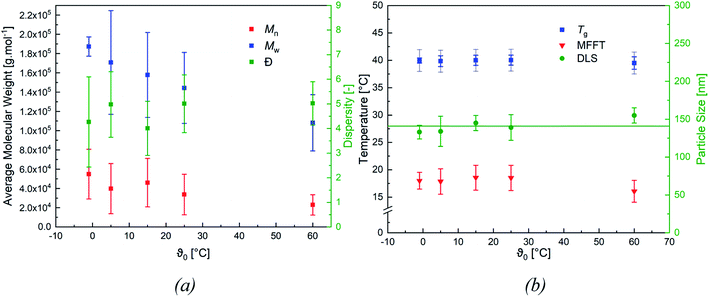
When varying the ratio of the redox initiator components at constant ϑ0, two effects are observed. Firstly, adjusting rFe-cat. showed no influence on MW nor on its distribution. However secondly, varying rtBHP results in changes of the MW: reducing the amount of peroxide has shifted the MWD to higher MW, while an increase has shifted the MWD to lower MW (see Fig. 4, (b)). When considering the MW solely as a function of ϑ0, an overall decreasing trend of the average Mn and Mw values of all experiments can be observed with higher temperatures (cf. Fig. 5, (a)), whereas the polydispersity index (DI = Mw/Mn) is not affected.
Fig. 5 (b) features the measured particle size as a function of ϑ0, as well as the average particle size (141 ± 8 nm), which was used to calculate the number of particles ((4.7 ± 0.8) × 1016 ≙ (1.2 ± 0.2) × 1017 L−1, cf. Table 7) present in the dispersion. The average number of particles shows no effect when varying rFe-cat. nor ϑ0.
| ϑ0 (°C) | Number of particles in 0.4 L (1016) | Number of particles in 1 L (1017 L−1) |
|---|---|---|
| 60 | 3.5 | 0.9 |
| 25 | 4.8 | 1.2 |
| 15 | 4.3 | 1.1 |
| 5 | 5.4 | 1.4 |
| −1 | 5.5 | 1.4 |
| Average | 4.7 ± 0.8 | 1.2 ± 0.2 |
Fig. 5 (b) also includes the DSC (accuracy: ±2 °C) and MFFT measurements which revealed an average Tg of 40 ± 1 °C and an equally constant film forming ability. This indicates an independency of the polymer structure towards a varying ϑ0 and rredox. Although this was expected, due to the choice of monomer having the most significant influence on polymer structure and flexibility, an additional 1H NMR spectroscopy analysis was conducted to verify this assumption (cf. Fig. 7, (a)).49 The 1H-NMR analysis showed a 98.9% superposition of the polymer signals at 4.75 ppm, 1.95 ppm and 1.75 ppm. The smaller but visible signals at around 1 ppm can be attributed to the neo-C9H19 chain originating from Versa®10, which has been added in a small amount, even though 1H-COSY NMR showed no coupling between these signals (cf. Fig. 7(b)).50 Furthermore, 13C- and HSQC-NMR spectra showed no coupling of these signals (Appendix, Fig. A7†), most probably due to the small ratio of vinyl acetate to Versa®10 and low signal intensities in 13C spectra.
According to literature, the small signals at 3.75–3.93 ppm, 4.21 ppm, 4.45 ppm and 4.66 ppm are related to the OH-group of the protective colloid polyvinyl alcohol.51,52 The CH2-group of polyvinyl alcohol overlaps with the signals related to the neo-C9H19 chain originating from the Versa®10 monomer and is located between 1.26 and 1.55 ppm.51,52 Since the signals belonging to the protective colloid partially overlap with those of the copolymer, the signal related to the CH-group (cf. Fig. 6) at 4.75 ppm has an average integral higher than 1, as will be shown hereafter.
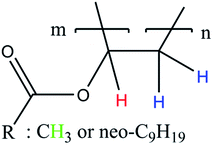 | ||
| Fig. 6 Simplified polymer structure for the assignment of NMR signals in Fig. 7 to their corresponding H-atoms. | ||
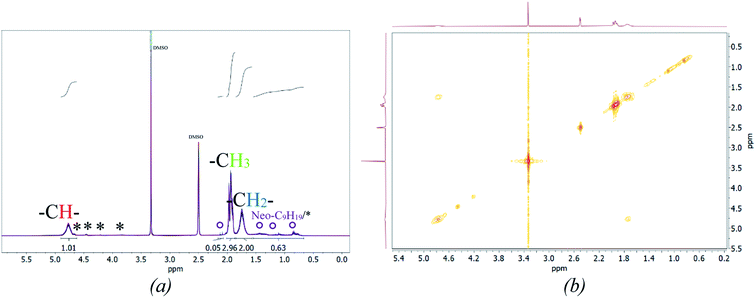 | ||
| Fig. 7 Stacked 1H NMR spectra of all products (a, *: signals associated to Mowiol 4-88, °: signal associated to R = Neo-C9H19) and a representative 2D 1H-COSY spectrum (b). | ||
To ensure a comparability of the spectra, the signal at 1.75 ppm was normalised to 2 (CH2-group, cf. Fig. 6) to be able to compare the resulting integral of the signals at 4.75 ppm and 1.75 ppm. This resulted into an average integral of 1.04 ± 0.01 for the CH-signal at 4.75 ppm and of 2.96 ± 0.03 for the CH3-signal at 1.95 ppm. The NMR analysis based on 30 samples showed an average deviation in the polymer structure of approximately 1.14%.
Examination of the signals related to the neo-C9H19 chain originating from the Versa®10 monomer indicates that both monomers may not be incorporated to the final copolymer in the original ratio of 9![[thin space (1/6-em)]](https://www.rsc.org/images/entities/char_2009.gif) :
:![[thin space (1/6-em)]](https://www.rsc.org/images/entities/char_2009.gif) 1. An estimation is possible by integrating the signals related to the neo-C9H19 chain and subtracting the signal intensity related to the –CH2 signal from the protective colloid, which overlaps with the neo-C9H19 signals. Accordingly, an average of 4 ± 1% of Versa®10 has been incorporated in to the copolymer. Interestingly, vinyl acetate to Versa®10 ratio is estimated to be highest at an initiation temperature of 60 °C, while a low initiation temperature of −1 or 5 °C led to a lower incorporation (cf. Appendix Table A4† for detailed intensities of the signals). This could be due to the very low water solubility of Versa®10 (2.58 wt% vinyl acetate against 7.5 × 10⁻⁴ wt% Versa®10 at room temperature50), which would increase at higher temperature and therefore facilitate the implementation of the monomer into the final polymer.
1. An estimation is possible by integrating the signals related to the neo-C9H19 chain and subtracting the signal intensity related to the –CH2 signal from the protective colloid, which overlaps with the neo-C9H19 signals. Accordingly, an average of 4 ± 1% of Versa®10 has been incorporated in to the copolymer. Interestingly, vinyl acetate to Versa®10 ratio is estimated to be highest at an initiation temperature of 60 °C, while a low initiation temperature of −1 or 5 °C led to a lower incorporation (cf. Appendix Table A4† for detailed intensities of the signals). This could be due to the very low water solubility of Versa®10 (2.58 wt% vinyl acetate against 7.5 × 10⁻⁴ wt% Versa®10 at room temperature50), which would increase at higher temperature and therefore facilitate the implementation of the monomer into the final polymer.
A more accurate, quantitative determination of the exact ratio via NMR-methods is, however, not possible due to overlapping of signals in 1H spectra and low signal intensities in 13C/HSQC spectra. Summarised, no significant differences in polymer structure could be identified via NMR-methods, whereas slight influence of polymerisation temperature on Versa®10 incorporation is indicated.
3.3. Statistical evaluation
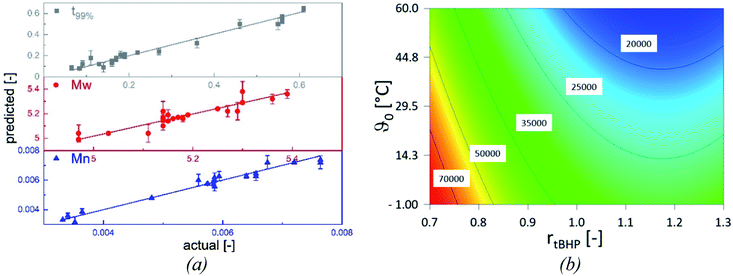
The statistical evaluation of the correlations described in the previous sections enables access to a broad range of interpolated reaction times and the related molecular weights of the products and validates the statistical significance of the empirically detected dependencies. The overall polymerisation rate is described by the time at which 99% of the overall conversion of the reaction is achieved (t99%, min). All models are statistically relevant, as indicated by the analysis of variances (cf. Appendix Tables A1–A3†), and provide an adequate description in the interpolated range (Table 8), as shown by the parameter plots (R2 0.988–0.999, Fig. 8, (a)).| Model output | Rmodel2 | Radj.2 | Rpred.2 | Significant influence factors | Range |
|---|---|---|---|---|---|
| Mn | 0.962 | 0.956 | 0.942 | ϑ0, rtBHP | 17![[thin space (1/6-em)]](https://www.rsc.org/images/entities/char_2009.gif) 400–100 400–100![[thin space (1/6-em)]](https://www.rsc.org/images/entities/char_2009.gif) 600 g mol−1 600 g mol−1 |
| Mw | 0.851 | 0.825 | 0.775 | ϑ0, rtBHP | 97![[thin space (1/6-em)]](https://www.rsc.org/images/entities/char_2009.gif) 000–238 000–238![[thin space (1/6-em)]](https://www.rsc.org/images/entities/char_2009.gif) 000 g mol−1 000 g mol−1 |
| t99% | 0.968 | 0.961 | 0.942 | ϑ0, rFe-cat., rtBHP | 4–236 min |
The relations follow quadratic process orders, whereas the reaction time is exponentially related to ϑ0 and linearly to rFe-cat., as well as to rtBHP (eqn (3)).
 | (3) |
In general, with equimolar ratios of reducing and oxidising agents, the overall process time can be reduced by 40–86% by varying rFe-cat.. For example, at equimolar ratios of AsAc and tBHP, low initiation temperatures (ϑ0 ≤ 25 °C) and high catalyst concentration (rFe-cat. = 0.03) a complete conversion can be achieved in shorter reaction times (t99% = 10–22 min), whereas the reaction time increases to t99% = 32–194 min when rFe-cat. is lowered by a factor ten. Increasing tBHP would also result in higher reaction rates but would also lead to changes in the molecular weight at the same time, since Mn and Mw show linear relations to initiation temperature but exponential relations to rtBHP (eqn (4) and (5)).
 | (4) |
| log10(Mw) = +6.00 − 1.21rtBHP − 3.31 × 10⁻³ϑ0 + 4.49 × 10⁻¹rtBHP2 | (5) |
In contrast to thermal initiators, additional degrees of freedom are obtainable in a certain range, which allows the product properties as well as the reaction time to be adjusted, simply by varying rredox: in particular, different molecular weights can be targeted by varying rtBHP at a constant ϑ0, while the reaction rate can be controlled independently by adjusting rFe-cat..
It is interesting to note that the DI solely depends on rtBHP and not on ϑ0, with the highest DI (6.5) obtained at max. rtBHP and the lowest (2.4) at min. rtBHP. Our results are within the same range as previous works, where DIs of 5.2–6.0 were obtained for the same redox/monomer system at rtBHP = 1.0 and in a continuous process with slightly higher monomer contents (20–40 wt%).33
While the data given in this section enables a prediction of the final product properties and reaction times, the influence of rredox and ϑ0 on the kinetics of the polymerisation are discussed in the next section.
3.4. Reaction kinetics
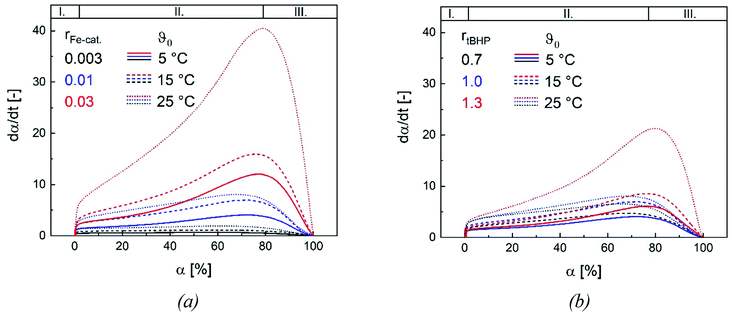
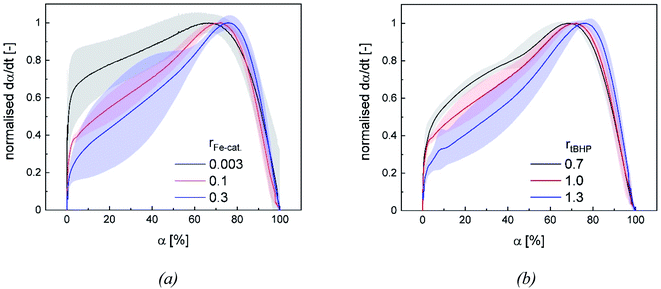
Changes in product properties and overall reaction times are connected to the individual reaction profiles. The reaction rate increases for all settings with higher ϑ0, as well as with changes regarding rFe-cat. and rtBHP (cf. Fig. 9), which demonstrates that all of these factors contribute to the radical generation rate of the initiator system. The kinetic profile of all reactions clearly shows three intervals (I, II and III, cf. Fig. 9): After adding the initiator, a rapid increase in polymerisation rate occurs without any induction period, which is related to the process of micellar nucleation (Interval I). As soon as the conversion reaches approx. 3%, a less pronounced but still significant further increase in reaction rate is observed (Interval II). After 66–76% conversion, the system enters interval III (disappearance of monomer droplets) without showing a gel effect. The uniformity of the profiles indicates that the polymerisation rate in the binary vinyl acetate and Versa®10 system can be described via a pseudo-homopolymerisation approach in the temperature range of ϑ0 ≤25 °C (Fig. 9).9The additional increase of the reaction rate in interval II shows that significant nucleation occurs until interval III is reached: This result is consistent with former works, in which significant secondary nucleation was reported for redox initiated emulsion polymerisations, and in contrast to processes using thermal initiators.14 Since both a higher ϑ0 and a higher rFe-cat. lead to a significant increase in the reaction rates during interval II, we can conclude that the secondary nucleation is directly related to the radical generation rate. Interestingly, no changes in MW, particle number nor particle size were observed, when varying rFe-cat. : this shows that in this case, the overall process and product properties are dominated by one influence factor. Due to the relatively high hydrophobicity of VAc, Versa®10, tBHP and the (most probably) generated tert-butoxy radicals, as well as the low monomer and high emulsifier contents in this work, it can be assumed that particle generation occurs predominantly via micellar nucleation. Therefore, the main factor determining the reaction rate when varying rFe-cat. should be the entry of radicals into monomer-swollen micelles, whereas events during particle growth, such as radical entry/exit, which may affect chain propagation, chain transfer or termination, are not influenced. The rate of chain termination has been reported to be relatively slow compared to the rates of transfer to monomer and polymer in emulsion polymerisation of vinyl acetate. The influence of the termination rate on the molecular weight can therefore be considered negligible even at high initiation rates.53 In general, Fig. 10 shows that the reaction rate increases with higher rtBHP as well as rFe-cat.. This trend is consistent with previous results on redox initiated emulsion polymerisations and can be explained by higher reaction rates at higher oxidising component ratios.37 Furthermore, a higher initiator concentration has been shown to lead to lower MW (e.g. for AsAc/H2O2 initiated polymerisation of n-butyl methacrylate).14 This trend could also be explained by a higher radical entry rate into the micelles, although the question arises as to why a variation of rtBHP results in changes of the MW, while variation of rFe-cat. does not (Fig. 4(b)).
Our results suggest that the maximum polymerisation rate is linearly related to rFe-cat. and exponentially related to rtBHP: this trend is in accordance with former results regarding the decomposition rate constant of AsAc in the redox initiator system, which depends linearly on rFe-cat. and exponentially on the ratio of oxidising to reducing agent.37 While the present data provides kinetic information in dependency of rredox, it is still not precisely clarified exactly which radicals are formed and whether, in addition to changes in the decomposition rate, the formation of different radical species occurs due to changes in rtBHP, as is suggested by the observed change of MW in this work. In this sense, our results emphasize the importance of further investigations on redox initiator decomposition mechanisms in dependency of process conditions and rredox.
4. Conclusion
It was shown that AsAc/tBHP/Fe-cat. redox initiated emulsion copolymerisation of vinyl acetate and Versa®10 in the temperature range of −1 to 87 °C results in high conversion (95–99%) as well as variable and fast reaction times in the whole temperature range. The process was investigated with respect to the influence of different molar ratios of the redox system and variation of initiation temperatures on the conversion rate and product properties. While the conversion rate is adjustable by both the rredox as well as ϑ0, the product properties were found to be independent of the amount of catalyst used to initiate the polymerisation, and therefore independent of the radical generation rate. Modifying the amount of oxidising agent resulted in changes in MW, but not in its distribution nor particle size. Overall, this work has proved that the process can be modified to a certain extent to increase process safety or reduce production costs, without compromising on the desired product properties.Conflicts of interest
The authors declare no competing financial interest.Acknowledgements
The authors wish to thank the Wacker Chemie AG for providing the monomers vinyl acetate and Versa®10. The authors would like to express a special thank you to the following students Wiebke Kahns, Willi Wagner, Lena Joost and Elli Richters for their support in carrying out the experiments and analytical methods.References
- S. Banerjee, V. Ladmiral, A. Debuigne, C. Detrembleur, S. M. W. Rahaman, R. Poli and B. Ameduri, Macromol. Rapid Commun., 2017, 38, 1–7 CrossRef.
- S. Banerjee, I. Domenichelli and B. Ameduri, ACS Macro Lett., 2016, 5, 1232–1236 CrossRef CAS.
- Y. Gu, J. He, C. Li, C. Zhou, S. Song and Y. Yang, Macromolecules, 2010, 43, 4500–4510 CrossRef CAS.
- N. Zeng, Y. Yu, J. Chen, X. Meng, L. Peng, Y. Dan and L. Jiang, Polym. Chem., 2018, 9, 3215–3222 RSC.
- A. Debuigne, C. Jérôme and C. Detrembleur, Polymer, 2017, 115, 285–307 CrossRef CAS.
- K. Kolter, A. Dashevsky, M. Irfan and R. Bodmeier, Int. J. Pharm., 2013, 457, 470–479 CrossRef CAS PubMed.
- W. Pauer, Polym. React. Eng., 2017, I, 1–17 Search PubMed.
- N. Kohut-Svelko, R. Pirri, J. M. Asua and J. R. Leiza, J. Polym. Sci., Part A-1: Polym. Chem., 2009, 47, 2917–2927 CrossRef CAS.
- M. Nomura, H. Tobita and K. Suzuki, Adv. Polym. Sci., 2005, 175, 1–128 CrossRef CAS.
- S. Slomkowski, J. V. Alemán, R. G. Gilbert, M. Hess, K. Horie, R. G. Jones, P. Kubisa, I. Meisel, W. Mormann, S. Penczek and R. F. T. Stepto, Pure Appl. Chem., 2011, 83(12), 2229–2259 CrossRef CAS.
- S. C. Thickett and R. G. Gilbert, Polymer, 2007, 48, 6965–6991 CrossRef CAS.
- K. Rossow, P. Bröge, F. G. Lüth, P. Joy, A. Mhamdi, A. Mitsos, H. U. Moritz and W. Pauer, Macromol. React. Eng., 2016, 10, 324–338 CrossRef CAS.
- K. Tauer, H. Müller, C. Schellenberg and L. Rosengarten, Colloids Surf., A, 1999, 153, 143–151 CrossRef CAS.
- S. Wang, E. S. Daniels, E. D. Sudol, A. Klein and M. S. El-Aasser, J. Appl. Polym. Sci., 2015, 133, 43037 Search PubMed.
- S. Krishnan, A. Klein, M. S. El-Aasser and E. D. Sudol, Polym. React. Eng., 2003, 11, 335–357 CrossRef CAS.
- S. Bettermann, R. Stuhr, H.-U. Moritz and W. Pauer, Chem. Eng. Sci., 2019, 206, 50–62 CrossRef CAS.
- R. González-Blanco, N. Jiménez-Reyes, M. F. Cunningham and E. Saldívar-Guerra, Macromol. React. Eng., 2021, 15, 1–9 Search PubMed.
- A. Barquero, A. Agirre, M. J. Barandiaran and J. R. Leiza, Macromol. React. Eng., 2020, 14, 1–9 Search PubMed.
- P. A. Lovell and F. J. Schork, Biomacromolecules, 2020, 21, 4396–4441 CrossRef CAS PubMed.
- A. S. Sarac, Prog. Polym. Sci., 1999, 24, 1149–1204 CrossRef CAS.
- A. Agirre, I. Calvo, H. P. Weitzel, W. D. Hergeth and J. M. Asua, Ind. Eng. Chem. Res., 2014, 53, 9282–9295 CrossRef CAS.
- J. Tan, X. Dai, Y. Zhang, L. Yu, H. Sun and L. Zhang, ACS Macro Lett., 2019, 8, 205–212 CrossRef CAS.
- K. Hori, M. Sano, M. Suzuki and K. Hanabusa, Polym. Int., 2018, 67, 909–916 CrossRef CAS.
- M. Awad, R. Dhib and T. Duever, Macromol. React. Eng., 2021, 15, 1–11 Search PubMed.
- O. J. Deane, O. M. Musa, A. Fernyhough and S. P. Armes, Macromolecules, 2020, 53, 1422–1434 CrossRef CAS.
- H. G. Taleghani, M. Aleahmad and H. Eisazadeh, Synth. Met., 2012, 161, 2638–2640 CrossRef.
- M. Ochi, J. Ida, T. Matsuyama and H. Yamamoto, J. Appl. Polym. Sci., 2015, 132, 1–8 CrossRef.
- M. van den Brink, M. Pepers, A. M. van Herk and A. L. German, Macromol. Symp., 2000, 126, 121–126 CrossRef.
- A. S. Kolobkov, Fibre Chem., 2015, 46, 337–340 CrossRef CAS.
- F. Andami, M. Ataeefard, F. Najafi and M. R. Saeb, Pigm. Resin Technol., 2016, 45, 363–370 CrossRef CAS.
- Y. Guan, J. Li, L. Shao, F. Wang, D. Dong and Y. Wang, Polym. Int., 2016, 65, 1382–1386 CrossRef CAS.
- B. Wang, X. Bao, M. Jiang, G. Ye and J. Xu, J. Appl. Polym. Sci., 2012, 125, 2771–2778 CrossRef CAS.
- S. Bettermann, B. Schroeter, H. U. Moritz, W. Pauer, M. Fassbender and G. A. Luinstra, Chem. Eng. J., 2018, 338, 311–322 CrossRef CAS.
- L. I. Jacob and W. Pauer, RSC Adv., 2020, 10, 26528–26534 RSC.
- S. Binauld, L. Delafresnaye, B. Charleux, F. Dagosto and M. Lansalot, Macromolecules, 2014, 47, 3461–3472 CrossRef CAS.
- G. S. Misra and U. D. N. Bajpai, Prog. Polym. Sci., 1982, 8, 61–131 CrossRef CAS.
- B. Schroeter, S. Bettermann, H. Semken, T. Melchin, H. P. Weitzel and W. Pauer, Ind. Eng. Chem. Res., 2019, 58, 12939–12952 CrossRef CAS.
- G. R. Buettner and B. A. Jurkiewicz, Radiat. Res., 1996, 145, 532–541 CrossRef CAS PubMed.
- T. Kanti Das, M. R. Wati and K. Fatima-Shad, Arch. Neurosci., 2014, 2, 1–8 Search PubMed.
- D. Victoria-Valenzuela, J. Herrera-Ordonez, G. Luna-Barcenas, G. D. Verros and D. S. Achilias, Macromol. React. Eng., 2016, 10, 577–587 CrossRef CAS.
- M. S. El-Aasser and J. W. Vanderhoff, Emulsion polymerization of vinyl acetate, Applied Science Publishers, 1981 Search PubMed.
- W. D. Hergeth, Chem.-Ing.-Tech., 1998, 70, 894–898 CrossRef CAS.
- M. Toledo, Accuracy of the DSC1, 2021 Search PubMed.
- M. Adler, Entwicklung von chromatographischen Methoden zur Analyse von hydrophilensynthetischen Copolymeren, Technische Universität Darmstadt, Germany, 2005 Search PubMed.
- Z. Grubisic, P. Rempp and H. Benoit, Rubber Chem. Technol., 1969, 42, 636–640 CrossRef.
- M. A. Masuelli, J. Polym. Biopolym. Phys. Chem., 2014, 2, 37–43 CAS.
- Mark-Houwink Parameters for Polymers, http://www.ampolymer.com/Mark-Houwink.html, accessed 13 November 2021 Search PubMed.
- L. Jacob and W. Pauer, RSC Adv., 2020, 10, 26528–26534 RSC.
- A. Rudin and P. Choi, Elem. Polym. Sci. Eng., 2013, 1–62 Search PubMed.
- X. Q. Wu, X. M. Hong, C. Cordeiro and F. J. Schork, J. Appl. Polym. Sci., 2002, 85, 2219–2229 CrossRef CAS.
- I. Korbag and S. Mohamed Saleh, Int. J. Environ. Stud., 2016, 73, 226–235 CrossRef CAS.
- X. Hong, L. Zou, J. Zhang and L. Wang, E3S Web Conf., 2020, 206, 1–5 Search PubMed.
- N. Friis, D. Goosney, J. D. Wright and A. E. Hamielec, J. Appl. Polym. Sci., 1974, 18, 1247–1259 CrossRef CAS.
Footnote |
| † Electronic supplementary information (ESI) available. See https://doi.org/10.1039/d2ra01811j |
| This journal is © The Royal Society of Chemistry 2022 |

