DOI:
10.1039/D2RA01291J
(Paper)
RSC Adv., 2022,
12, 14190-14196
Flexible and high-performance piezoresistive strain sensors based on multi-walled carbon nanotubes@polyurethane foam
Received
25th February 2022
, Accepted 16th April 2022
First published on 11th May 2022
Abstract
Flexible wearable pressure sensors have attracted special attention in the last 10 years due to their great potential in health monitoring, activity detection and as electronic skin. However, it is still a great challenge to develop high sensitivity, fast response, and good reliable stability through a simple and reproducible large-scale fabrication process. Here, we develop a simple and efficient method to fabricate three-dimensional (3D) light-weight piezoresistive sensing materials by coating multi-walled carbon nanotubes (MWCNTs) on the surface of polyurethane (PU) foam using a dip-spin coating process. The PU foam prepared with SEBS-g-MAH and polyether polyols has high elasticity and good stability in MWCNTs/DMF solution. Subsequently, a piezoresistive sensor was assembled with the prepared MWCNTs/PU composite foam and copper foil electrodes. The assembled pressure sensor has high sensitivity (62.37 kPa−1), a wide working range (0–172.6 kPa, 80% strain), a fast response time (less than 0.6 s), and reliable repeatability (≥2000 cycles). It has shown potential application in real-time human motion detection (e.g., arm bending, knee bending), and monitoring the brightness of LED lights.
1. Introduction
In recent years, flexible wearable pressure sensors have received extensive attention due to their increasing demand in human motion monitoring,1,2 human–computer interaction,3,4 flexible electronic skin,5 etc. According to the operating principle, there are three main types of pressure sensors: piezoelectric, capacitive, and piezoresistive.1 Among them, piezoresistive sensors, which convert the applied strain or pressure into resistance or a current signal, are widely used due to their high sensitivity, fast response time, low production cost, and easy signal acquisition.6
In contrast to rigid sensors, flexible piezoresistive sensors use a flexible substrate combined with conductive materials to prepare sensor-sensitive material. Common flexible substrate materials include yarn,7 fabrics,8–10 flexible polymers,11 etc. Conductive materials usually include metal particles,12,13 carbon-based materials such as carbon nanotubes, carbon black, graphene, etc.,14,15 and conductive polymers such as polypyrrole16 and polythiophene.17 Flexible pressure sensors can be classified into one-dimensional, two-dimensional, and three-dimensional forms based on their structure. One-dimensional yarn-type pressure sensors are usually made of elastic fibers or elastic rubber as a flexible substrate to which conductive materials are attached by immersion or coating. Montazerian et al. proposed a low-cost, stretchable sensor with adjustable sensitivity, prepared from Spandex yarn coated with graphene nanosheets, capable of detecting a wide range of strains from wrist pulses to joint movements.7 Two-dimensional structured piezoresistive sensors are usually prepared using thin-film substrates. Lu et al. used cone-shaped anodic aluminium oxide (AAO) as a template to in situ polymerize monomeric pyrrole (PPy) and spin-coat polymethyl methacrylate (PMMA) to prepare nano cone arrays PPy@PMMA conductive film. A flexible piezoresistive sensor with a sensitivity of up to 268.36 kPa−1 and low hysteresis of ±3.156% was fabricated by using the interlocking structure.18 Tao et al. mixed paper towels with graphene (GO) solution to prepare a simple pressure sensor with sensitivity up to 17.2 kPa−1 for large-scale application.8 However, such sensors tend to have a low-test limit and cannot respond sensitively to a small range of pressure signals, so the sensitivity and test limits of sensors are usually improved by fabricating microstructures on the surface of sensitive layers. He et al. successfully fabricated a porous piezoresistive sensor with carbon nanotubes and PU, with an air permeability up to 8 times that of ordinary sensors and a sensitivity of 26.01 kPa−1.19 A wide variety of micro and nanostructure sensitive components have been designed and applied to improve the sensitivity of sensors,20,21 such as pyramids,22 microcracks,23 biomimetic structures,24 and porous structures,19,25,26 etc.
Compared with one-dimensional and two-dimensional flexible pressure sensors, three-dimensional (3D) piezoresistive sensors exhibit excellent sensing performance, which is attributed to the unique 3D interconnected network microstructure and excellent elastic recovery properties of flexible 3D conductive materials. At present, various conductive aerogels and sponge foams with excellent properties have been applied to pressure sensors. Huang et al. successfully used a simple ultrasonic-assisted dip-coating method to prepare conductive sponges by coating conductive particles (CB/CNT) on the polyurethane sponge skeleton to prepare a conductive sponge and designed it as a piezoresistive strain sensor, which can detect various human movements, including blowing, swallowing, breathing deeply, bending fingers, bending elbows, and bending knees.27 Huang et al. doped polyaniline (PANI) into bacterial cellulose/chitosan (BC/CH) to create a composite material by a simple freeze-drying technique and designed a PANI/BC/CH aerogel with a BC![[thin space (1/6-em)]](https://www.rsc.org/images/entities/char_2009.gif) :CH weight ratio of 1:1 and a sensitivity of 1.41 kPa−1 for low-pressure detection at 32 Pa with a pressure wide range of deformation and exceptional stability as a piezoresistive sensor.28
:CH weight ratio of 1:1 and a sensitivity of 1.41 kPa−1 for low-pressure detection at 32 Pa with a pressure wide range of deformation and exceptional stability as a piezoresistive sensor.28
As a 3D porous flexible material with a continuous and deformable skeleton, sponges can be used to build infiltrated conductive networks on their continuous skeleton surfaces to prepare flexible piezoresistive sensors. It has been studied that by coating a thin layer of conductive particles such as metal particles,29,30 carbon black,31 carbon nanotubes32 and graphene,33 etc. On the surface of a sponge skeleton to create 3D conductive networks, which are simple to prepare, have low manufacturing cost and can be widely used for the preparation of flexible piezoresistive sensors.
In this paper, a PU foam-based pressure sensor prepared by dip-spin coating method is proposed. Firstly, SEBS-g-MAH and polyether polyols were mixed and stirred evenly, and then poured into a closed mold to prepare a highly elastic polyurethane (PU) foam. Then, the prepared PU foam was dipped in the multi-walled carbon nanotube/N,N-dimethylformamide (MWCNTs/DMF) dispersion for 1 minute, and spinning coating for 3 minutes at 1000 rpm to prepare MWCNTs/PU conductive foam. The assembled piezoresistive pressure sensor has a high sensitivity, wide sensing range, fast response time and reliable repeatability. It has shown potential applications in real-time human motion detection (e.g., arm bending, knee bending), and monitoring the brightness of LED lights in real-time.
2. Experimental
2.1. Materials
Polyether polyol (CST-1076A) and isocyanate (CST/1076B) were purchased from Keshengda Trading, Shenzhen, China with a specific weight of 1.05 g cm−3 and 1.25 g cm−3 respectively. SEBS-g-MAH (average particle size of 250 μm) was purchased from Hongli Plastic Material, Dongguan, China. N,N-Dimethylformamide (DMF) was supplied by Tianjin Fengchuan Chemical Reagent Technology Co., Ltd, Tianjin, China. MWCNTs/DMF dispersion was purchased from the Chinese Academy of Sciences Chengdu Organic Chemistry Co., Ltd, Chengdu, China. MWCNTs were purchased from Shenzhen Hongdachang Evolution Technology Co., Ltd, Shenzhen, China. Anhydrous ethanol was purchased from Tianjin Fengchuan Chemical Reagent Co., Ltd, Tianjin, China, and distilled water was purchased from Tianjin Blue Crystal Company, Tianjin, China. All chemicals were used without further purification.
2.2. Fabrication of PU foam
Fig. 1(a) shows the process of preparing PU foam samples. SEBS-g-MAH and polyether polyol were mixed at room temperature with stirring at 450 rpm for 40 min, followed by ultrasonic dispersion treatment at 30 °C for 5 min; then, isocyanate was added and mixed at 1000 rpm for 10 seconds. The mixture was injected into the mold, foamed, and cured at room temperature (25 °C) and atmospheric pressure, noted as PU foam.34 The density of prepared PU foam is 0.152 ± 0.003 g cm−3.
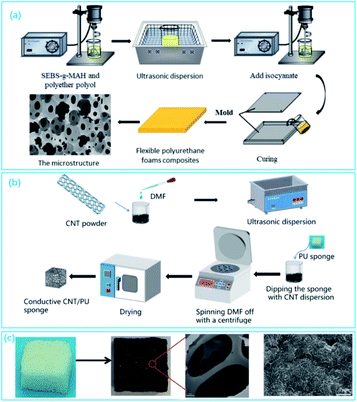 |
| | Fig. 1 Schematic illustration (a) preparation process of PU foam;34 (b) preparation process of conductive MWCNTs/PU foam; (c) optical photographs of the PU foam before and after dip coating MWCNTs and microscopic images of the surface after dipping. | |
2.3. Fabrication of CNT@PU composite foam
The prepared PU foam was cut to 20 mm × 20 mm × 10 mm and cleaned using anhydrous ethanol. As shown in Fig. 1(b), different weight percentages of MWCNTs (2 wt%, 4 wt%, 6 wt%, 8 wt%, and 10 wt%) with DMF dispersions were prepared with stirred well and ultrasonic dispersion for 2 hours. The cleaned PU foam was dipped in the prepared MWCNTs/DMF solutions with different concentrations for 1 minute and then spined coating for 3 minutes at 1000 rpm twice to ensure that the excess liquid was removed from the foam skeleton. After that, the MWCNTs/PU foam composites with different weight percentages of MWCNTs (2 wt%, 4 wt%, 6 wt%, 8 wt%, and 10 wt%) were dried at a vacuum oven at 80 °C for 300 min. Fig. 1(c) shows that the color change from white to black after dip coating the MWCNTs, indicating that the MWCNTs has been successfully attached to the foam surface.
2.4. Characterizations
Field emission scanning electron microscopy (S8100, Hitachi, Japan) was utilized to characterize the morphologies of the original PU foam and MWCNTs/PU composite foam. The infrared spectra of PU foam and MWCNTs/PU foam were measured using a Thermo Fisher Scientific Nicolet iS10 Fourier infrared spectrometer. The electrical conductivity of the composite foam was measured using a U3402A multi-meter from Agilent Technologies and Dual-electricity digital four-probe tester (ST 2263) from Suzhou Lattice Electronics Co., Ltd, Suzhou, China. The flexible sensor test system (TP-550) developed by Tianjin Zhirou Technology Co., Ltd, Tianjin, China was used to test the mechanical properties and sensing properties of the MWCNTs/PU piezoresistive sensor.
3. Results and discussion
3.1. Surface morphology
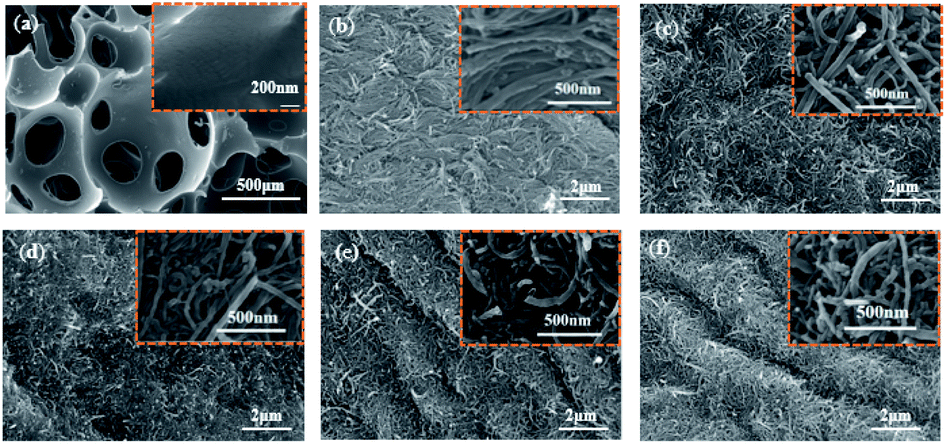
The morphologies of PU foam and MWCNTs/PU foam composites with different concentrations were then systematically characterized. As shown in Fig. 2(a), the surface of the neat PU sponge skeleton was flat and smooth, exhibited a hierarchically open-cell structure with major pores of about 150–300 μm and no MWCNTs were found. Fig. 2(b–d) shows the distribution of MWCNTS with the concentration of 2%, 4%, 6%, 8%, 10% on the PU foam skeleton. Compared with neat PU foam, the MWCNTs conductive fillers have all been attached to the foam skeleton. When the CNT concentration is 2%, the MWCNTs are uniformly arranged on the surface of the foam without mutual entanglement. As the concentration of MWCNTs increases, the MWCNTs on the surface of the foam are entangled with each other, increased conductive network in space, but when the MWCNTs increased to 8% and 10%, too many carbon nanotubes are stacked together, creating gullies.
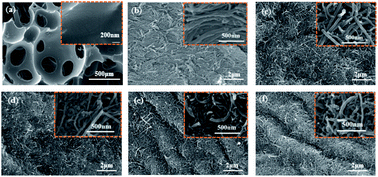 |
| | Fig. 2 SEM images of dip-coated MWCNTs with different concentrations, (a) uncoated, (b) 2% MWCNTs; (c) 4% MWCNTs, (d) 6% MWCNTs, (e) 8% MWCNTs, (f) 10% MWCNTs. | |
3.2. Electrical conductivity
The skeleton of the PU foam provides a continuous surface for the conductive MWCNTs, and the dense MWCNTs wrapped on the skeleton provide the conductive pathways, as shown in Fig. 2 SEM image. The electrical conductivity of the MWCNTs/PU foam with different concentrations was tested. As shown in Fig. 3(a), the bulk resistance (the composite foam was placed between two copper sheets with a 20 g weight placed on the copper sheet) showed a downward trend with the MWCNTS concentration increasing from 2% to 8%. When the CNT concentration increased from 2% to 4%, the initial resistance dropped abruptly from 11.82 kΩ to 5.24 kΩ, then the rate of decrease slowed down to 1.838 kΩ at 6%, and to 0.58 kΩ at 8%. At 10%, the initial resistance no longer decreased but increased to 1.005 kΩ. Furthermore, the electrical conductivity of the MWCNTs/PU foam was also tested using a four-probe resistance tester. As shown in Fig. 3(b), when the CNT concentration increased from 2% to 6%, the electrical conductivity showed a sharp decline from 2388.37 Ω cm to 1313.82 Ω cm, then to 220.19 Ω cm. After that, the electrical conductivity kept a small change from the 6% to 10%. When the concentration was increased to 6%, the decrease in conductivity slowed down to 220.19 Ω cm. When the concentration was 8% the conductivity was as low as 160.53 Ω cm. As the concentration continued to increase, the corresponding conductivity no longer decreased. The conductivity increased to 166.76 Ω cm when the concentration reached 10%. As can be seen from Fig. 3, the overall trend of electrical conductivity change of the conductive foam is the same as the initial resistance, further verifying that the electrical conductivity of the conductive foam is best at a CNT concentration of 8%.
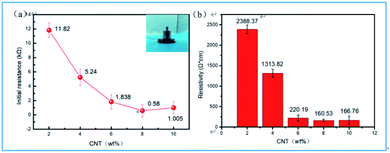 |
| | Fig. 3 Electrical conductivity (a) initial resistance (b) electrical conductivity. | |
3.3. Mechanical properties
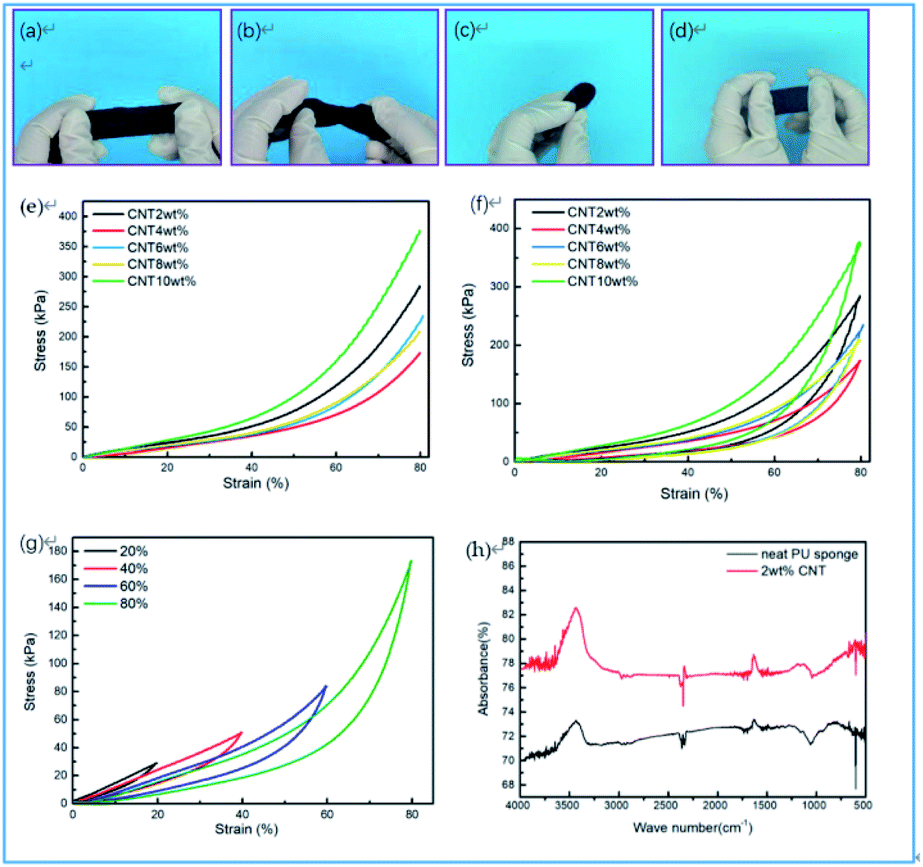
High compressive stress and good recoverable deformation are crucial for an ideal piezoresistive strain sensor. As shown in Fig. 4(a–d), the MWCNTs/PU foam can stand up to bending, 360° torsions, 180° folding, and even a compression deformation as high as 80% with excellent recoverability, indicating the prepared MWCNTs/PU composite foam possesses excellent compressibility, flexibility, and elasticity.
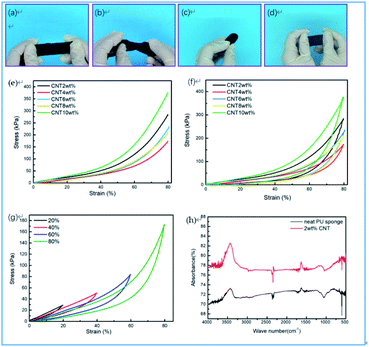 |
| | Fig. 4 (a–d) Optical photographs of bending, twisting, folding and compression of MWCNTs/PU composite foam (e) stress–strain curve of MWCNTs/PU foam with different concentrations (f) stress hysteresis curve of MWCNTs/PU foam with different concentrations (g) stress hysteresis of 4% MWCNTs/PU foam with compressed by 20%, 40%, 60% and 80% in sequence; (h) FTIR of original PU foam and 2% MWCNTs/PU foam. | |
The mechanical properties of MWCNTs/PU composite foams were further systematically tested, it was shown the softness of the MWCNTs/PU foams coated with different CNT concentrations in Fig. 4(e–g). It can be obtained from Fig. 4(e) that 4 wt% MWCNTs/PU composite foam is the softest (minimum stress at same strain value), and 10 wt% composite foam is the hardest. The compression modulus continues to rise with the increasing strain. When the strain is less than 30%, the stress is linearly flattened upwards. The 10 wt% MWCNTs/PU has the greatest compressive stress, reaching 50 kPa. When the strain increased from 30% to 80%, the compressive stress has an obvious turning process and the compression modulus rises sharply with the strain after reaching the turning point. Because, with increasing strain, the pores within the 3D sponge foam gradually disappear, resulting in a sharp increase in the modulus of elasticity. The maximum compressive stress reaches 172.6 kPa (4 wt%) and 373 kPa (10 wt%) at the strain of 80%. Hysteresis curves are shown in Fig. 4(f). The hysteresis of 2–10 wt% MWCNTs/PU composite foam were 21.59%, 17.82%, 18.39%, 23.38% and 21.66% respectively. 4 wt% MWCNTs/PU exhibited minimum hysteresis. Fig. 4(g) shows the stress–strain of the conductive sponge with a concentration of 4%, and three distinct phases can be clearly observed during loading. The first is the linear elastic region with up to 20% compressive strain, where the stress increases rapidly and linearly due to elastic bending of the pore skeleton. And the second is the plateau region between 20% and 60%, where the stress increases due to significant deformation of the pore skeleton. There is a slight increase, and the last one is a dense region above 60%, where the stress increases sharply due to the accumulation of the pore framework. In addition, it can also be seen that the sponge can almost fully recover when the compressive stress is unloaded, which indicates the outstanding elasticity of the conductive sponge at 4% concentration. Mechanical stability is an important performance index for conductive sponges, as it facilitates the long-term usage of piezoresistive sensors. The compression property of composite sponge could be effectively tuned through changing the MWCNTs loading to fulfil different application requirements.
As shown in Fig. 4(h), compared with neat PU foam, the FTIR characteristic peaks of MWCNTs/PU sponge exhibits an obvious increasing trend with increasing CNT loading at 3750–3250 cm−1, which are ascribed to the strong hydrogen bonding between the C![[double bond, length as m-dash]](https://www.rsc.org/images/entities/char_e001.gif) O and C–N groups of imide ring and the carboxyl group of CNT, the O–H, and N–H stretching vibrations at this time and the increase of OH hydrophilic group in the MWCNTs.35
O and C–N groups of imide ring and the carboxyl group of CNT, the O–H, and N–H stretching vibrations at this time and the increase of OH hydrophilic group in the MWCNTs.35
3.4. Pressure sensing performance
The sensing performance of MWCNTs/PU foam with different MWCNTs concentrations was tested. From Fig. 5(a), it can be seen that the relative resistivity of the conductive sponges with different CNT concentrations changes gradually after applying uniform pressure between 0 and 20 kPa. The sensitivity can be defined as the following equation:19where ΔR is the resistance change, R is the real-time resistance. R0 is the initial resistance and δP is the change in applied pressure. The sensing range can be divided into three regions, which are 1.5–2.75 kPa, 2.75–10 kPa, and 10–20 kPa, respectively. It can be calculated that the highest sensitivity for different MWCNTs concentrations of sponges was 41.28 kPa−1, 62.73 kPa−1, 52.08 kPa−1, 48.64 kPa−1, and 48.16 kPa−1 in that order when the pressure was 1.5 kPa. Fig. 5(b) shows the hysteresis of the sponges with different MWCNTs concentrations. Hysteresis was lowest at 6% with 3.53%, while the highest hysteresis of 19.69% corresponded to MWCNTs concentration of 10%. When the CNT concentration is 2%, 4%, and 8%, the difference in hysteresis was smaller, at 5.52%, 6.15%, and 3.88% respectively.
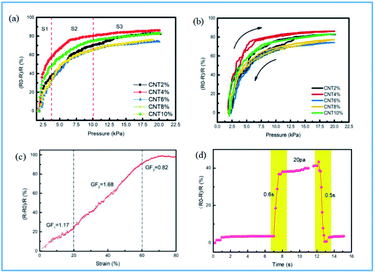 |
| | Fig. 5 Pressure sensing performance of different CNT-impregnated sponges (a) sensitivity curve (b) hysteresis curve (c) rate of change of resistance of the sponge with the amount of compressive deformation at 4% CNT concentration (d) response time. | |
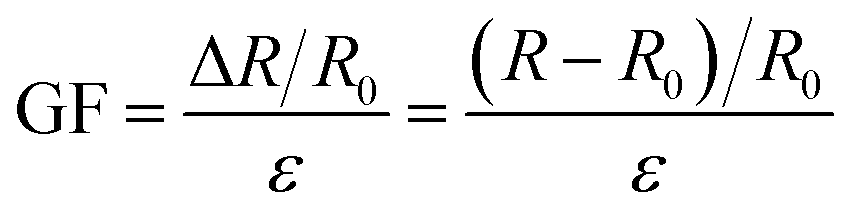
The sensing performance test results prove that when the CNT concentration was 4% conductive sponge sensitivity reached a maximum of 62.73 kPa−1 with a small hysteresis of 6.15%. So it is believed that the best sensing performance of the conductive sponge is achieved when the CNT concentration is 4%. And then a sponge with a CNT concentration of 4% was selected for further piezoresistive performance tests. Fig. 5(c) showed the rate of change of the resistance of MWCNTs/PU composite foam with a concentration of 4% as a function of the compressional shape variable. Here, GF is defined as the following equation:36
| |
 | (3) |
where
R0 and
R denote the initial resistance of the MWCNTs/PU foam and the real-time resistance of the MWCNTs/PU foam under compressive strain, respectively.
ε denotes the compressive strain. The graph shows that when the compressive deformation is less than 60%, the rate of change of resistance with the compressive deformation is approximately linear, and the GF only slightly decreases when the compressive deformation is between 60% and 80%, indicating that the piezoresistive sensor prepared with MWCNTs/PU conductive foam has a wide range, and the sensor has a high sensitivity when the compressive deformation is 0–80%.
Fig. 5(d) reflects the response time and recovery time of the MWCNTs/PU sensor prepared at the MWCNTS concentration of 4%, which is less than 0.6 s and 0.5 s, respectively.
3.5. Cycle stability
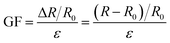
The conductive sponge can be used to prepare a compression strain sensor due to its sensitive response of resistance to compression in terms of resistance. The MWCNTs/PU foam with the CNT concentration of 4% was selected to prepare the piezoresistive sensor. The sponge was cut into squares of 20 mm × 20 mm × 10 mm, and then copper electrodes were bonded to both sides of the MWCNTs/PU foam using conductive silver paste. Fig. 6(a) shows the I–V curves of the sensor under different pressures. Different pressure weights were placed on the sensor and the corresponding current and voltage values were measured. The data fit a good linear relationship, indicating that the sensor has good electrical stability under constant pressure. Fig. 6(b) shows the change in the rate of change of resistance with different pressures applied, which means that the pressure sensor can respond sensitively to external stimuli. Fig. 6(c) shows the cyclic stability of the rate of change of resistance for the strain range of the piezoresistive sensor from 10% to 50%, from which it can be seen that the greater the compression range, the better the rate of change stability. Fig. 6(d) shows the cyclic compression of the sensor resistance rate of change for 2000 cycles under the application in the pressure range of 1–20 kPa. Nine of the cycles were randomly selected to show a stable change in the resistance change rate curve, indicating that the sensor has relatively good stability and can be reused for more than 2000 cycles.
 |
| | Fig. 6 Repeat stability of the sensor (a) I–V curve of the sensor at different pressures (b) resistance change rate curve of the sensor at gradually increasing pressures (c) repeat stability curve of the sensor at gradually increasing pressures (d) resistance change rate of the sensor at 2000 cycles of compression. | |
3.6. Applications
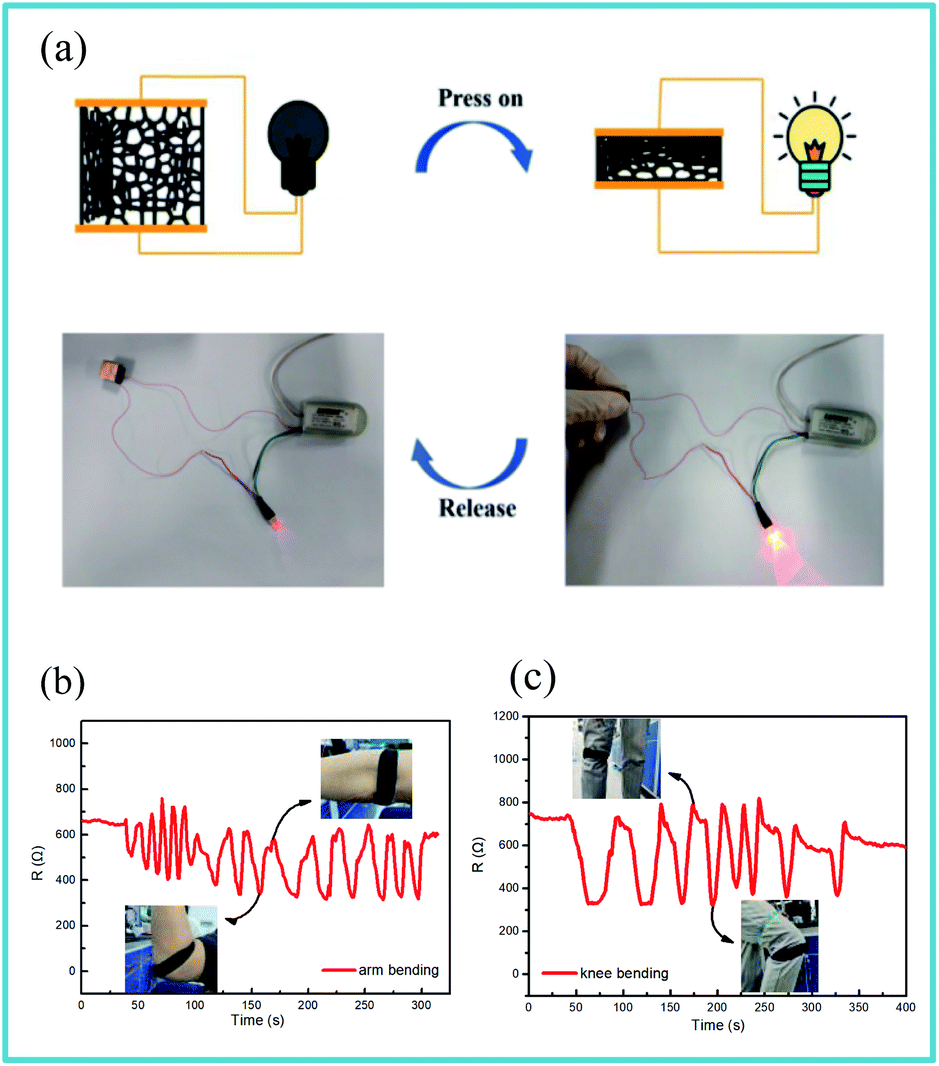
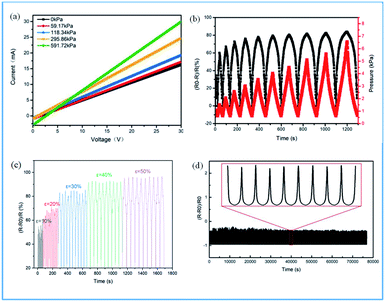
Based on the superior sensing performance exhibited by the prepared sensor, some application tests were carried out for the sensor. The MWCNTs/PU conductive foam was connected to a light-emitting diode (LED) and a battery to form a simple circuit. As shown in Fig. 7(a), the brightness of the LED light varies with the external compressive strain. The greater the compressive deformation, the brighter the LED becomes. This indicates that the MWCNTs/PU foam has great potential for sensing materials and can directly monitor the amount of compression applied directly through the brightness of the light. Fig. 7(b and c) shows that the sensor resistance shows real-time up and down fluctuations when the elbow and knee are flexed randomly, indicating that the prepared sensor can monitor human activities in real-time.
 |
| | Fig. 7 Sensor application diagram (a) LED light brightness with sensor compression state (b and c) sensor real-time monitoring of elbow and knee flexion. | |
The sensing mechanism of piezoresistive sensors is mainly based on the piezoresistive effect, which shows the resistance change of the prepared material under mechanical stress. As we all know, U = IR. In this study, a simple circuit was formed using a prepared sensor, an LED lamp and a battery with a constant voltage, and the resistance of the sensor was changed by applying stress to the hand, which changed the current through the LED light and achieved control of the brightness of the LED light. And when the sensor is applied to a person's arm and knee for bending tests, the stress applied to the sensor by the body's compression changes the resistance of the sensor. Therefore, whether the LED light brightness changes or the human action generates a signal, it is essentially the conductive sponge that produces resistance change due to stress, which more intuitively shows the sensitivity of the prepared piezoresistive sensor and indicates that the sensor has a broad application prospect in the field of wearable electronics.
4. Conclusions
In this paper, a lightweight, high sensitivity, and good cycling stability MWCNTs/PU foam was successfully prepared through the simple process. The PU foam was prepared with SEBS-g-MAH and polyether polyols and then dipped coating with the MWCNTs concentration of 2%, 4%, 6%, 8%, and 10% respectively. The results showed that the MWCNTs/PU foam with the MWCNTs concentration of 2% and 4% exhibited uniformly distributed on the foam surface, at the concentration of 8% had the best conductivity, while the MWCNTs concentration of 4% showed the softest mechanical properties and highest sensing properties. Due to the contact of adjacent cell walls, MWCNTs/PU composite foam exhibit excellent sensing performance under external pressure, including a wide sensing range (80% strain, 172.6 kPa), ultra-high sensitivity (62.37 kPa−1), fast response time (less than 0.6 s) and recovery time (less than 0.5 s), excellent long-term stability (2000 cycles). Finally, the MWCNTs/PU composite foam was assembled into sensors that enable real-time monitoring of various human motions (human knee and elbow bending movements), as well as monitoring the brightness of LED lights in response to the change in resistance. These excellent sensing properties and the simple preparation process of MWCNTs/PU composite sensor demonstrate its promising application in high-performance wearable pressure sensors.
Author contributions
Conceptualization, X.-J. W. and H. L.; methodology, X.-J. W., H. L.; software, H. L. and X.-J. W.; validation, X.-J. W., H. L. and Y.-M. J; formal analysis, H. L.; investigation, S.-Y. X.; resources, X.-J. W., H. L. L. C. and Y.-M. J.; data curation, X.-J. W. and H. L.; writing—original draft preparation, H. L. and X.-J. W.; writing—review and editing, X. N., T.-Y. W. and Y.·W.; visualization, X.-J. W. and H. L.; supervision, H. L., Y.-M. J. and L. C.; project administration, X.-J. W., H. L.; funding acquisition, X.-J. W., H. L. All authors have read and agreed to the published version of the manuscript.
Conflicts of interest
There are no conflicts to declare.
Acknowledgements
This research was funded by the National Key Research and Development Program of China (grant no. 2019YFF0302100) and the Natural Science Foundation of Tianjin (grant no. 18JCYBJC18500).
Notes and references
- J. Li, L. C. Fang, B. H. Sun, X. X. Li and S. H. Kang, J. Electrochem. Soc., 2020, 167, 22 Search PubMed.
- S. T. Han, H. Y. Peng, Q. J. Sun, S. Venkatesh, K. S. Chung, S. C. Lau, Y. Zhou and V. A. L. Roy, Adv. Mater., 2017, 29, 22 CrossRef PubMed.
- D. Lee, H. Lee, Y. Jeong, Y. Ahn, G. Nam and Y. Lee, Adv. Mater., 2016, 28, 9364–9368 CrossRef CAS PubMed.
- J. Cao, C. H. Lu, J. Zhuang, M. X. Liu, X. X. Zhang, Y. M. Yu and Q. C. Tao, Angew. Chem. Int. Ed., 2017, 56, 8795–8800 CrossRef CAS PubMed.
- A. Chortos, J. Liu and Z. A. Bao, Nat. Mater., 2016, 15, 937–950 CrossRef CAS PubMed.
- H. Liu, Q. M. Li, S. D. Zhang, R. Yin, X. H. Liu, Y. X. He, K. Dai, C. X. Shan, J. Guo, C. T. Liu, C. Y. Shen, X. J. Wang, N. Wang, Z. C. Wang, R. B. Wei and Z. H. Guo, J. Mater. Chem. C, 2018, 6, 12121–12141 RSC.
- H. Montazerian, A. Rashidi, A. Dalili, H. Najjaran, A. S. Milani and M. Hoorfar, Small, 2019, 15, 12 CrossRef PubMed.
- L. Q. Tao, K. N. Zhang, H. Tian, Y. Liu, D. Y. Wang, Y. Q. Chen, Y. Yang and T. L. Ren, ACS Nano, 2017, 11, 8790–8795 CrossRef CAS PubMed.
- S. N. Chang, J. Li, Y. He, H. Liu and B. W. Cheng, Sens. Actuators, A, 2019, 294, 45–53 CrossRef CAS.
- Y. Y. Bai, H. X. Li, S. J. Gan, Y. F. Li, H. Liu and L. Chen, Measurement, 2018, 122, 192–200 CrossRef.
- Z. Hanif, M. Z. Tariq, D. Choi, M. La and S. J. Park, Compos. Sci. Technol., 2021, 201, 8 CrossRef.
- Y. Cheng, Y. Lu, M. Xia, L. H. Piao, Q. Z. Liu, M. F. Li, Y. Zhou, K. Y. Jia, L. Y. Yang and D. Wang, Compos. Sci. Technol., 2021, 215, 9 CrossRef.
- L. P. Xie, P. Chen, S. Chen, K. Yu and H. B. Sun, Sensors, 2019, 19, 11 Search PubMed.
- Y. C. Meng, H. W. Li, K. J. Wu, S. N. Zhang and L. Q. Li, Polymers, 2018, 10, 13 CrossRef.
- Q. M. Yan, W. D. Xie, M. Zhou and H. Q. Fu, J. Mater. Chem. C, 2020, 8, 16603–16614 RSC.
- D. S. W. Gunasekara, Y. He, S. Fang, L. D. Zhao, H. Liu and L. Liu, Appl. Phys. A: Mater. Sci. Process., 2020, 126, 11 CrossRef.
- X. F. Zhang, T. T. Li, H. T. Ren, H. K. Peng, B. C. Shiu, Y. T. Wang, C. W. Lou and J. H. Lin, ACS Appl. Mater. Interfaces, 2020, 12, 55072–55082 CrossRef CAS PubMed.
- Y. W. Lu, Y. He, J. T. Qiao, X. Niu, X. J. Li, H. Liu and L. Liu, ACS Appl. Mater. Interfaces, 2020, 12, 55169–55180 CrossRef CAS PubMed.
- Y. He, L. D. Zhao, J. L. Zhang, L. Y. Liu, H. Liu and L. Liu, Compos. Sci. Technol., 2020, 200, 9 Search PubMed.
- R. Yin, S. Y. Yang, Q. M. Li, S. D. Zhang, H. Liu, J. Han, C. T. Liu and C. Y. Shen, Sci. Bull., 2020, 65, 899–908 CrossRef CAS.
- C. C. Vu and J. Kim, Sensors, 2020, 20, 12 Search PubMed.
- N. Khalili, X. Shen and H. E. Naguib, Soft Matter, 2018, 14, 6912–6920 RSC.
- Z. W. Han, L. P. Liu, J. Q. Zhang, Q. G. Han, K. J. Wang, H. L. Song, Z. Wang, Z. B. Jiao, S. C. Niu and L. Q. Ren, Nanoscale, 2018, 10, 15178–15186 RSC.
- T. T. Li, H. Y. Wang, S. Y. Huang, C. W. Lou and J. H. Lin, Composites, Part B, 2019, 172, 290–298 CrossRef CAS.
- S. D. Zhang, K. Sun, H. Liu, X. Y. Chen, Y. J. Zheng, X. Z. Shi, D. B. Zhang, L. W. Mi, C. T. Liu and C. Y. Shen, Chem. Eng. J., 2020, 387, 9 Search PubMed.
- Z. Sang, K. Ke and I. Manas-Zloczower, Small, 2019, 15, 9 CrossRef PubMed.
- J. Y. Huang, D. W. Li, M. Zhao, H. Z. Ke, A. Mensah, P. F. Lv, X. J. Tian and Q. F. Wei, Chem. Eng. J., 2019, 373, 1357–1366 CrossRef CAS.
- L. T. Huang, J. W. Chen, Y. Q. Xu, D. W. Hu, X. H. Cui, D. Shi and Y. T. Zhu, Appl. Surf. Sci., 2021, 548, 7 CrossRef.
- Y. H. Wu, H. Z. Liu, S. Chen, X. C. Dong, P. P. Wang, S. Q. Liu, Y. Lin, Y. Wei and L. Liu, ACS Appl. Mater. Interfaces, 2017, 9, 20098–20105 CrossRef CAS PubMed.
- H. Liu, L. L. Zhu, J. Xue, L. Hao, J. Li, Y. He and B. W. Cheng, J. Nanomater., 2016, 2016, 11 Search PubMed.
- X. D. Wu, Y. Y. Han, X. X. Zhang, Z. H. Zhou and C. H. Lu, Adv. Funct. Mater., 2016, 26, 6246–6256 CrossRef CAS.
- R. Danova, R. Olejnik, P. Slobodian and J. Matyas, Polymers, 2020, 12, 11 CrossRef PubMed.
- B. X. Zhang, Z. L. Hou, W. Yan, Q. L. Zhao and K. T. Zhan, Carbon, 2017, 125, 199–206 CrossRef CAS.
- T. T. Li, W. N. Dai, S. Y. Huang, H. Y. Wang, Q. Lin, J. H. Lin and C. W. Lou, Composites, Part B, 2020, 197, 17 Search PubMed.
- H. C. Wang, X. P. Liu, B. C. Zhang, J. B. Yang, Z. J. Zhang, R. R. Yue and Z. W. Wang, J. Alloys Compd., 2019, 786, 995–1004 CrossRef CAS.
- Y. C. Ding, T. Xu, O. Onyilagha, H. Fong and Z. T. Zhu, ACS Appl. Mater. Interfaces, 2019, 11, 6685–6704 CrossRef CAS.
Footnote |
| † These authors contributed equally to this work. |
|
| This journal is © The Royal Society of Chemistry 2022 |
Click here to see how this site uses Cookies. View our privacy policy here. 
 Open Access Article
 This Open Access Article is licensed under a Creative Commons Attribution-Non Commercial 3.0 Unported Licence
 abc,
Hui Li†a,
Tanyu Wanga,
Xin Niua,
Yu Wanga,
Siyi Xua,
Yaming Jiang*a,
Li Chen*a and
Hao Liu
abc,
Hui Li†a,
Tanyu Wanga,
Xin Niua,
Yu Wanga,
Siyi Xua,
Yaming Jiang*a,
Li Chen*a and
Hao Liu