
 Open Access Article
 This Open Access Article is licensed under a Creative Commons Attribution-Non Commercial 3.0 Unported Licence
A designed miniature sensor for the trace level detection and degradation studies of the toxic dye Rhodamine B†
Mazhar Hayata,
Afzal Shah *a,
Muhammad Kamran Hakeema,
Muhammad Irfana,
Abdul Haleem*a,
Sher Bahadar Khanb and
Iltaf Shahc
*a,
Muhammad Kamran Hakeema,
Muhammad Irfana,
Abdul Haleem*a,
Sher Bahadar Khanb and
Iltaf Shahc
aDepartment of Chemistry, Quaid-i-Azam University, Islamabad 45320, Pakistan. E-mail: afzals_qau@yahoo.com; haleem0300@gmail.com
bDepartment of Chemistry, King Abdulaziz University, P.O. Box 80203, Jeddah 21589, Saudi Arabia
cDepartment of Chemistry, College of Science, United Arab Emirates University, Al Ain P.O. Box 15551, United Arab Emirates
First published on 23rd May 2022
Abstract
The presence of organic pollutants in water and food samples is a risk for the environment. To avoid this hazard a variety of analytical tools are used for the detection of toxic organic contaminants. Herein we present a selective and sensitive electrochemical sensor based on amino group functionalized multi walled carbon nanotubes and carboxylic group functionalized multi walled carbon nanotubes (HOOC-fMWCNTs/NH2-fMWCNTs) as modifiers of the glassy carbon electrode for the detection of a toxic dye, Rhodamine B. The sensing ability of the designed sensor was examined by electrochemical impedance spectroscopy, cyclic voltammetry and square wave voltammetry. The synergistic effect of HOOC-fMWCNTs and NH2-fMWCNTs (layer by layer) led to enhanced electrocatalytic activity of the modified electrode surface for Rhodamine B detection. Under optimized conditions, the graph between concentration and peak current followed a linear trend in the concentration range of 0.1 nM to 0.05 μM. The limits of detection and quantification were found to be 57.4 pM and 191.3 pM respectively. The designed sensor was also used for probing the degradation of Rhodamine B. Sodium borohydride was found to degrade Rhodamine B in neutral media under ambient conditions. The kinetics of degradation followed first order kinetics. Rhodamine B degraded to the extent of more than 80% as revealed by electrochemical and spectrophotometric techniques. The developed method is promising for the treatment of dye contaminated wastewater. Moreover, it uses only a microliter volume of the sample for analysis.
1. Introduction
Global demand for industrial products has been increased due to rapid growth in the population and improvement in standards of living.1 The industrial revolution has led to serious environmental concerns as wastewater released from industry contains a variety of hazardous chemicals including dyes.2 Synthetic dyes are extensively used for making products more attractive for consumers.3 Rapid growth of the synthetic dye market is proving influential in meeting the demands of textile, food, printing, ink, tannery, paper, pharmaceutical and cosmetic industries. However, the chemicals used in production of these dyes are toxic and carcinogenic.4,5 Therefore, it is obligatory for the scientific community to explore ways for overcoming the issues related to industrial effluents loaded with dye contaminants.In food industries, dyes are used as additives of foodstuffs.6,7 Customers are more attracted to synthetic food colors as these are usually more brighter than natural food colors.8 Rhodamine B, a synthetic dye of xanthene class is used as a colorant in food industries. It imparts attractive color that makes the food items more appealing and appetizing for consumers. However, if dye effluents are released into fresh water bodies without any treatment, then they pose a serious threat to humans as well as aquatic lives.9 Rhodamine B causes skin, eye, and respiratory tract irritation. It also causes neurotoxicity in humans and animals.10 International Agency for Research on Cancer has banned Rhodamine B due to its carcinogenic effects on humans.11 Hence, detection of Rhodamine B in wastewater is important for the protection of human health.
Various methodologies such as spectrophotometry, chromatography, and fluorimetry have been used for the determination of Rhodamine B.12–14 However, electrochemical techniques are preferred due to their portability, rapid responsiveness, easy handling, high sensitivity, and potential selectivity.15,16 Electroanalytical techniques rely on the sensitivity of electrode surface for target analyte. The surface of electrode is modified by suitable modifiers for imparting sensitivity characteristics. For this purpose electrochemical sensors are prepared and implemented for the detection of minute concentration of analytes. As dye molecules are larger in size, so in solution they diffuse slowly to the electrode surface and generate small peak current in the voltammogram. So to avoid this issue we adopted a smart approach of getting intense signal of the dye by placing and drying a droplet of its solution over the surface of modified electrode. This approach has dual advantages as it requires only a microliter volume of the sample for analysis and gives intense signal due to close accessibility of the analyte to the electrode surface. With this approach dye is detected with a much smaller limit of detection. In the present work carbon nanotubes (CNTs) were used for sensor preparation. CNTs have appealing mechanical and electrical properties.17 They are divided into single-walled CNTs (SWCNTs) made up of single graphene sheet of a hollow cylindrical shape, and multi-walled CNTs (MWCNTs) which have many concentric graphene sheets. MWCNTs have gained significant attraction because of their unique properties such as large surface area, chemical stability, electrical conductivity, and higher mechanical strength. The surface of MWCNTs is hydrophobic and it can be made hydrophilic in nature by attaching water-soluble functionalities such as carboxyl or amino groups. The carboxyl derivatization improves dispersity by destroying the hydrogen bonding on the surface of the CNTs. Carboxyl functionality also improves the adsorption properties and catalytic activity of the material.18,19 Amino functionalization provides unique properties to MWCNTs. It can be attached to the surfaces of MWCNTs either covalently or non-covalently. The electron-donating properties of –NH2 group's cause to activate the surfaces of MWCNTs for a variety of applications.20 Due to appealing properties of functionalized multi walled carbon nanotubes we used HOOC-fMWCNTs and NH2-fMWCNTs as a recognition layer of the designed sensing platform for the detection of Rhodamine B.
Dyes due to their color prevent light penetration into the bottom of water bodies. This hampers photosynthesis under water. Consequently dissolved oxygen is reduced for water dwelling species. Therefore, for safeguarding the aquatic environment water must be purified by degrading dyes. Some dyes such as naphtha based, azo dyes, acidic, basic, and metal complex dyes are chemically stable and they demand special chemical reagents or photocatalysts for degradation.21–23 Rhodamine B is also a stable dye and the current work demonstrates the role of sodium borohydride in effectively degrading Rhodamine B via a mechanism following first order kinetics.
This work demonstrates a thorough electrochemical investigation of a novel and viable electrochemical sensing platform prepared via modifying GCE with HOOC-fMWCNTs and NH2-fMWCNTs for the sensitive detection of a legally prohibited food dye; Rhodamine B. The pronounced conductivity together with the high surface area of the electrode modifier significantly enhances the signal of the selected dye in comparison to bare GCE. The work is novel as the sensing platform containing dual functionalized MWCNTs has been employed for the first time to detect Rhodamine B dye with a limit of detection up to 57.4 pM. Literature survey reveals that such a lower limit of detection for larger molecular compounds like Rhodamine B has never been achieved previously. We imparted sensitivity characteristics in the electrode surface by adopting two smart approaches; one by modifying GCE with highly conducting electrode modifier and another by drop casting the dye over the designed modified electrode surface followed by immersing it in solution of supporting electrolyte of known concentration and pH. In this way two objectives were achieved, i.e., very small sample of analyte/dye became possible to be examined and dye molecules could approach closer to the electrode surface as witnessed by the robust current signal which is usually not obtained for large size molecules. This approach also resolves the orientation issue of the electroactive moiety. Improper orientation of oxidizable moiety hinders the closer accessibility of the molecule and consequently poor signal is obtained when dye solution is taken in electrochemical cell. Another novelty aspect of this work is that the designed sensing platform was used for following the kinetics of degradation of Rhodamine B. Hence, we believe that this efficient, environmentally benign and ultrasensitive sensing platform will spur other researchers on for further exploration in this area of dye contaminated wastewater treatment.
2. Experimental
2.1. Reagent and materials
All chemicals used in this work were of analytical grade. Rhodamine B (99% purity) was purchased from Sigma Aldrich. The MWCNTs, HOOC-fMWCNTs, and NH2-fMWCNTs were synthesized according to the literature reported methods.24–27 Dimethylformamide (DMF) purchased from Merck Germany was used to prepare a suspension of 1 mg mL−1 of MWCNTs and functionalized MWCNTS. Doubly distilled water was used to prepare the stock solution of Rhodamine B. Sodium dihydrogen phosphate (NaH2PO4), disodium hydrogen phosphate (Na2HPO4), HCl, NaOH, H2SO4, NaCl, KCl, NaBH4, CH3COOH, boric acid, and phosphoric acid were purchased from Beijing Chemicals Co., Ltd, China. Phosphate buffer (0.1 M) was prepared from 0.1 M Na2HPO4 and 0.1 M NaH2PO4. For pH setting 0.1 M HCl and 0.1 M NaOH solutions were used. Britton-Robinson buffer was prepared from a mixture of equal volumes of 0.1 M acetic acid, 0.1 M boric acid, and 0.1 M phosphoric acid and pH was adjusted by acidic (0.1 M HCl) and basic (0.1 M NaOH) solutions.2.2. Instrumentation
Metrohm Autolab running with software Nova 1.11 was used for all electrochemical experiments including square wave voltammetry, cyclic voltammetry, and electrochemical impedance spectroscopy. The pH of different solutions was checked with Mettler Toledo (model# FP20BIO KIT) pH meter. Shimadzu AUW 120D was used for mass measurements of the chemicals used in this work. For degradation study of Rhodamine B, Shimadzu UV-1700 spectrophotometer was used and absorption spectra of the samples were recorded in the range of 200–800 nm.2.3. Modification of the working electrode
Before performing each electrochemical measurement, the bare GCE was cleaned. To achieve a shiny surface, a 0.05 μm alumina-water slurry was used to rub the bare electrode on a rubbing pad. To remove any unwanted sticky particles from GCE, the surface was scraped in a digit 8 pattern. After polishing GCE, it was sonicated and rinsed completely by deionized water. After cleaning, the GCE was then exposed for getting reproducible cyclic voltammograms in the potential range of 0–1.4 V by recording several consecutive scans. For modification of the electrode a 5 μL droplet of the modifier was drop casted on the pre-cleaned glassy carbon electrode surface followed by drying.2.4. Experimental procedure
A layer by layer (LBL) strategy was adopted for sensor preparation.28 For LBL modification of the electrode surface first acid functionalized MWCNTs (HOOC-fMWCNTs) were immobilized from a 5 μL sample. Then a 10 μL of targeted analyte was also drop casted on the prepared sensor and dried each layer in a vacuum oven at 50 °C to get well absorbed recognition layer of the modifier and target analyte on the activated GCE surface. For comparison purposes, MWCNTs/GCE, NH2-fMWCNTs/GCE, and NH2-fMWCNTs/HOOC-fMWCNTs/GCE were also prepared separately by drop casting of 5 μL of each modifier followed by drying them in a vacuum oven. Before performing electrochemical testing each prepared GCE was carefully rinsed with doubly distilled water and phosphate buffer to remove all the loosely bound particles at the electrode surface. When these prepared electrodes were submerged in aqueous solution containing supporting electrolytes no decay of MWCNTs, and functionalized MWCNTs was observed. Therefore, the prepared working electrode was found to maintain their performance due to the firm adsorption of modifiers on the GCE surface.29 After getting this evidence of modifier immobilization a 10 μL of the targeted analyte (Rhodamine B) was drop casted on each prepared sensor followed by drying. Then a three electrode electrochemical cell containing 10 mL solvent was set for recording the voltammetric signature of Rhodamine B. The ability of the designed sensor to detect the Rhodamine B was judged from the comparison of the intensity of oxidation signal at the bare and modified GCE. The modifiers led to enhanced current signal of Rhodamine B. The nitrogen-containing group (NH2) exerts a negative charge on the surface of MWCNTs may preconcentrate the positively charged Rhodamine B dye at the electrode–electrolyte interface. Similarly the carboxyl group of acid functionalized MWCNTs can also preconcentrate the dye. Hence, HOOC-fMWCNTs/GCE, and NH2-fMWCNTs/GCE were found to be very promising platforms for the detection of Rhodamine B. After adsorption of dye molecules on the surface of modifier, the potential was scanned from negative to positive direction. The dye molecules on the surface of modifier oxidized at a specific potential and the corresponding signal appeared in the voltammograms. Bare glassy carbon electrode was also treated in the same way as modified GCE and the results demonstrated a significant enhancement in the sensing response of glassy carbon electrode after modification with modifier.3. Results and discussion
3.1. SEM and EDX characterization
To investigate the morphological and chemical composition of functionalized and non-functionalized MWCNTs, scanning electron microscopy (SEM) and energy dispersive X-ray (EDX) analysis were conducted. Fig. 1A shows the SEM image of bare glass carbon electrode and Fig. 1B indicate SEM micrographs with cylindrical cross section and smooth structures of the electrode modified with MWCNTs. The thread like configuration in Fig. 1C is attributed to functionalization of MWCNTs with NH2 thereby enhancing the interaction of MWCNTs. Fig. 1D shows the increased entanglement of NH2-fMWCNTs with rugged appearances due to addition of HOOC-MWCNTs causing an increase in defect generation. The simultaneous presence of HOOC-fMWCNTs and NH2-fMWCNTs leads to increase in surface area due to increase in disordered sites on modified GCE as compared to unmodified GCE, MWCNTs/GCE and NH2-fMWCNTs/GCE. | ||
| Fig. 1 SEM micrographs and EDX spectra of (A) Bare GCE (B & E) MWCNTs/GCE (C & F) NH2-fMWCNTs/GCE (D & G) HOOC-fMWCNTs/NH2-fMWCNTs/GCE. | ||
EDX analysis (Fig. 1E and F) reveals the chemical composition of modified electrodes and the obtained spectra confirm the results of SEM micrographs. EDX measurements provide deeper insights into the functionalization of the MWCNTs by indicating the main elements. Fig. 1E reveals the presence of only carbon in the MWCNTs, whereas the presence of nitrogen along with carbon in Fig. 1F is indicative of NH2-fMWCNTs. EDX spectrum in Fig. 1G represents simultaneous presence of HOOC-fMWCNTs and NH2-fMWCNTs as evidenced by the signals corresponding to oxygen along with carbon and nitrogen.
3.2. Electrochemical characterization
Effective surface area of the sensing platform plays an important role in enhancing the electrochemical response. To evaluate the active surface area of the electrode, cyclic voltammetry was carried out in a 5 mM K3[Fe(CN)6] redox probe and 0.1 M KCl solution as a supporting electrolyte. From the scan rate dependent cyclic voltammetric peak current response of [Fe(CN)6]3−/4− the active working area of the GC electrodes was determined using Randles–Sevcik equation (Ip = 2.69 × 10⁵n3/2D1/2ν1/2AC).30 The calculated active surface areas of working electrode are listed in Table S1.† The GCE fabricated with NH2-fMWCNTs and HOOC-fMWCNTs (layer by layer) exhibits 5.5 times more electroactive surface area as compared to bare GCE. It means the designed sensor i.e. HOOC-fMWCNTs/NH2-fMWCNTs/GCE provides more active sites for ions of [Fe(CN)6]3−/4− as compared to the bare and other modified electrodes prepared in this work. Therefore, the developed sensors significantly enhance the signal of K3[Fe(CN)6] redox probe as shown in Fig. 2A.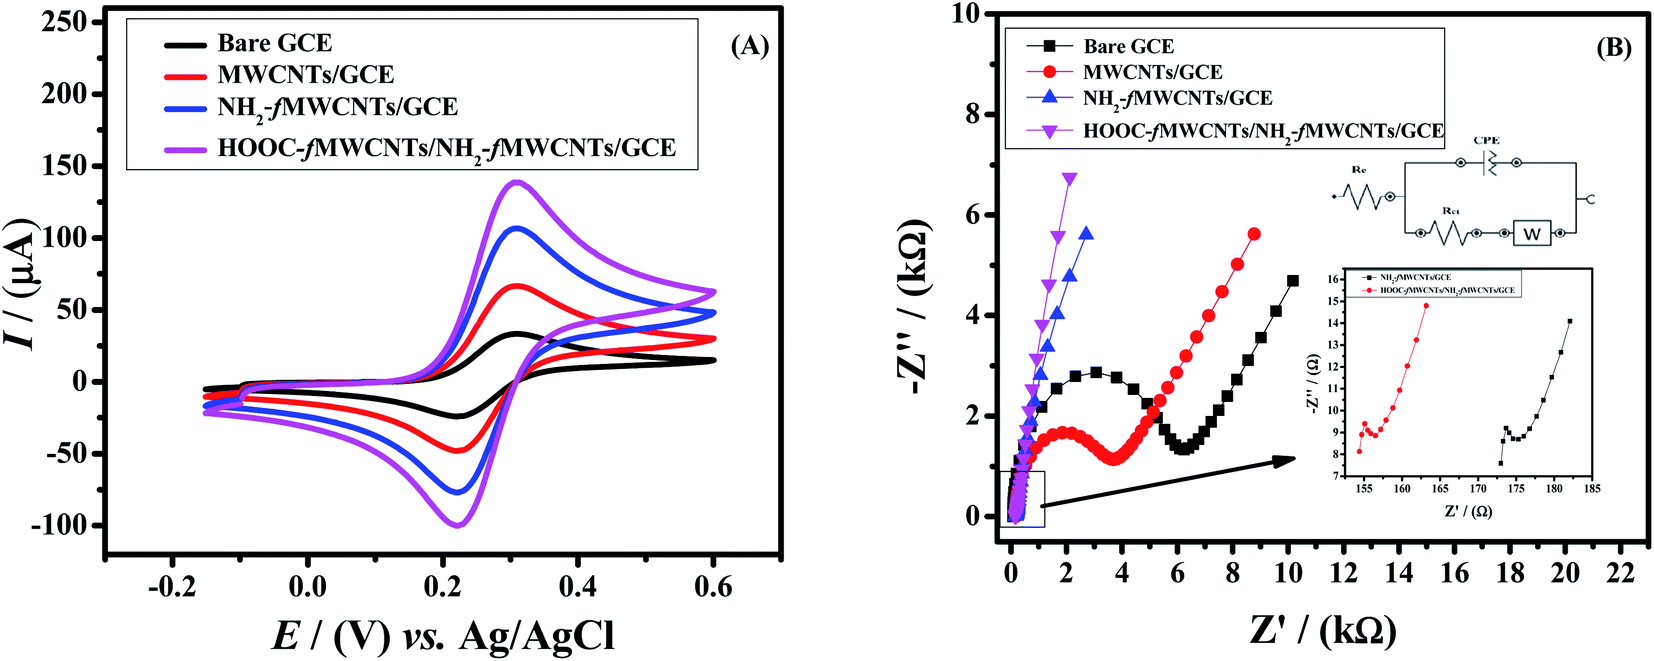 | ||
| Fig. 2 (A) Comparative cyclic voltammograms obtained at the bare and modified GCEs in 5 mM K3[Fe(CN)6] and 0.1 M KCl solution at a scan rate of 100 mV s−1 from potential −0.15 V to 0.6 V. (B) Nyquist plot for bare and modified GCEs in 5 mM K3[Fe(CN)6] and 0.1 M KCl solution by applying 10 mV amplitude with frequency scan from 0.1 Hz to 100 kHz. | ||
Electron transfer mechanism is an important parameter to check the effectiveness of the designed sensor. For this purpose, EIS was performed to estimate the charge transfer resistance of bare and modified electrodes by applying 10 mV amplitude with frequency scan from 0.1 Hz to 100 kHz. Therefore, charge transfer resistance (Rct) was evaluated for bare GCE, MWCNTs/GCE, NH2-fMWCNT/GCE and HOOC-fMWCNTs/NH2-fMWCNTs/GCE by fitting the data in Randle's equivalent circuit.31 Fig. 2B depicts the EIS response of the bare and modified working electrodes as Nyquist plots. The straight line at low frequency region in EIS spectrum is attributable to the mass transfer diffusional process. While the diameter of the semicircle at the high frequency region gives information about charge transfer resistance (Rct). The kinetics of electron transfer of redox reaction is controlled by Rct at the surface of electrode.32 The bare GCE exhibited higher Rct (5493.7 Ω) than the electrode modified with HOOC-fMWCNTs and NH2-fMWCNTs/GCE (159 Ω) indicating faster electronic transport through the layer-by-layer modified electrode (HOOC-fMWCNTs/NH2-fMWCNTs/GCE) as shown in Fig. 2B. The observed Rcts for MWCNTs and NH2-fMWCNTs were 3070.5 Ω and 178 Ω respectively. The obtained parameters from the Nyquist plot are listed in the Table S2.† The EIS results also indicate the successful fabrication of the designed sensor.
3.3. Voltammetric analysis of the targeted analyte
To investigate the electrochemical response of Rhodamine B at the developed sensor square wave voltammetry was performed. It is a sensitive and rapid electroanalytical technique for recording analyte signals with high resolution. Therefore, square wave voltammetric signatures of 20 μM Rhodamine B were recorded in the potential domain of 0.5 V to 1.3 V keeping deposition time of 5 s and accumulation potential of −0.1 V. The sensor demonstrated enhanced electrochemical response for RhB oxidation than the bare GCE. Fig. 3 reveals that RhB oxidizes at 0.89 V. By using bare GCE the current response was 10 μA. At MWCNTs/GCE, the current response reached to 13 μA. The peak current response was further enhanced to 16 μA when GCE was modified with amino group functionalized MWCNTs. Upon modification of GCE with HOOC-fMWCNTs, the peak current of RhB jumped to 19 μA. By preparing the sensor with carboxylic (1st layer) and amino (2nd layer) functionalized MWCNTs i.e. (NH2-fMWCNTs/HOOC-fMWCNTs/GCE) the current enhanced up to 21.2 μA. While preparing the sensor with amino (1st layer) and carboxylic (2nd layer) functionalized MWCNTs i.e. (HOOC-fMWCNTs/NH2-fMWCNTs/GCE) the current enhanced up to 26.5 μA. The significant enhancement in peak current using HOOC-fMWCNTs/NH2-fMWCNTs as a working electrode, can be related to the well dispersed HOOC-fMWCNTs that provides adsorption sites for Rhodamine B molecules and the synergistic effect of acid and base functionalized MWCNTs that remarkably enhance the negative charge on MWCNTs for preconcentrating positively charged RhB molecules. which in turns increased the rate of electron transfer.32 Therefore, among the designed electrodes, the most conducting platform (HOOC-fMWCNTs/NH2-fMWCNTs/GCE) was selected for the sensitive detection of RhB as it facilitated the electrochemical oxidation response of the dye.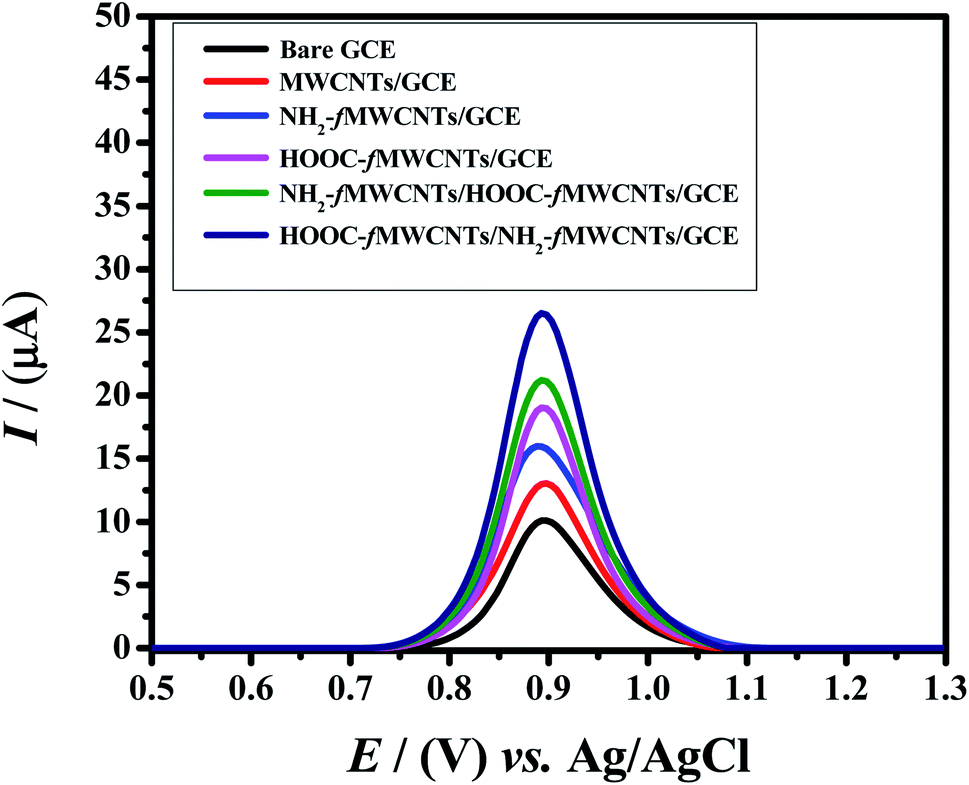 | ||
| Fig. 3 Square wave voltammograms of 20 μM RhB on bare GCE and modified GCEs at a scan rate of 125 mV s−1 in 0.1 M phosphate buffer (pH = 6.0). | ||
3.4. Effect of scan rate
Electrochemical studies were carried out by using HOOC-fMWCNTs/NH2-fMWCNTs modified GCE to investigate the influence of scan rate on the oxidation peak current values of Rhodamine B. The relationship between peak current and scan rate can assist in determining the nature of the electrochemical reactions whether these are adsorptive or diffusive in nature.31,33 With increase in scan rate, the intensity of peak current enhanced as expected. The cyclic voltammograms with increasing scan rates (25 mV s−1 to 150 mV s−1) are shown in Fig. 4A.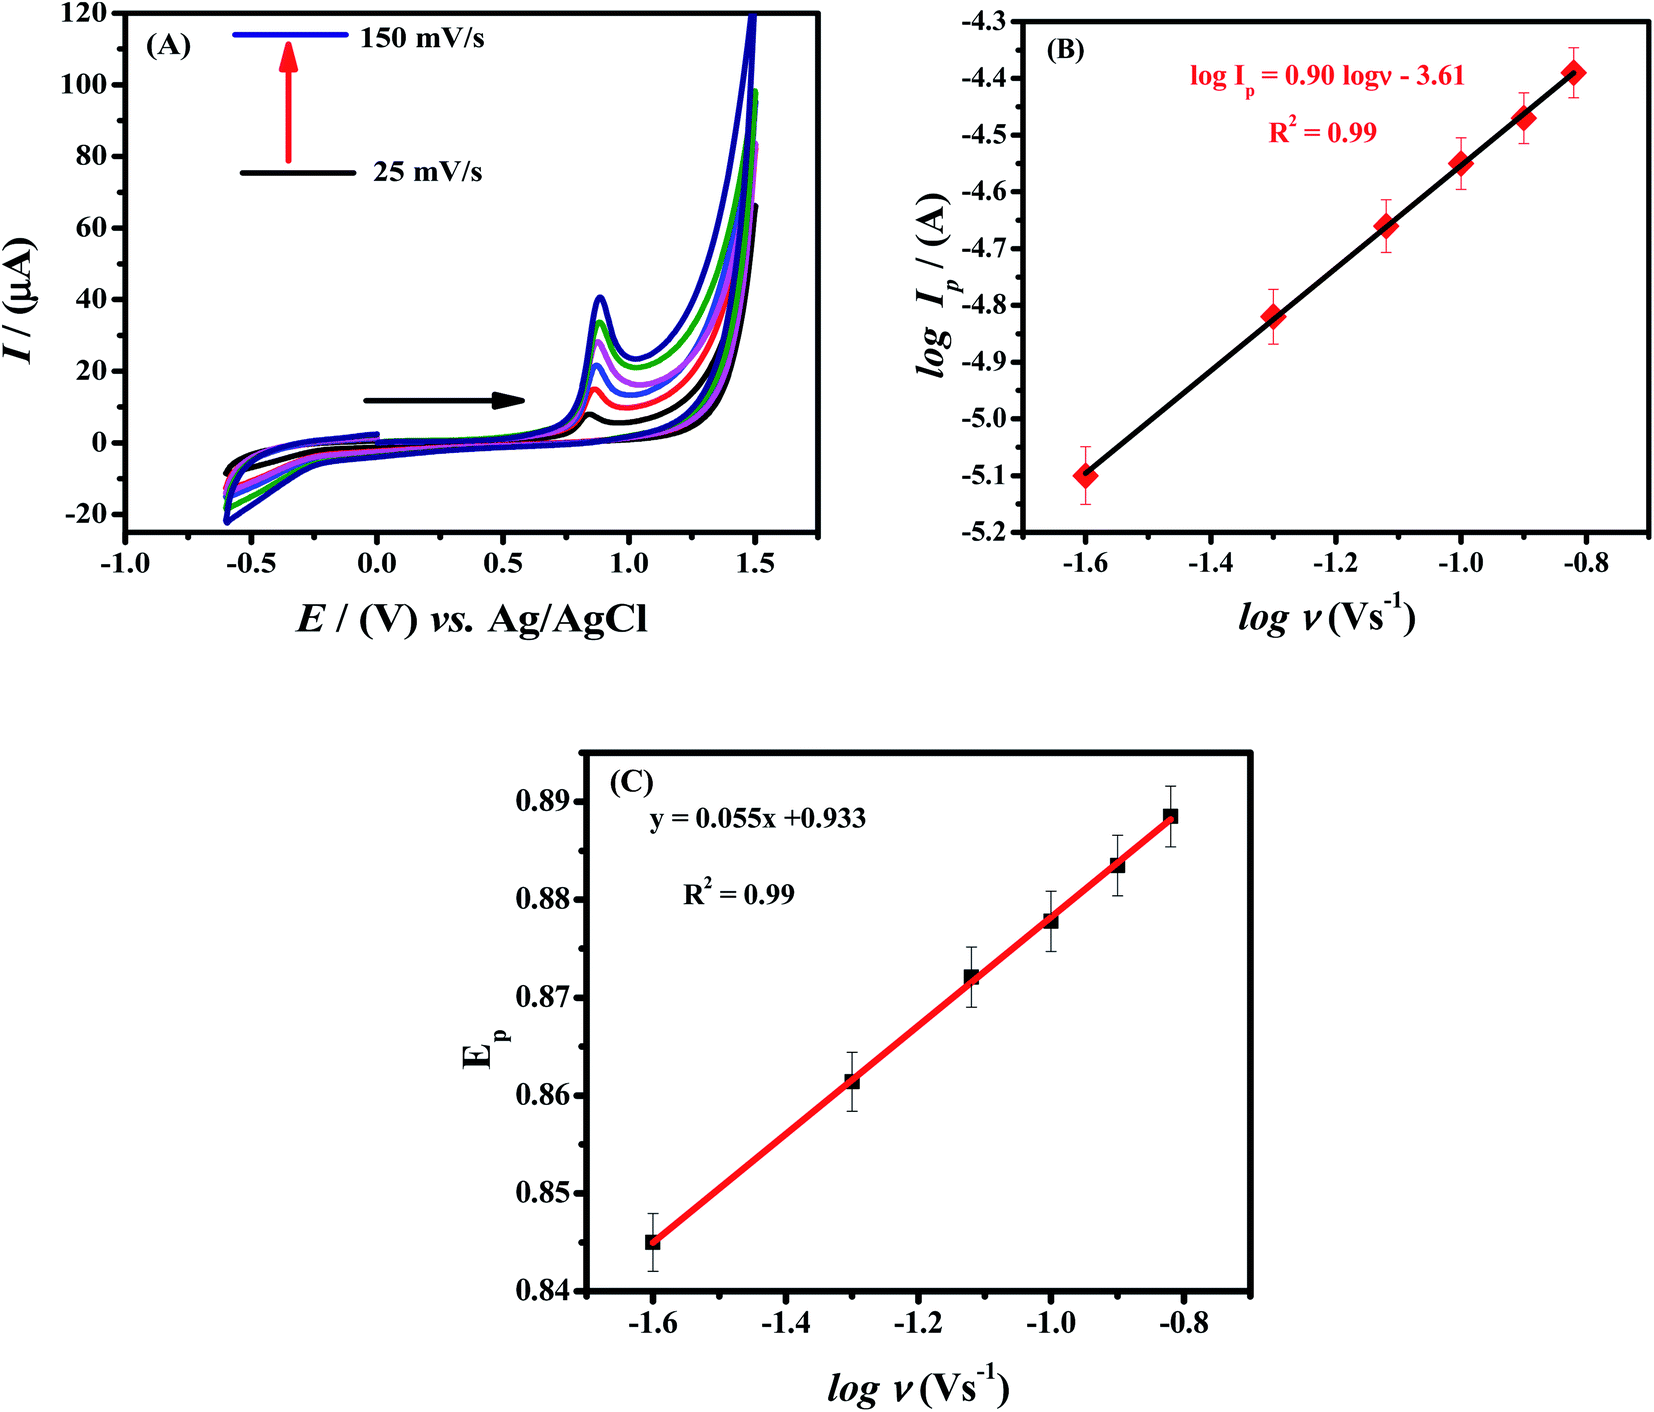 | ||
| Fig. 4 (A) CVs of 20 μM RhB at various scan rates in phosphate buffer as supporting electrolyte using HOOC-fMWCNTs/NH2-fMWCNTs/GCE. (B) Plotted graph between log of peak current vs. log of scan rate. (C) Plot of peak potential of RhB vs. log of scan rate. | ||
Ip is proportional to ν in a surface-controlled reaction, while a linear plot is obtained between Ip and ν1/2 in a diffusion-controlled reaction. Plots of RhB are shown in Fig. S1A and B.† In comparison to Fig. S1B,† Fig. S1A† shows more linearity as obvious from R2 value of 0.99, indicating a surface-controlled process. For the confirmation that the process is surface or diffusion controlled, a graph was plotted between log![[thin space (1/6-em)]](https://www.rsc.org/images/entities/char_2009.gif) Ip vs. logν. According to literature review the process should be diffusion controlled if the slope of log of peak current vs. log of scan rate is equal to 0.5 and if slope is equal to 1 the process should be adsorption controlled.34,35 So, the process seems to be surface controlled as the slope value is closer 1 (slope = 0.90) as obvious from linear fitting of the graph between log of peak current vs. log of scan rate (Fig. 4B). According to Laviron equation, a linear positive shift between Ep and logν is suggestive of the irreversibility of RhB oxidation36 (see Fig. 4C).
Ip vs. logν. According to literature review the process should be diffusion controlled if the slope of log of peak current vs. log of scan rate is equal to 0.5 and if slope is equal to 1 the process should be adsorption controlled.34,35 So, the process seems to be surface controlled as the slope value is closer 1 (slope = 0.90) as obvious from linear fitting of the graph between log of peak current vs. log of scan rate (Fig. 4B). According to Laviron equation, a linear positive shift between Ep and logν is suggestive of the irreversibility of RhB oxidation36 (see Fig. 4C).
3.5. Optimization of experimental parameters
As the response of different functional groups is pH dependent, so by optimizing this parameter phosphate buffer was used and its pH was varied from 3 to 12. The highest current response of Rhodamine B was noticed in solution of pH 7.0. Therefore pH 7.0 was used in further investigations. The oxidation peak of analyte was shifted linearly towards lower potentials by increasing the pH of the supporting electrolyte, which indicates protons coupled electron transfer process as shown in Fig. 5A. The slope with a value of 57 mV pH−1 was obtained by plotting a graph between peak potential and pH as shown in Fig. 5B. This slope which is very close to Nernstian slope (59 mV pH−1)37 indicates that equal number of electrons and protons are involved in the oxidation of Rhodamine B. The inflection point of the plot represents pKa i.e., acid–base dissociation constant. At this pH protonation–deprotonation equilibrium exists as at pH higher than pKa, electron transfer occurs without proton accompaniment.
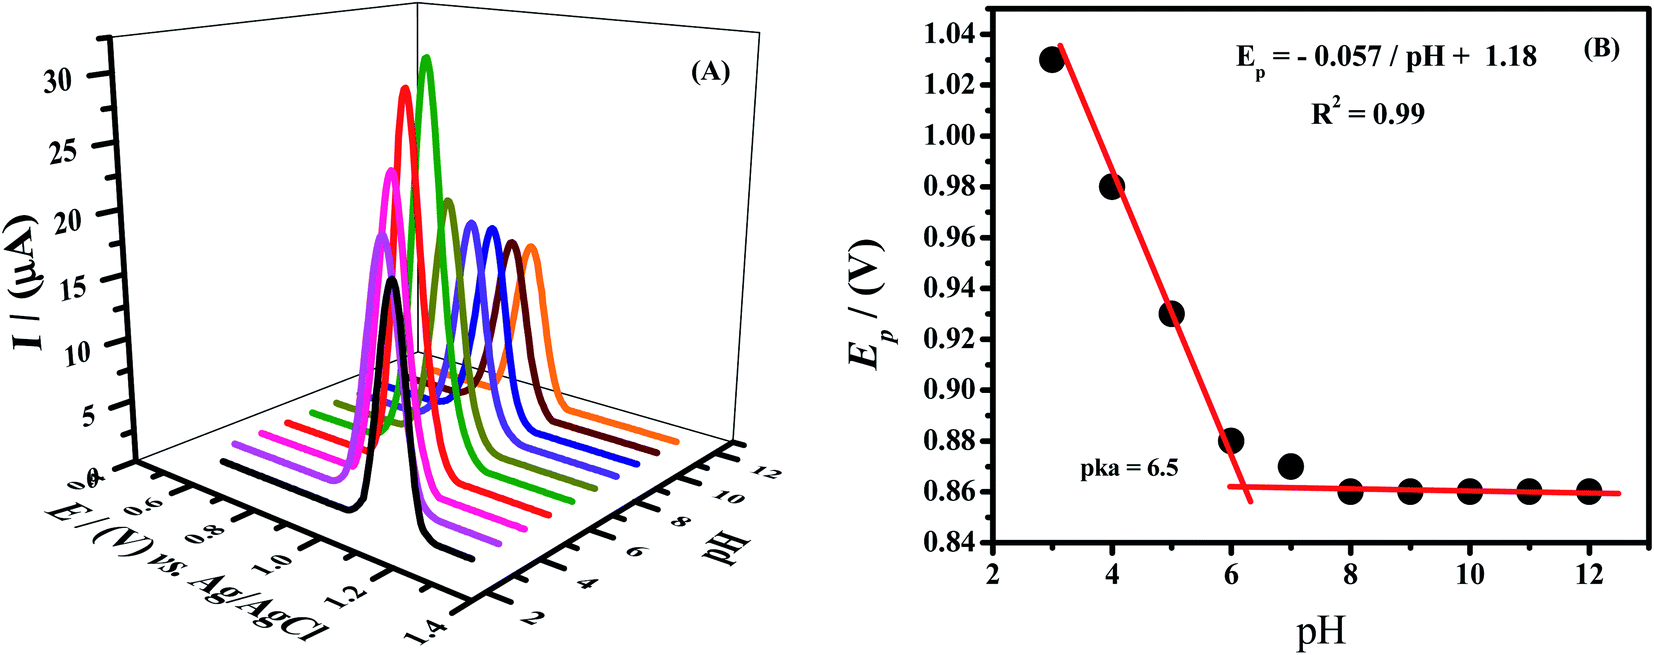 | ||
| Fig. 5 (A) Effect of pH of 0.1 M phosphate buffer on the SWV peak current of RhB (B) plot of Ep vs. varied pH of phosphate buffer. | ||
The volume of electrode modifier also influences the current intensity of Rhodamine B. The peak current was found to increase till 5 μL of NH2-fMWCNTs and 7 μL of HOOC-fMWCNTs modifier's volume. There is no more increase in the peak height of Rhodamine B by further increasing the volume of the modifiers. It can be explained that modifier molecules completely saturate the active surface of GCE at 5 μL:7 μL ratio of modifiers volume. The corresponding voltammograms are shown in Fig. S3A† and plot between peak current and volume of modifiers can be seen in Fig. S3B.†
The influence of deposition potential and time on the intensity of oxidation peak current of RhB was also examined. These experiments were conducted to check at which potential and time the maximum molecules get oriented, as dye molecules are bigger in size and they need time to properly orient their electropores for getting oxidized. The positive impact of deposition potential on anodic peak intensity was noticed until −0.2 V as shown in Fig. S4A and B.† At this potential, maximum molecules of the dye are speculated to orient their electroactive moieties to the surface of the developed sensor (HOOC-fMWCNTs/NH2-fMWCNTs) for oxidation, and saturation of the oriented molecules is approached as evidenced from the declination in the peak current value on further decreasing (0.5 to −0.4) the applied potential. It was found that as the deposition time of Rhodamine B on the electrode surface is increased, peak intensity is also increased, till 100 seconds as shown in Fig. S5A and B.† With further deposition time, no more preconcentration occurred possibly due to no more availability of active sites for oriented molecules, hence decay in peak current response was noticed with further prolonging the accumulation time. Therefore, −0.2 V and 100 seconds were selected as optimal deposition potential and time respectively.
3.6. Analytical characterization
In order to evaluate the linear concentration range and limit of detection value of the Rhodamine B at the designed sensor, SW voltammetric technique was employed under the above-optimized conditions such as 0.1 M phosphate buffer (pH = 7.0), volume of modifiers (5 μL:7 μL), −0.2 V deposition potential and 100 s deposition time. Fig. 6A demonstrates that the peak current signals enhancement depends on the concentration of the target analyte i.e., Rhodamine B. A linear calibration curve was obtained by plotting oxidation peak current intensity as a function of concentration of Rhodamine B in the range of 0.1 nM to 0.05 μM (Fig. 6B). The limit of detection (LOD) is the minimum concentration of the analyte that could be detected by some analytical tools. The detection and quantification limits were calculated according to IUPAC guidelines i.e., 3σ/m and 10σ/m respectively.38 Where m is the slope of the linear calibration plot (Fig. 6B) and σ is the standard deviation of the blank solution. Based on peak current values of the blank solution (phosphate buffer pH = 7.0), standard deviation was calculated by using GCE modified with HOOC-fMWCNTs/NH2-fMWCNTs/GCE. The limits of detection and quantification of Rhodamine B were found to be 57.4 pM and 191.3 pM respectively. Table 1 presents a comparison of the RhB sensing performance of our designed sensor with reported sensors.39–50 Hence, GCE modified with functionalized multi-walled carbon nanotubes is a promising tool for the trace level detection of Rhodamine B dye.
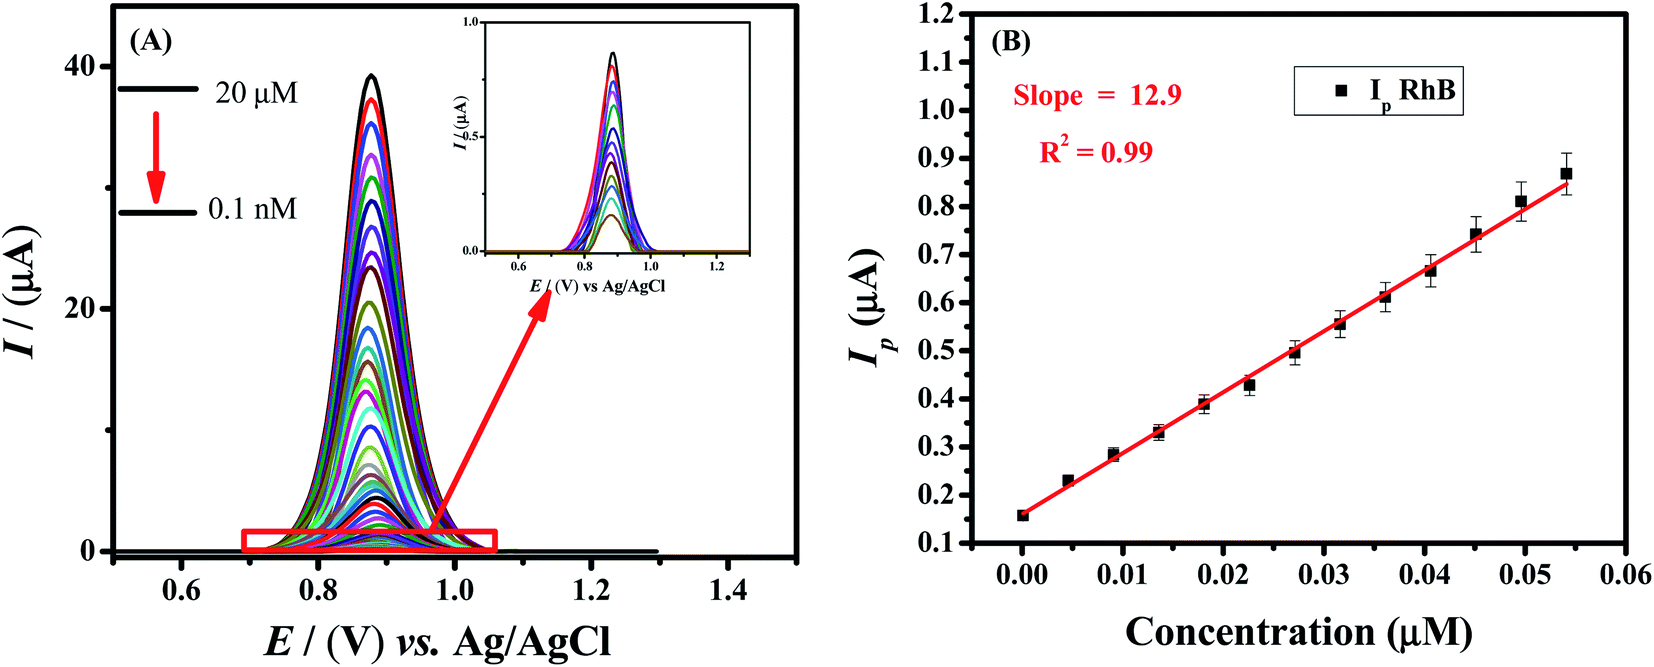 | ||
| Fig. 6 (A) SW voltammograms of varying concentrations of Rhodamine B by using HOOC-fMWCNTS/NH2-fMWCNTS/GCE in phosphate buffer of pH = 7.0, keeping deposition potential and time of −0.2 V and 100 s respectively at scan rate of 125 mV s−1 using GCE modified with modifiers volume ratios 5 μL:7 μL. (B) Plot of Ip vs. target analyte concentration. | ||
| Technique | Electrode substrate | LOD/nM | Ref. |
|---|---|---|---|
| DPV | ZIF-67/rGO | 3.7 | 39 |
| Potentiometric techniques | (PGA) with molecularly imprinted polymers | 8910 | 40 |
| DPV | Surface polymers on multiwalled carbon nanotubes | 3.0 | 41 |
| DPV | MWCNT/CPE | 20.0 | 42 |
| Surface enhanced Raman scattering (SERS) | Silver nano-cube | 1.0 | 43 |
| DPV | MWCNTs-COOH/IL/PGE | 1.0 | 44 |
| DPV | Exfoliated graphene-modified electrode | 1.5 | 45 |
| DPV | β-CD-AuNPs/HCNS/GCE | 2.0 | 46 |
| DPV | Neodymium-based metal–organic framework (Nd-MOF) | 3.6 | 47 |
| DPV | Bare GCE | 6.1 | 48 |
| DPV | Cobalt–nickel oxide/GCE | 5.3 | 49 |
| DPV | Cu@carbon sphere/GCE | 100 | 50 |
| SWV | HOOC-fMWCNTs/NH2-fMWCNTs/GCE | 0.057 | This work |
3.7. Validity of the sensor
In electrochemical experiments, reproducibility and repeatability is a key component of precision. The reproducibility was tested by preparing four different working electrodes with the same sensing material (HOOC-fMWCNTs/NH2-fMWCNTs), and the oxidation currents of RhB were found to be almost identical for all prepared electrodes, indicating excellent reproducibility with RSD of 0.67% as shown in Fig. S6.† For investigating the repeatability of the sensor in phosphate buffer solution replicate voltammograms were obtained. For this purpose, one electrode was prepared with HOOC-fMWCNTs/NH2-fMWCNTs as a sensing platform and several times repeated its preparation and analysis for RhB sensing. It was noted that the peak current response does not change up to 24 hours. It shows that the developed sensor has inter-day stability and repeatability with 1.04% RSD as obvious from observation of Fig. S6.†3.8. Interference effect
Interfering agents commonly present in water samples may reduce the sensing ability of the sensor's performance for a particular analyte.51 Therefore, based on this consideration voltammetric signatures of the targeted analyte were recorded under optimized conditions in the presence of other dyes and inorganic metal ions which were individually spiked in the solution of analyte in supporting electrolyte (phosphate buffer) of pH 7.0. The electrochemical signals of RhB were almost unchanged with less than 3% RSD in the presence of 10 μM organic dyes such as methylene blue (MB), metanil yellow (MY), orange (II), nile blue sulfate (NBS), methyl orange (MO), and 2 mM concentration of inorganic metal ions such as K+, Sr2+, Mg2+, Ca2+, Na+, Zn2+ as shown in Fig. S7A and B.† These results manifest the anti-interfering ability of the sensor and highlight its applicability for real sample analysis. In fact the precision and applicability of the designed senor for RhB detection was examined in real samples such as tap water, industrial wastewater, and fruit juice by using the standard addition methodology.52 Initially a 2.0 mL of fruit juice sample was diluted with 10.0 mL of 0.1 M phosphate buffer of pH 7.0, while water samples were used as such. The SWVs were first used to determine the initial levels of RhB in real matrixes while no contents of dye were found in real samples. After that a specific amount of dye was spiked in real matrixes and the recovered amount was then measured using calibration plots. Each measurement was repeated three times. The Ip values of real samples corresponded to the peak current values shown in Fig. 6A. The percentages of recoveries are listed in Table 2. The average percentage recoveries ranged from 97.5% to 99.25% with RSD in the range of 2.2–3.4%. Hence, the reliability, specificity, and validity of the HOOC-fMWCNTs/NH2-fMWCNTs/GCE for RhB analysis are confirmed from these findings.| Dye | Sample | Initial amount (μM) | Spiked amount (μM) | Found (n = 3) (μM) | RSD (%) | Recovery (%) |
|---|---|---|---|---|---|---|
| Rhodamine B | Tap water | 0.0 | 4 | 3.97 | 2.2 | 99.25 |
| Sample 1 | ||||||
| Tap water | 0.0 | 4 | 3.95 | 2.3 | 98.75 | |
| Sample 2 | ||||||
| Industrial wastewater | 0.0 | 4 | 3.92 | 2.8 | 98 | |
| Sample 1 | ||||||
| Industrial wastewater | 0.001 | 4 | 3.95 | 3.1 | 98.7 | |
| Sample 2 | Expected (4.001) | |||||
| Fruit juice | 0.005 | 4 | 3.91 | 3.4 | 97.6 | |
| Sample 1 | Expected (4.005) | |||||
| Fruit juice | 0.0 | 4 | 3.90 | 3.2 | 97.5 | |
| Sample 2 |
3.9. Degradation monitoring of Rhodamine B at the designed sensor
Rhodamine B is used as a colorant for food and cloth industries and has a bad impact on aquatic species. To protect aquatic life, dye contaminants must be processed before release of effluents to fresh water bodies. A number of methods are employed for the removal of dyes from wastewater. Among these methods photodegradation is particularly implemented but Rhodamine B shows high resistance to photocatalytic degradation. Therefore, to make it degradable, we used sodium borohydride (NaBH4) as a reducing agent. In the present work, 40 mL of 10 μM Rhodamine B solution was used and added 10 mg of sodium borohydride under stirring condition. Samples were taken out of it at different time intervals and drop-casted on the GCE electrode modified with HOOC-fMWCNTs/NH2-fMWCNTs. The electrode was then dried and SWV technique was used to study the degradation of the dye by recording the corresponding voltammograms of the respective samples collected from solution of Rhodamine B and sodium borohydride. As time passed on, the concentration of the dye in the sample decreased as evidenced from the decrease in peak current of the solution (Fig. 7A) and color modification/fading (Fig. 7B). The percentage degradation was calculated by the following formula:
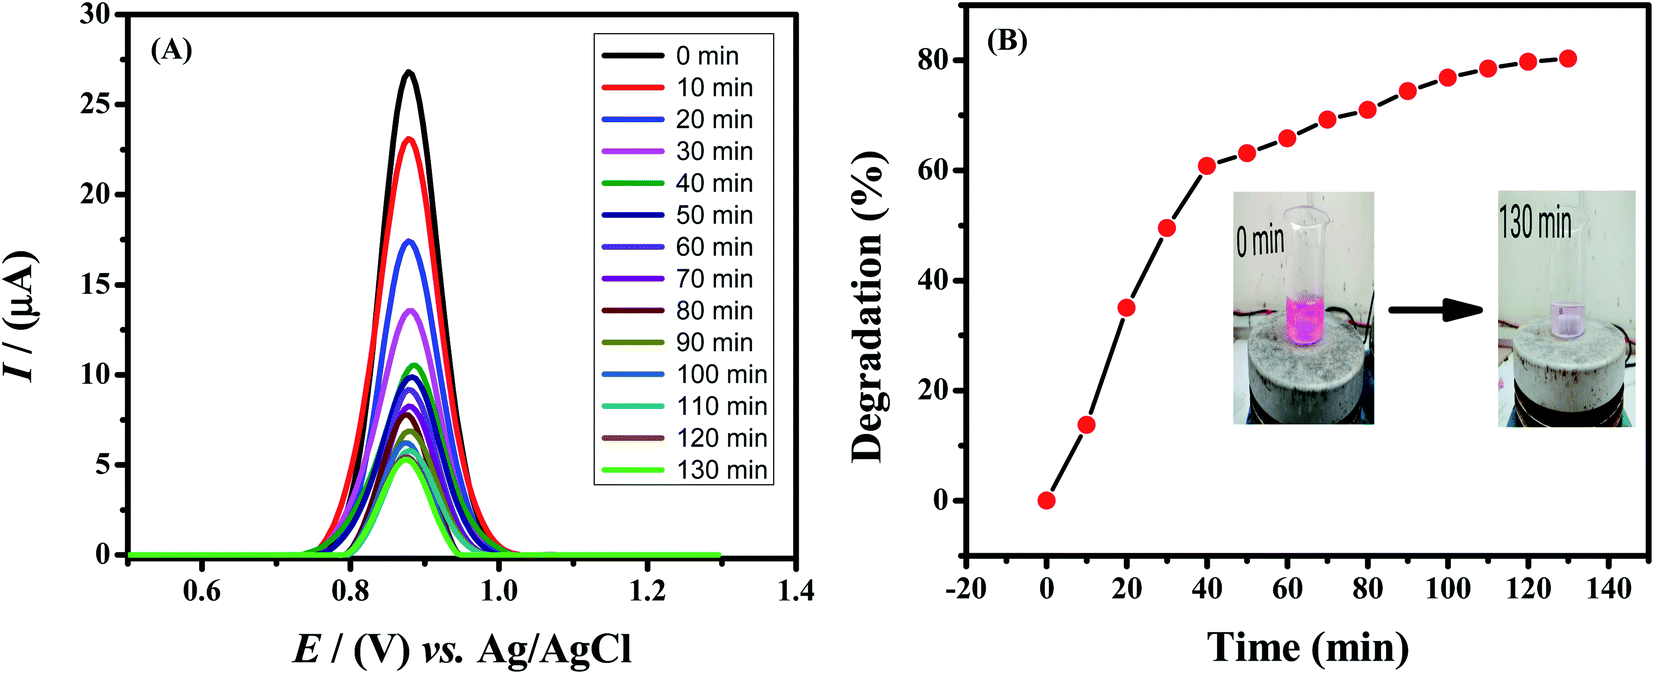 | ||
| Fig. 7 (A) Square wave voltammograms of 10 μM Rhodamine B solution, recorded at different time intervals in the presence of sodium borohydride by using HOOC-fMWCNTs/NH2-fMWCNTs/GCE under optimized conditions. (B) Plot of percent degradation of Rhodamine B with illumination time. | ||
Rhodamine B was found to degrade up to 81.3% in 130 min as shown in Fig. 7B. The degradation followed first order kinetics. Rate constant was calculated by plotting a graph between ln[(Ip)t/(Ip)o] vs. time. The rate constant was calculated from the slope of the graph and the rate of degradation was faster initially up to 40 minutes and then it became slower as shown in Fig. S8A.† The extent of reaction can be seen in Fig. S8B.†
3.10. Spectrophotometric study of the degradation of Rhodamine B
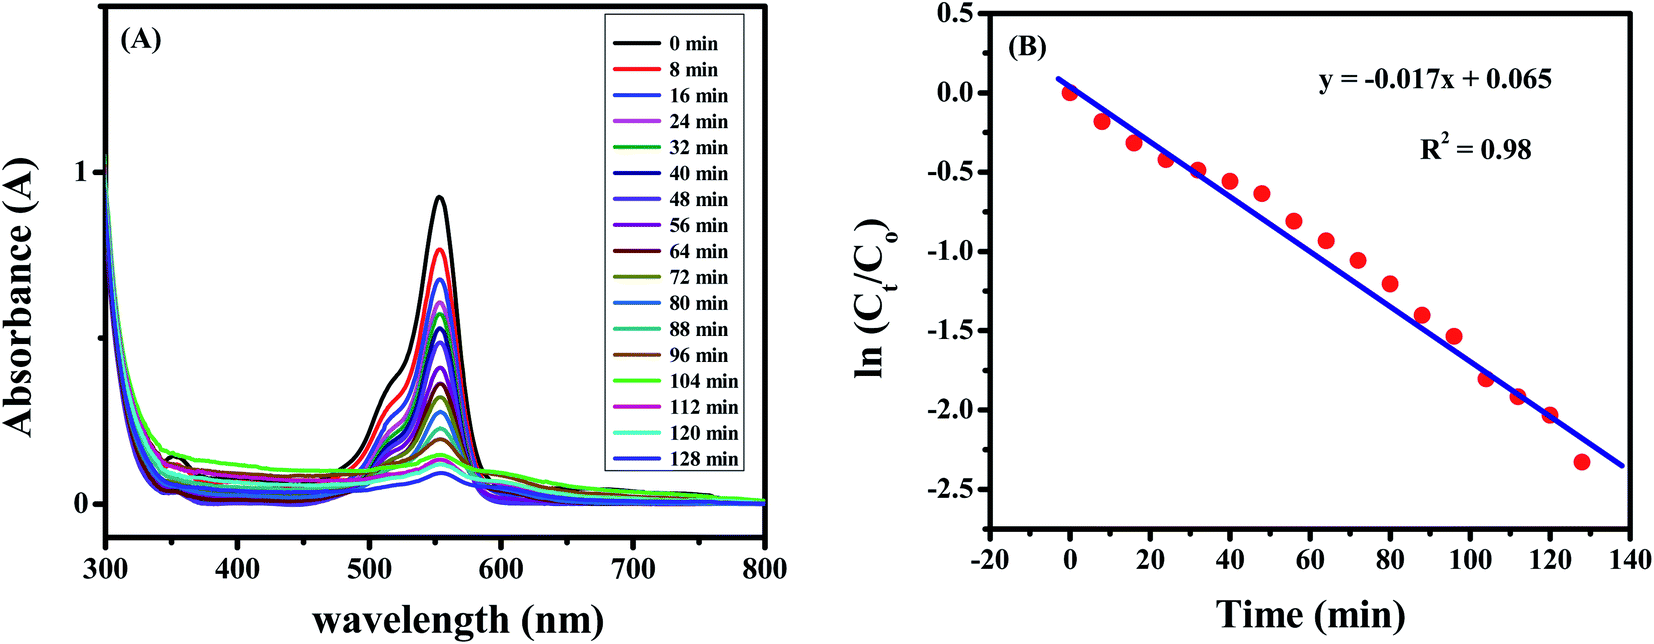
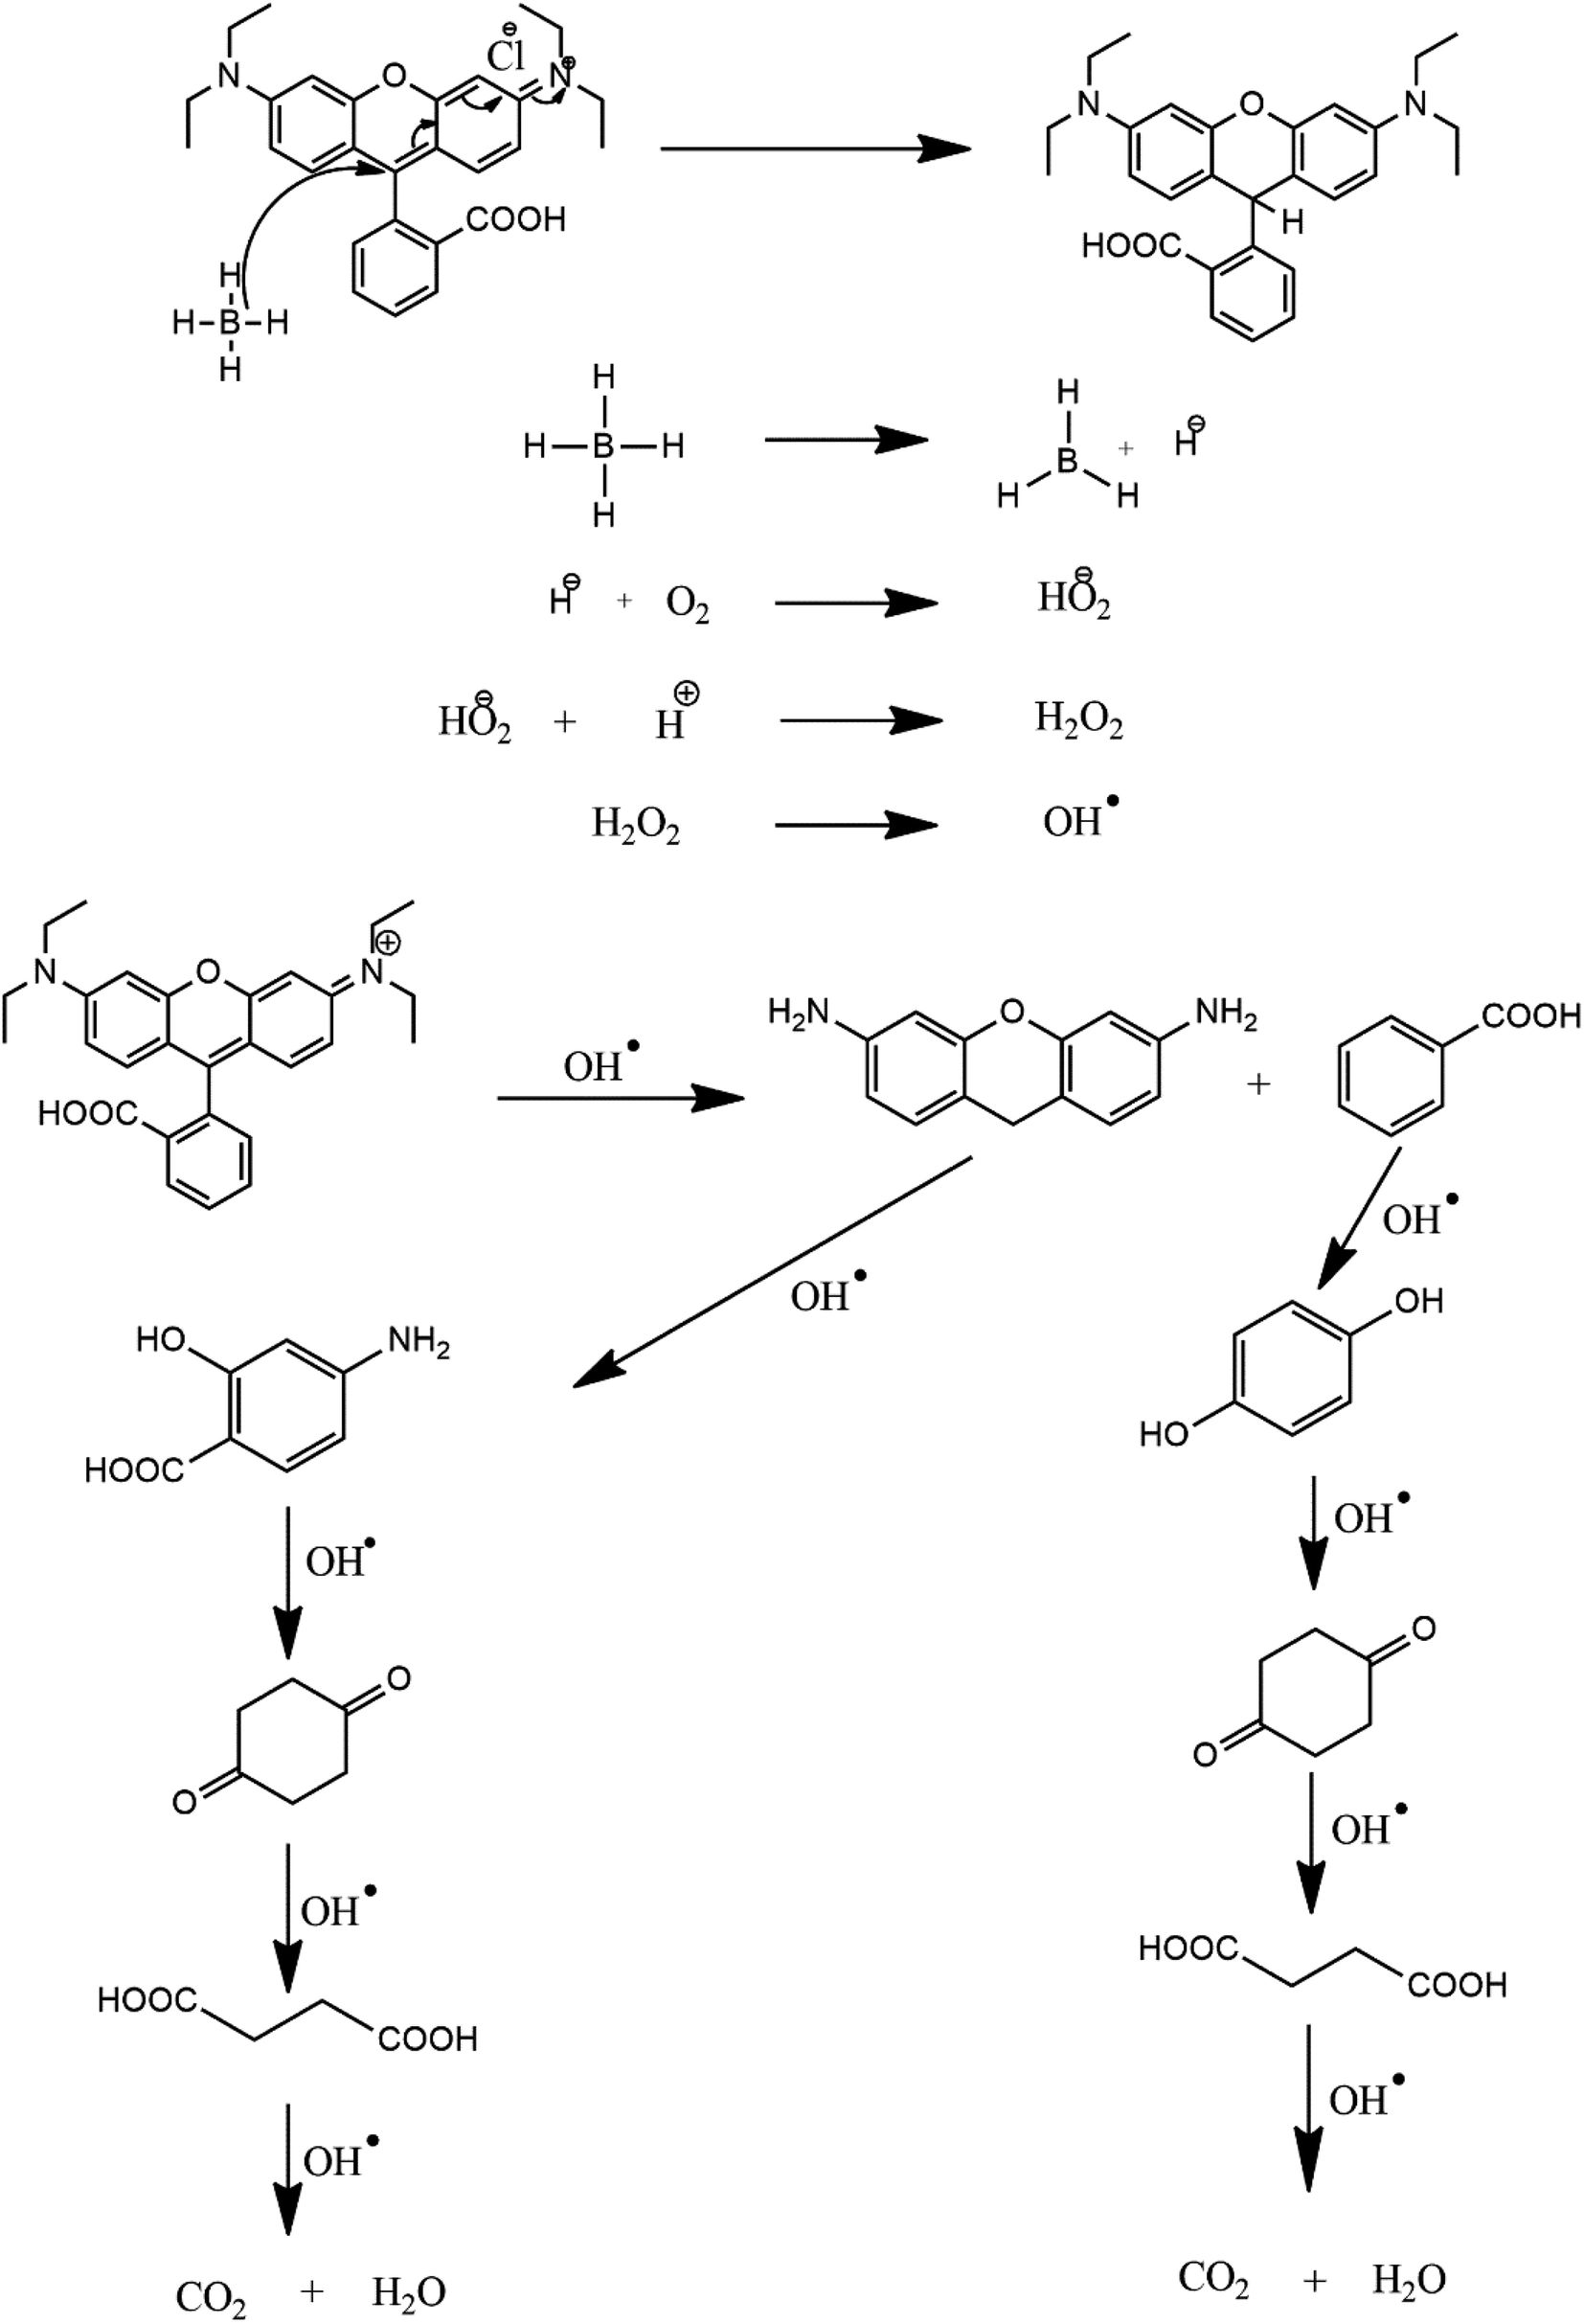
The degradation of the dye by NaBH4 was also probed by UV visible spectroscopy as shown in Fig. 8A. Rhodamine B solution gives a pink color with a prominent signal at 554 nm. By the addition of NaBH4, Rhodamine B started degradation which is witnessed by the decrease in absorption intensity of the peak with time and also from the variation and finally disappearance of the color of solution. The degradation took 128 minutes with a rate constant (k) value of 0.017 min−1 as obvious from Fig. 8B. The 1st order rate constant value was calculated by plotting ln (Ct/C0) versus time. The possible degradation mechanism of Rhodamine B is the attack of hydride ions generated from NaBH4 on the double bond of the ring which breaks the conjugation of the ring, thus resulting in color modification of RhB solution. The proposed degradation mechanism can be seen in Scheme 1. The percent degradation calculated by using the equation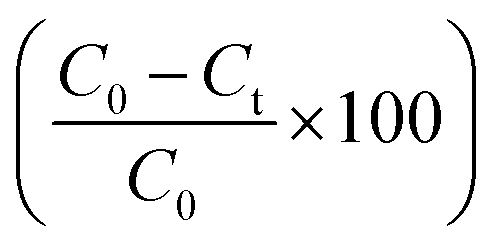 was 90.3%. Plot of percent degradation and extent of reaction are shown in Fig. S9A and B.†
 | ||
| Fig. 8 (A) Degradation spectrum of 10 μM Rhodamine B solution. (B) Plot of ln (Ct/Co) versus time for calculation of rate constant value. | ||
 | ||
| Scheme 1 Proposed degradation mechanism of Rhodamine B. | ||
4. Conclusions
The current research work reveals the role of HOOC-fMWCNTs/NH2-fMWCNTs as an effective novel recognition layer for significantly improving the ability of GCE to detect Rhodamine B dye up to picomolar concentration. The voltammetric analysis shows that the developed sensing material offers high surface sites and lower charge transfer resistance for getting robust signal of minute concentration of Rhodamine B. The electrochemical study reveals that the designed sensor boosts up the current response of Rhodamine B oxidation as compared to the bare glassy carbon electrode. Under optimized conditions, the detection and quantification limits are 57.4 pM and 191.3 pM respectively. The detection ability of the sensor is much promising as obvious from its performance comparison with other sensors for Rhodamine B. The designed sensing platform has promising features of simplicity, specificity, selectivity, reproducibility, stability, anti-interfering ability and practical applicability. The degradation investigations of Rhodamine B were carried out electrochemically and spectrophotometrically using NaBH4 as a reducing agent. The percent degradation of Rhodamine B at the designed sensor under optimized conditions was found to be 81.3%. UV-visible spectroscopic results also demonstrated Rhodamine B degradation. The time based decrease in optical absorbance of the dye followed first order kinetics with a rate constant value of 0.017 min−1.Conflicts of interest
There is no conflict of interst for this manuscript.Acknowledgements
Dr Afzal Shah acknowledges the support of Quaid-i-Azam University and Higher Education Commission of Pakistan. Dr Sher Bahadar Khan acknowledges the Deanship of Scientific Research at King Abdul Aziz University, Jeddah, Saudi Arabia, for supporting this project (KEP-104-130-42).References
- A. H. Rashed and A. Shah, Environ. Dev. Sustain., 2021, 23, 2931–2948 CrossRef.
- Y. N. Zhang, Q. Niu, X. Gu, N. Yang and G. J. N. Zhao, Nanoscale, 2019, 11, 11992–12014 RSC.
- H. Fu, C. Pan, W. Yao and Y. Zhu, J. Phys. Chem. B, 2005, 109, 22432–22439 CrossRef CAS PubMed.
- K. Sathishkumar, M. S. AlSalhi, E. Sanganyado, S. Devanesan, A. Arulprakash and A. Rajasekar, J. Photochem. Photobiol., B, 2019, 200, 111655 CrossRef CAS PubMed.
- M. Hayat, A. Shah, J. Nisar, I. Shah, A. Haleem and M. N. Ashiq, Catalysts, 2022, 12, 306 CrossRef CAS.
- A. Shah, ACS Omega, 2020, 5, 6187–6193 CrossRef CAS PubMed.
- A. Shah, M. S. Malik, A. Zahid, F. j. Iftikhar, A. Anwar, M. S. Akhter, M. R. Shah, M. A. Zia and M. N. Ashiq, Electrochim. Acta, 2018, 274, 131–142 CrossRef CAS.
- C. Tatebe, X. Zhong, T. Ohtsuki, H. Kubota, K. Sato and H. Akiyama, Food Sci. Nutr., 2014, 2, 547–556 CrossRef CAS PubMed.
- J. Zhang, L. Zhang, W. Wang and Z. Chen, J. AOAC Int., 2016, 99, 760–765 CrossRef CAS PubMed.
- R. Nagaraja, N. Kottam, C. Girija and B. Nagabhushana, J. Powder Technol., 2012, 215, 91–97 CrossRef.
- X. Su, X. Li, J. Li, M. Liu, F. Lei, X. Tan, P. Li and W. Luo, Food Chem., 2015, 171, 292–297 CrossRef CAS PubMed.
- N. Xiao, J. Deng, K. Huang, S. Ju, C. Hu and J. Liang, Spectrochim. Acta, Part A, 2014, 128, 312–318 CrossRef CAS PubMed.
- B. Tang, C. Xi, Y. Zou, G. Wang, X. Li, L. Zhang, D. Chen and J. Zhang, J. Chromatogr. B: Anal. Technol. Biomed. Life Sci., 2014, 960, 87–91 CrossRef CAS PubMed.
- M. Alesso, G. Bondioli, M. C. Talío, M. O. Luconi and L. P. Fernandez, Food Chem., 2012, 134, 513–517 CrossRef CAS.
- H. Tao, F. Liu, C. Ji, Y. Wu, X. Wanga and Q. Shi, RSC Adv., 2022, 12, 5265–5274 RSC.
- D. Z. Khater, R. S. Amin, M. Mahmoud and K. M. El-Khati, RSC Adv., 2022, 12, 2207–2218 RSC.
- Z. Zhu, L. Garcia-Gancedo, A. J. Flewitt, H. Xie, F. Moussy and W. J. Milne, Sensors, 2012, 12, 5996–6022 CrossRef PubMed.
- N. Yang, X. Chen, T. Ren, P. Zhang and D. Yang, Carbon nanotube based biosensors, Sens. Actuators, B, 2015, 207, 690–715 CrossRef CAS.
- G. Wu, Y. Ma, Y. Yu, Y. Xing, X. Yuan and X. Zhu, Environ. Sci. Pollut. Res., 2021, 28, 21174–21182 CrossRef CAS PubMed.
- S. Aftab, S. Kurbanoglu, G. Ozcelikay, N. K. Bakirhan, A. Shah and S. A. Ozkan, Sens. Actuators, B, 2019, 285, 571–583 CrossRef CAS.
- H. Subramanian, M. Krishnan and A. Mahalingam, RSC Adv., 2022, 12, 985–997 RSC.
- A. P. Kumar, D. Bilehal, A. Tadesse and D. Kumar, RSC Adv., 2021, 11, 6396–6406 RSC.
- E. Routoula and S. V. Patwardhan, Environ. Sci. Technol., 2020, 54(2), 647–664 CrossRef CAS PubMed.
- R. Dubey, D. Dutta, A. Sarkar and P. Chattopadhyay, Nanoscale Adv., 2021, 3, 5722–5744 RSC.
- T. Kokab, A. Shah, M. A. Khan, M. Arshad, J. Nisar, M. N. Ashiq and M. A. Zia, ACS Appl. Nano Mater., 2021, 4, 4699–4712 CrossRef CAS.
- T. Kokab, A. Shah, J. Nisar, M. N. Ashiq, M. A. Khan, S. B. Khan and E. M. Bakhsh, RSC Adv., 2021, 11, 35783–35795 RSC.
- T. Kokab, A. Shah, M. A. Khan, J. Nisar and M. N. Ashiq, RSC Adv., 2021, 11, 27135–27151 RSC.
- S. W. Lee, B. S. Kim, S. Chen, Y. Shao-Horn and P. T. Hammond, J. Am. Chem. Soc., 2009, 131, 671–679 CrossRef CAS PubMed.
- V. Schroeder, S. Savagatrup, M. He, S. Lin and T. M. Swager, Chem. Rev., 2018, 119, 599–663 CrossRef PubMed.
- A. Shah, A. Ullah, A. Rauf, Z. U. Rehman, S. Shujah, S. M. Shah and A. Waseem, J. Electrochem. Soc., 2013, 160, H597 CrossRef CAS.
- N. Li, Q. Li, X. R. Chen, A. J. Veloso, V. W. S. Hung, D. Dhar and K. Kerman, ECS Trans., 2013, 50, 15–21 CrossRef.
- U. J. Pandit, I. Khan, S. Wankar, K. Raj and S. N. Limaye, Anal. Methods, 2015, 7, 10192–10198 RSC.
- M. A. Amin, S. S. Abd El-Rehim, E. E. F. El-Sherbini and R. S. Bayoumi, Electrochim. Acta, 2007, 52, 3588–3600 CrossRef CAS.
- J. Wang, B. Yang, H. Wang, P. Yang and Y. Du, Anal. Chim. Acta, 2015, 893, 41–48 CrossRef CAS PubMed.
- A. Zahid, A. Lashin, U. A. Rana, N. Al-Arifi, I. Ullah, D. D. Dionysiou, R. Qureshi, A. Waseem, H. B. Kraatz and A. Shah, Electrochim. Acta, 2016, 190, 1007–1014 CrossRef CAS.
- N. C. Honakeri, S. J. Malode, R. M. Kulkarni and N. P. Shetti, Sens. Int., 2020, 1, 100002 CrossRef.
- B. R. Patel, Q. Hassan, M. Noroozifar and K. Kerman, ACS Sustainable Chem. Eng., 2020, 8, 15108–15119 CrossRef CAS.
- T. Kokab, A. Shah, J. Nisar, A. M. Khan, S. B. Khan and A. Shah, ACS Omega, 2020, 5, 10123–10132 CrossRef CAS PubMed.
- H. T. Ngo, V. T. Nguyen, T. D. Manh, T. T. T. Toan, N. T. M. Triet, N. T. Binh, N. T. V. Hoan, T. V. Thien and D. Khieu, J. Nanomater., 2020, 2020, 4679061 Search PubMed.
- H. Setiyanto, F. Ferizal, V. Saraswaty, R. S. Rahayu and M. A. Zulfikar, IOP Conf. Ser.: Mater. Sci. Eng., 2021, 1088, 012113 CAS.
- Y. Benmassaoud, K. Murtada, R. Salghi, M. Zougagh and Á. Ríos, Molecules, 2021, 26, 2670 CrossRef CAS PubMed.
- M. Golestaneh and S. Ghoreishi, Anal. Bioanal. Electrochem., 2020, 12, 81–92 CAS.
- N. T. T. Phuong, T. X. Hoang, N. L. N. Tran, L. G. Phuc, V. D. Phung, H. K. T. Ta, T. N. Bach, N. H. T. Tran and K. T. L. Trinh Spectrochim, Spectrochim. Acta, Part A, 2021, 263, 120179 CrossRef PubMed.
- X. Zhu, G. Wu, C. Wang, D. Zhang and X. Yuan, Measurement, 2018, 120, 206–212 CrossRef.
- D. Sun and X. Yang, Food Anal. Methods, 2017, 10, 2046–2052 CrossRef.
- Y. Yi, H. Sun, G. Zhu, Z. Zhang and X. Wu, Anal. Methods, 2015, 7, 4965–4970 RSC.
- S. Feng, W. Ding, Y. Zhang, J. Wu, Z. Zou, T. Wu and Q. Tang, J. Solid State Chem., 2021, 303, 122508 CrossRef CAS.
- L. Yu, Y. Mao and L. Qu, Food Anal. Methods, 2013, 6, 1665–1670 CrossRef.
- J. Sun, T. Gan, C. Yang, Z. Shi, K. Huang and Y. Liu, Can. J. Chem., 2014, 92, 640–646 CrossRef CAS.
- J. Sun, T. Gan, Y. Li, Z. Shi and Y. Liu, J. Electroanal. Chem., 2014, 724(15), 87–94 CrossRef CAS.
- I. Bontidean, C. Berggren, G. Johansson, E. Csöregi, B. Mattiasson, J. R. Lloyd, K. J. Jakeman and N. Brown, Anal. Chem., 1998, 70, 4162–4169 CrossRef CAS PubMed.
- D. Hu, Z. Sheng, P. Gong, P. Zhang and L. Cai, Analyst, 2010, 135, 1411–1416 RSC.
Footnote |
| † Electronic supplementary information (ESI) available. See https://doi.org/10.1039/d2ra01722a |
| This journal is © The Royal Society of Chemistry 2022 |