 Open Access Article
Enhanced detection sensitivity through enzyme-induced precipitate accumulation in LSPR-active nano-valleys†
Su-Heon Kwakab,
Jung-Sub Wic,
Jieon Leed,
Chunjoong Kim*a and
Hee-Kyung Na *b
*b
aDepartment of Materials Science and Engineering, Chungnam National University, Daejeon 34134, Korea. E-mail: ckim0218@cnu.ac.kr
bBio-Imaging Team, Korea Research Institute of Standards and Science (KRISS), Daejeon 34113, Korea. E-mail: nahk@kriss.re.kr
cDepartment of Materials Science and Engineering, Hanbat National University, Daejeon 34158, Korea
dPredictive Toxicology Department, Korea Institute of Toxicology (KIT), Daejeon, 34114, Korea
First published on 23rd May 2022
Abstract
Biomolecule detection based on the localized surface plasmon resonance (LSPR) phenomenon has advantages in label-free detection, good sensitivity, and measurement simplicity and reproducibility. However, in order to ultimately be used for actual diagnosis, the ability to detect trace amounts of biomarkers is necessary, which requires the development of signal enhancement strategies that enable ultrasensitive detection. In this paper, we provide a straightforward and efficient route to boost LSPR sensitivity based on multiple sample washings. We found that repeated washing and drying cycles lead to a shift in the LSPR peak in a concentration-dependent manner, where this process drives the accumulation of a precipitate, formed by an enzyme reaction with target specificity, in the sample's LSPR active plasmonic nano-valley structure. Results show that the washing and drying process leads to a signal enhancement of more 200 times compared to a sensor with only enzyme-based amplification. To maximize this effect, optimization of the plasmonic nanostructure was also carried out to finally achieve atto-molar detection of miRNA with a distinguishable LSPR peak shift.
Introduction
From the rapid diagnosis of infectious diseases such as COVID-19 to the early diagnosis of intractable diseases such as cancer, the need for the development of point-of-care (POC) diagnostic devices has been continually raised.1–5 Among various approaches to aid the development of POC devices, many studies have been conducted to detect clinically important biomolecules using the localized surface plasmon resonance (LSPR) phenomenon based on its advantages of simplicity and reproducibility in optical measurements and the possibility for miniaturization.6–8In order to develop an LSPR-based diagnostic device applicable to POC systems, it is necessary to design both portable analytical equipment and scalable plasmonic chips fabricated with simple processes.9–11 In the case of miniaturized optical equipment, it is still difficult to precisely read small changes in wavelength at sub-nanometer resolution.12 As for the sensors, it remains a challenge to realize superior sensitivity considering the fabrication of large-area plasmonic nanostructures.13–16 In order to satisfy these two aspects, the development of a signal amplification strategy that can induce a distinguishable LSPR peak shift is required. To this end, there have been wide efforts to amplify LSPR signals in many studies.17–22 But despite advances in signal amplification methods such as the formation of insoluble precipitates by enzymatic reactions, a practical strategy to induce a noticeable LSPR peak shift in the presence of clinically significant, low-abundance biomarkers (e.g., miRNA, cancer-specific antigens, and infectious viruses) has yet to be reported.23–26
In this regard, we attempted to develop a signal amplification method that enables biomarker detection with high sensitivity in scalable plasmonic nanostructures. Starting with a previously developed method in which the target-specific formation of a precipitate is induced by an enzyme, we report here a strategy to increase LSPR sensitivity by accumulating the precipitate in the LSPR-active region of the sensor by repeating a simple washing and drying process. With this simple strategy, we achieved atto-molar detection with a 200 times increase in sensitivity compared to a sensor with only precipitate formation.
Experimental methods
Fabrication of DAS patterns
The double-bent Au strip (DAS) arrays were fabricated using the UV-nanoimprint lithography (NIL) process together with Au deposition. First, 450 mL MINS-311RM resin was applied to the center of a 4 inch mold with a 200 nm period. A polyethylene terephthalate (PET) film was placed over the top of the resin, and then a roller was used to cover the entire mold with the resin. After curing by UV irradiation for 600 s, the PET film was demolded to obtain a patterned film. After that, the post-exposure process was repeated 3 times for 900 s to increase the stability of the line pattern.Gold deposition on the produced film was performed using an E-beam evaporator while adjusting the deposition angle to 15°, 22.5°, 30°, and 37.5° and depositing Au with a thickness of 10 nm. After that, the film was cut into 5 × 7 mm sections and used in the experiments.
miRNA 125b detection
After mixing 50 μL thiol-modified hairpin capture DNA complementary to miRNA 125b (100 μM), 50 μL 10X PBS, and 400 μL DEPC-treated water, the mixture was kept at 95 °C for 5 min and then gradually cooled to 4 °C and maintained for 30 min. Then 50 μL 3-mercapto-1-propanol (100 μM) was added, and the DAS film was treated with the mixture overnight at 25 °C. Different concentrations of miRNA 125b were added and incubated at 25 °C for 2 h. After removing the mixture, 200 μL biotinylated signal probe (200 nM) was added and incubated at 25 °C for 1 h. Then the probe was removed and 1 mL 1% BSA (PBS) was added and incubated at 25 °C for 1 h. Thereafter, streptavidin–alkaline phosphatase was added at a concentration of 5 μg mL−1 and incubated for 1 h. Finally, after removing the mixture, 1 mL BCIP/NBT solution was added and incubated at 25 °C for 20 min.The washing and drying process was performed by first treating with DW and then drying with nitrogen blow. This process was repeated 10 times, after which the samples were measured by UV visible spectroscopy. Finally, the LSPR shift was calculated as follows: Δλmax = λmax [positive] − λmax [negative].
Electromagnetic simulation
Electromagnetic simulations were performed using three-dimensional FDTD software (FDTD Solutions, Lumerical Inc.). Gold strips of thickness 10 nm on a polymer grating (200 nm period, 90 nm wide at the top, 110 nm wide at the bottom, and 100 nm height) with a refractive index of 1.5 were modeled as the DAS array. Each detailed simulation geometry is shown in Fig. S2 and S5.† Bulk dielectric properties of Au from Johnson and Christy's results (data included in the software) were used for the simulation.Results and discussion
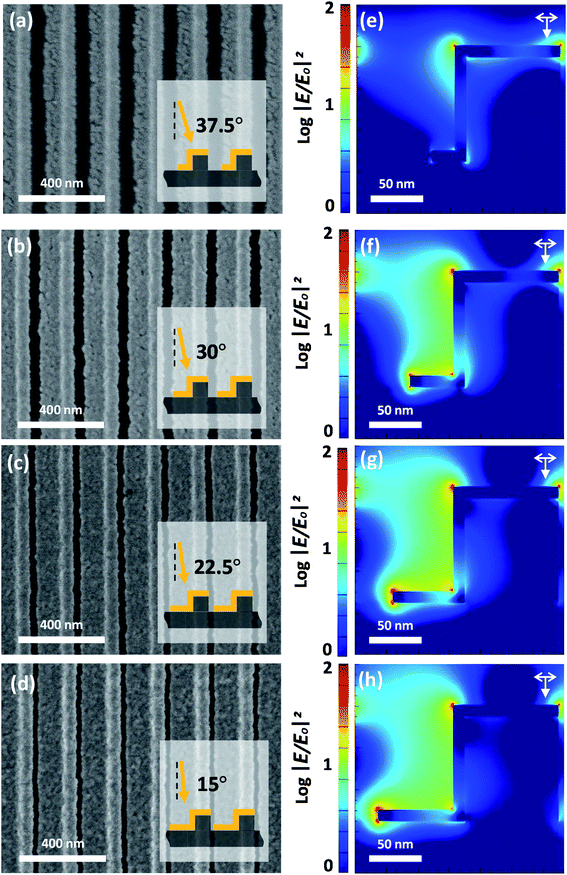
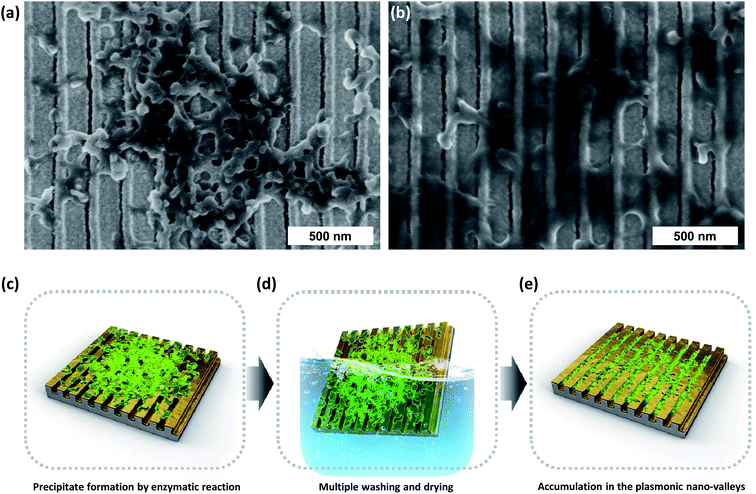
We first compared SEM images of the double-bent Au strip (DAS) array after incubation in a solution of NBT formazan produced by the alkaline phosphatase reaction of BCIP/NBT without and with repeated washing and drying cycles. In the former case, it was observed that organic precipitates formed on the top of the nanostructure, as shown in Fig. 1a. In the latter case with repeated washing and drying, as shown in Fig. 1b, the precipitates permeated into the grooves of the nanostructure (or nano-valleys). The increased precipitate accumulation in the grooves is accounted for by the capillary force between the grooves, which results from repeated exposure to the aqueous environment and nitrogen blowing of the washing and drying process as schematically depicted in Fig. 1c–e. The SEM image in Fig. 1b shows the potential for the increase in LSPR sensitivity by increasing the amount of precipitates in the nano-valleys for increased detection. In this situation, the coverage of the Au film deposited at the bottom of the nano-valleys is important to maximize the LSPR sensitivity (ESI, Fig. S1†). Therefore, we fabricated different DAS arrays by finely controlling the deposition angle (from 37.5° to 15°) in the Au evaporation step on the same polyurethane acrylate (PUA) nanogratings, which were obtained by UV-nanoimprint lithography with a period of 200 nm. As depicted in Fig. 2a–d, the lowest deposition angle of 15° results in the largest deposition area, i.e., the most extensive coverage, in the bottom of the nano-valley. To assess the effect that the Au coverage of the bottoms of the grooves has on the plasmonic sensing response, finite-difference time-domain (FDTD) simulation was performed as shown in Fig. 2e–h. The detailed simulation geometries are shown in Fig. S2† for each structure. Depending on the extent of the Au deposited area in the bottom of the grooves, the results show a significant enhancement of the localized electric field for the modeled DAS structure fabricated by Au deposition at 15°. The LSPR sensitivity was further estimated through FDTD simulation by modeling the DAS structure with variable thickness in the surrounding organic layer. As shown in Fig. S1,† the LSPR peak shift was shown to be dependent on the extent of bottom deposition coverage when the thickness of the organic layer was in the range of 0 to 15 nm. | ||
| Fig. 2 (a–d) SEM images and (e–h) corresponding FDTD simulated electromagnetic field distributions of a double-bent Au strip with varying Au-deposited areas from different deposition angles. | ||
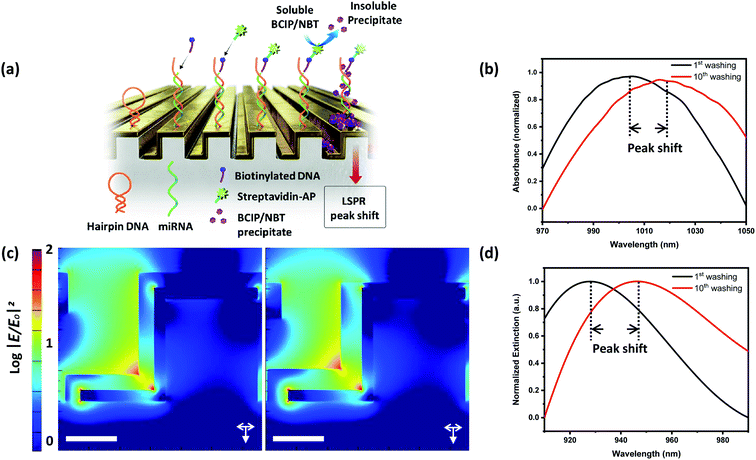
With the fine-tuned plasmonic nanostructure fabricated by Au deposition at 15°, we investigated LSPR sensitivity changes as precipitates accumulate in the plasmonic nano-valleys. First, as shown in the strategy in Fig. 3a for the sensitive detection of miRNA 125b, which is known to be involved in various pathological events including cancer and neurodegenerative disease,27–29 thiol-modified capture DNA with a hairpin structure was introduced to the fabricated nanopatterned surface. In the presence of the target miRNA, conformational changes were induced through sequence-specific hybridization, and the biotinylated signal probe was bound to the end of the capture DNA. Treatment of alkaline phosphatase–streptavidin conjugate followed by the treatment of BCIP/NBT induced the formation of the precipitate uniformly over the entire surface, as shown in Fig. S3,† resulting in considerable red-shifted spectral changes (100 nm) at high concentrations of miRNA 125b (100 nM), as shown in Fig. S4.† Then following the present strategy, repeated washing and drying induced an additional 68 nm spectral shift. But since clinically significant biomarkers typically exist in a low concentration range, the possibility of signal enhancement at a lower concentration was examined. In the presence of 10 fM miRNA 125b, the repeated washing and drying process induced an additional 14 nm shift, as shown in Fig. 3b, which is notably larger than the LSPR spectral shift at low concentrations in our previous report.23 Furthermore, no considerable LSPR peak shift was observed in the absence of miRNA 125b. These results are in good agreement with FDTD simulation, as shown in Fig. 3c. The detailed simulation geometries are shown in Fig. S5† for each structure. In the presence of the same volume of organic layer, a larger portion localized in the valleys causes a further red shift in the calculated extinction spectrum compared to that in the uniformly distributed organic layer, as plotted in Fig. 3d.
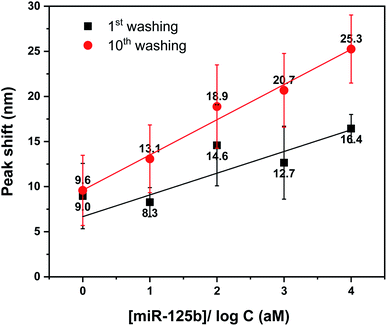
Finally, we compared the quantification performance of the previous signal amplification approach using only precipitate formation with the current strategy of multiple cycles of washing and drying. Fig. 4 plots calibration curves obtained by the measurement of LSPR peaks in the presence of various concentrations of miRNA 125b ranging from 0 to 10 fM with 1 cycle (black squares) and 10 cycles (red circles) of washing and drying. The limits of detection (LoD) of the previous and current approaches were determined to be 4.4 fM and 16.5 aM, respectively, according to the equation LoD = 3.3 (SD/S), where SD is the standard deviation and S is the slope of the calibration curve. Also, it is worth mentioning that the repeated washing and drying process performed after the formation of the precipitate on the plasmonic structure with the least extensive bottom Au deposition area fabricated at 37.5° did not induce any additional LSPR shift, as shown in Fig. S6.† Such difference can be attributed to the different sensitivities shown in Fig. S1,† even when the organic materials are equally accumulated inside the valleys of each nanostructure. Taken together, the current findings show that it is possible to realize a highly sensitive LSPR biosensor comparable to previous reports30 by driving accumulated precipitates formed on plasmonic nanostructures into LSPR-active regions through simple repeated washing and drying without additional signal amplification or special processing.
Conclusion
In this report, we have presented a simple and effective method for LSPR signal enhancement that allows ultrasensitive detection of target biomolecules. Multiple washing and drying cycles of the sample drive the accumulation of enzymatic reaction products in the plasmonic nano-valleys, consequently inducing an additional LSPR peak shift in a concentration-dependent manner. Moreover, fine-tuning of the deposited Au coverage on the bottoms of the nano-valleys provides an extension of the sensitive detection area for the accumulated analytes. With these two strategies, we successfully demonstrated atto-molar detection of miRNA. By making it possible to induce a noticeable LSPR peak shift even at low concentrations with the proposed simple method, POC device applications of LSPR biosensors are closer to being realized.Conflicts of interest
The authors declare no competing interests.Acknowledgements
This research was supported by the National Research Foundation of the Korean government(2020R1A2C1005808, 2021M3C1C3097638 and 2021RIS-004) and the National Research Council of Science & Technology (grant no. CAP21061-000) funded by Korean Government.References
- Y. Ju, J. Kim, Y. Park, C. Y. Lee, K. Kim, K. H. Hong, H. Lee, D. Yong and H. G. Park, Biosens. Bioelectron., 2022, 196, 113689 CrossRef CAS PubMed.
- D. H. Ko, A. Hosseini, H. Karaosmanoglu, K. Taredun, L. Jones and A. Partridge, Sens. Actuators, B, 2022, 351, 130918 CrossRef CAS.
- H. Q. Nguyen, H. K. Bui, V. M. Phan and T. S. Seo, Biosens. Bioelectron., 2022, 195, 113655 CrossRef CAS PubMed.
- C. Y. Lee, I. Degani, J. Cheong, R. Weissleder, J.-H. Lee, J. Cheon and H. Lee, Acc. Chem. Res., 2021, 54, 3991–4000 CrossRef CAS PubMed.
- B. Shan, Y. Y. Broza, W. Li, Y. Wang, S. Wu, Z. Liu, J. Wang, S. Gui, L. Wang, Z. Zhang, W. Liu, S. Zhou, W. Jin, Q. Zhang, D. Hu, L. Lin, Q. Zhang, W. Li, J. Wang, H. Liu, Y. Pan and H. Haick, ACS Nano, 2020, 14, 12125–12132 CrossRef CAS PubMed.
- K. Behrouzi and L. Lin, Biosens. Bioelectron., 2022, 195, 113669 CrossRef CAS PubMed.
- A. N. Masterson, T. Liyanage, H. Kaimakliotis, H. Gholami Derami, F. Deiss and R. Sardar, Anal. Chem., 2020, 92, 9295–9304 CrossRef CAS PubMed.
- E. C. Peláez, M.-C. Estevez, A. Portela, J.-P. Salvador, M.-P. Marco and L. M. Lechuga, Biosens. Bioelectron., 2018, 119, 149–155 CrossRef PubMed.
- E. C. Welch, J. M. Powell, T. B. Clevinger, A. E. Fairman and A. Shukla, Adv. Funct. Mater., 2021, 31, 2104126 CrossRef CAS.
- J. He, M. Boegli, I. Bruzas, W. Lum and L. Sagle, Anal. Chem., 2015, 87, 11407–11414 CrossRef CAS PubMed.
- Z. Li, Q. Fan and Y. Yin, Chem. Rev., 2022, 122, 4976–5067 CrossRef CAS PubMed.
- Z. Yang, T. Albrow-Owen, W. Cai and T. Hasan, Miniaturization of optical spectrometers, Science, 2021, 371, 480 Search PubMed.
- T. Lednický and A. Bonyár, ACS Appl. Mater. Interfaces, 2020, 12, 4804–4814 CrossRef PubMed.
- C. Zhang, D. Paria, S. Semancik and I. Barman, Small, 2019, 15, 1901165 CrossRef PubMed.
- A. H. Thilsted, J. Y. Pan, K. Wu, K. Zór, T. Rindzevicius, M. S. Schmidt and A. Boisen, Small, 2016, 12, 6745–6752 CrossRef CAS PubMed.
- L. Yan, Y. Yan, L. Xu, R. Ma, F. Jiang and X. Xu, Appl. Surf. Sci., 2016, 367, 563–568 CrossRef CAS.
- M. Li, J. Cheng, Z. Yuan, Q. Shen and Q. Fan, Sens. Actuators, B, 2021, 330, 129347 CrossRef CAS.
- W. Chen, J. Li, X. Wei, Y. Fan, H. Qian, S. Li, Y. Xiang and S. Ding, Microchim. Acta, 2020, 187, 590 CrossRef CAS PubMed.
- D. Wang, Y. Zhang, X. Zhao and Z. Xu, Sens. Actuators, B, 2019, 296, 126646 CrossRef CAS.
- J. Spadavecchia, R. Perumal, A. Barras, J. Lyskawa, P. Woisel, W. Laure, C.-M. Pradier, R. Boukherroub and S. Szunerits, Analyst, 2014, 139, 157–164 RSC.
- L. Xie, X. Yan and Y. Du, Biosens. Bioelectron., 2014, 53, 58–64 CrossRef CAS PubMed.
- H. Huang, C. Qu, X. Liu, S. Huang, Z. Xu, Y. Zhu and P. K. Chu, Chem. Commun., 2011, 47, 6897–6899 RSC.
- H.-K. Na, J.-S. Wi, H. Y. Son, J. G. Ok, Y.-M. Huh and T. G. Lee, Biosens. Bioelectron., 2018, 113, 39–45 CrossRef CAS PubMed.
- N. R. Jo, K. J. Lee and Y.-B. Shin, Biosens. Bioelectron., 2016, 81, 324–333 CrossRef CAS PubMed.
- S. Chen, M. Svedendahl, R. P. V. Duyne and M. Käll, Nano Lett., 2011, 11, 1826–1830 CrossRef CAS PubMed.
- S.-W. Lee, K.-S. Lee, J. Ahn, J.-J. Lee, M.-G. Kim and Y.-B. Shin, ACS Nano, 2011, 5, 897–904 CrossRef CAS PubMed.
- X. Zhang, T. Li, Y.-N. Han, M. Ge, P. Wang, L. Sun, H. Liu, T. Cao, Y. Nie, D. Fan, H. Guo, K. Wu, X. Zhao and Y. Lu, Cancers, 2021, 13, 5710 CrossRef CAS PubMed.
- R. A. De Mello, G. A. Amaral, N. M. Neves, E. G. Lippo, F. Parini, S. Xu, M. Tolia, N. Charalampakis, H. Tadokoro, P. Castelo-Branco and J. Zhu, Future Oncol., 2021, 17, 3383–3396 CrossRef CAS PubMed.
- Y. Zhao, Y. Zhang, L. Zhang, Y. Dong, H. Ji and L. Shen, Aging Dis., 2019, 10, 1293–1301 CrossRef PubMed.
- B. N. Johnson and R. Mutharasan, Analyst, 2014, 139, 1576–1588 RSC.
Footnote |
| † Electronic supplementary information (ESI) available: FDTD simulation results (Fig. S1); FDTD simulation geometries; SEM images of DAS; UV-Vis spectra of DAS films in the presence of miRNA 125b; UV-Vis spectra of DAS films fabricated with Au deposition at 37.5°. See https://doi.org/10.1039/d2ra01331b |
| This journal is © The Royal Society of Chemistry 2022 |


