 Open Access Article
Screening the functions of modified rice straw biochar for adsorbing manganese from drinking water†
Jie Zhaoab,
Zhi-Long Ye *a,
Xiaofang Pana,
Guangjing Caia and
Jiani Wanga
aKey Laboratory of Urban Pollutant Conversion, Institute of Urban Environment, Chinese Academy of Sciences, No. 1799 Jimei Road, Xiamen City, Fujian 361021, China. E-mail: zlye@iue.ac.cn; jzhao@iue.ac.cn
bCollege of Life Sciences, Fujian Agriculture and Forestry University, Fuzhou, 350002, China
First published on 18th May 2022
Abstract
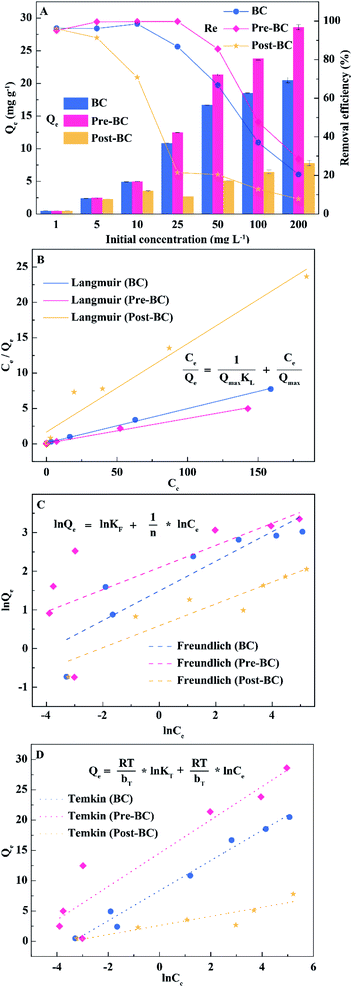
The seasonal out-of-limit of manganese ions (Mn2+) in the drinking water reservoirs is an intractable problem to water supply, which can pose a threat to the human health. In this study, the removal of Mn2+ by using pristine (BC), pre-alkali (Pre-BC) and post-alkali (Post-BC) modified biochar originating from rice straw was investigated. The maximum adsorption capacities obtained for BC, Pre-BC, and Post-BC were 20.59, 28.37, and 8.06 mg g−1, respectively. The Langmuir isotherm model and the pseudo-second-order kinetic model were suitable fitting models to describe the adsorption process. The investigation of adsorption functions was carried out that revealed that the predominant forces were precipitation and cation exchange with the proportions of 43.38–69.15% and 38.05–55.79%, respectively. With regard to precipitation, Mn(II) particles (Al–Si–O–Mn and MnCO3) and insignificantly oxidized insoluble Mn(IV) particles (MnO2) were formed on the biochar surface. Alkali and alkaline earth metals facilitated the behavior of cation exchange, where the primary contributing ions for cation exchange were Na+, Mg2+ and Ca2+ during the adsorption process. These outcomes suggest that alkali pre-treated modification of biochar is practical for the application of manganese pollution control in lakes and reservoirs.
Introduction
Lakes and reservoirs are the main water sources for agriculture, industry, and municipality. However, seasonal out-of-limit levels of manganese in lakes and reservoirs have become an intractable problem in many areas of the world, threatening the safe water supply. Due to the existence of seasonal hypolimnion anoxia (especially in summer) in the lakes and reservoirs,1 dissolved oxygen at the bottom of the water body might decrease dramatically, which would lead to the release of Mn2+ from the sediments to the upper aquifer driven by the manganese-reducing micro-organisms.2 This would bring a security threat to the operation of the drinking water supply. Mn2+ content exceeding the limit in drinking water can be a potential risk to human health by causing chronic poisoning. Excessive intake of Mn2+ would cause symptoms such as sleep disorders, salivation, confusion in speech and slow movement, which would damage the human nervous system, especially in children.3 Besides, excessive levels of Mn2+ would cause aesthetic and operational problems during the transportation of water supply such as laundry stains and pipe clogging, respectively.4 Therefore, many countries have developed Mn limit standards for water supply. The United Nations Drinking Water Quality Standard stipulates that the limit of Mn2+ should be under 0.05 mg L−1,3 and some water utilities even require restrictions of 0.02 mg L−1 to enhance the water quality.1 Hence, it is important to develop feasible technologies to remediate Mn2+ pollution in lakes and reservoirs.Some technologies, including catalytic oxidation,4 biological oxidation,5 and adsorption,6 have been tested to reduce manganese contamination in water bodies. Due to relative high efficiency and easy operation, the application of adsorption is promising. At present, typical adsorbent materials including activated carbon,6 carbon nanotubes7 and nanocomposites8 are reported. Benefiting from the advantages of low cost and high adsorption performance, the implementation of biochar as an adsorbent for heavy metals is a promising option in environmental remediation.9,10 The conversion of agricultural and forestry waste into biochar for environmental remediation application is an effective way to reuse waste resources, which could effectively improve the efficiency of waste utilization and relieve the pressure of resource scarcity.11
Biochar, as the product obtained from biomass pyrolysis under an oxygen-limited environment, possesses multi-dimensional pore structures, abundant functional groups, and complex surface properties.12,13 Normally, biochar directly prepared from conventional agriculture and forestry wastes has limited adsorption capacity for certain heavy metals, which is due to insufficiently active functional groups and low selectivity.14 For instance, the pristine biochar has a limited adsorption capacity for the removal of arsenic and cadmium.15 Studies have been conducted to enhance biochar adsorption capacity through surface modification.16–18 It has been reported that alkali modification was available to improve the specific surface area and functional groups of biochar, thereby increasing its adsorption performance.19 As for the removal of heavy metals, alkali modification by using NaOH or KOH is recommended, which can increase Na composition and oxygen-containing functional groups toward biochar and therefore improve the adsorption capacity on heavy metals.20 Peter et al.21 reported that NaOH-treated softwood biochar could homogenously distribute Na+ on the surface of biochar and thereafter improved the adsorption capacity 22 times higher than that of the unmodified biochar for Cu2+ removal. For the removal of Mn2+ from lakes and reservoirs, limited works have been reported on the relevant issue.
Presently, regarding biochar removing Mn2+, there is limited information available to describe adsorption functions. An et al.22 reported that the possible adsorption mechanism was the formation of MnCO3 and –COOMn+, which were generated during Mn2+ adsorption by pomelo peel biochar. Recent studies revealed that the main adsorption functions responsible for heavy metal adsorption could be precipitation, metal cation exchange, complexation with oxygen-containing functional groups, and chelation with π electrons.23–25 For different heavy metals, the interaction mechanisms between biochar and the adsorbates could be different. For instance, a recent study revealed that nanosized MgAl-layered double hydroxide-coated rice husk biochar could promote its adsorption capacity on Cu2+ and Cd2+ via precipitation with CO32− and SO42− and ion exchange with Mg2+.26 Iamsaard et al.27 found that the predominant functions of pineapple leaf biochar adsorbing Ni2+, Zn2+ and Cu2+ were cation exchange to metal ions such as Na+, Mg2+, K+, Ca2+ and surface complexation with functional groups such as COOH, C–O, C–H, and C–C bonds. Hence, in order to effectively remove Mn2+ from the water body, a comprehensive investigation of the adsorption behavior by modified biochar is necessary.
In this study, rice straw biochar was prepared and modified by using alkali pre-treated and post-treated modification, respectively, so as to investigate the performance of manganese removal from the water supply. The adsorption isotherm and kinetics were investigated and the functional mechanisms were clarified by using a combination of different analyses. The research outcomes were expected to provide methodological support for controlling manganese endogenous pollution for a safe drinking water supply.
Materials and methods
Biochar preparation and modification
Raw rice straw was purchased from Lianfeng Agricultural Products Deep Processing Company Limited, China. The raw biomass was first dried at 105 °C and then pyrolyzed at 600 °C for 2 hours under a nitrogen atmosphere in a quartz tube furnace (OTF-1200X, Hefei Crystal Materials Technology Co., Ltd, China). After the temperature was reduced, the generated biochar (BC) was ground to powder and passed through a 40 mesh sieve.With regard to biochar modification, methods including pre- and post-modification processes are conducted. The pre-alkali modified biochar (Pre-BC) was prepared by treating raw biomass with alkali before the carbonization method, which referred to the method proposed by An et al.22 The details are described in the following steps: raw biomass was initially mixed with 2.5 M NaOH solution with a solid-to-liquid ratio at 1![[thin space (1/6-em)]](https://www.rsc.org/images/entities/char_2009.gif) :
:![[thin space (1/6-em)]](https://www.rsc.org/images/entities/char_2009.gif) 10 (w/v), and then subjected to drying at 80 °C, followed by pyrolysis like BC. After that, excess alkali was washed with deionized water and dried for the experiments. Regarding the post-alkali modified biochar (Post-BC), the alkali treatment was after the pyrolysis. The prepared BC was directly mixed with 2.5 M NaOH solution at the same mixing ratio, then washed with deionized water, and dried to obtain Post-BC.
10 (w/v), and then subjected to drying at 80 °C, followed by pyrolysis like BC. After that, excess alkali was washed with deionized water and dried for the experiments. Regarding the post-alkali modified biochar (Post-BC), the alkali treatment was after the pyrolysis. The prepared BC was directly mixed with 2.5 M NaOH solution at the same mixing ratio, then washed with deionized water, and dried to obtain Post-BC.
In order to distinguish the different adsorption functions of biochar on Mn2+ removal, the pristine biochar, and modified biochar were demineralized through rinsing steps using 1 M HCl solution, followed by washing with deionized water until the pH was constant. Previous studies have suggested that this approach did not bring about significant changes in the oxygen-containing functional groups on the surface of the biochar, which could reveal that the functions of complexation and cation-π with heavy metals were contributed by the demineralized biochar.23,25
Experimental procedure
The adsorption isotherm was evaluated through the equations of Langmuir (eqn (1)), Freundlich (eqn (2)) and Temkin equation (eqn (3)), as described below.
 | (1) |
 | (2) |
 | (3) |
The adsorption kinetics was assessed using equations of Lagergren's pseudo-first-order (eqn (4)), pseudo-second-order (eqn (5)), and Elovich (eqn (6)), respectively.
| Qt = Qe(1 − e−k1t) | (4) |
 | (5) |
 | (6) |
(1) Qcm was comprised of Qpre and Qexc, which were determined by the difference in Mn2+ adsorption capacities between untreated and demineralized biochar. Qexc, representing the function of cation exchange (Na+, Mg2+, K+, and Ca2+), was calculated using the net release of cations during the adsorption progress from untreated biochar. The adsorption capacity of Qpre was determined by the difference between Qcm and Qexc. The values of Qcm, Qpre and Qexc were determined by the following equations:
| Qcm = Qe − Qde × Y | (7) |
| Qexc = ∑Qi | (8) |
| Qpre = Qcm − Qexc | (9) |
(2) Qcom is caused by ion exchange between the protons (H+) of oxygen-containing functional groups and Mn2+, which resulted in the release of H+ into the solution during the adsorption process. Therefore, Qcom was determined by the pH change before and after the adsorption of the demineralized biochar. Qcπ was calculated by the Qcom values deducted from the Qde values. The values of Qcom and Qcπ were determined by the following equations.
| Qcom = QpH × Y | (10) |
| Qcπ = Qde × Y − Qcom | (11) |
Analytical methods
The pH value was measured using a pH meter (Rex PHS-3C, China). The ash content was determined according to the standard (GB/T 12496.3-1999, China). Elemental contents of C, H, O, and N were determined using an elemental analyzer (Vari Macro CHNS–O–Cl, Germany), and inorganic elemental contents of Na, Mg, K, Ca, Al, Si, P, and Mn were determined using an X-ray fluorescence spectrometer (XRF, Axios-MAX, Netherlands). The specific surface area, average pore size, and pore volume were assayed using a Brunauer–Emmett–Teller (BET) analyzer (ASAP 2020M+C, America). The morphology of biochar was observed using a field emission scanning electron microscope and equipped with an X-ray energy spectrometer (SEM-EDX, S-4800, Japan). The element composition and valence were measured using an X-ray photoelectron spectrometer (XPS, Axis Supra, England) and analyzed using the Thermo Avantage v5.9922. The concentration of cations was assayed using an inductively coupled plasma emission spectrometer (ICP-OES, Optima 7000DV, America).Results and discussion
Physicochemical properties of biochar
The physicochemical properties of BC, Pre-BC, and Post-BC are displayed in Table 1. The sum content of C, H, O in the raw biochar and modified biochar ranged from 62.37% to 68.42%, which could provide a matrix for oxygen-containing functional groups (–OH, –COOH) and π electro donors (–C![[double bond, length as m-dash]](https://www.rsc.org/images/entities/char_e001.gif) C–, –C
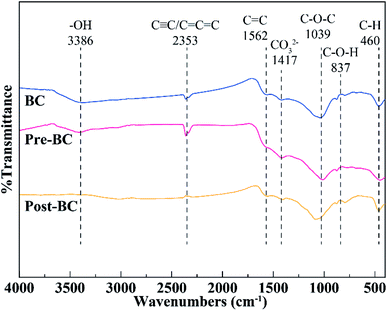
C–, –C![[triple bond, length as m-dash]](https://www.rsc.org/images/entities/char_e002.gif) C–).28 The atomic ratio of O/C and H/C did not display an obvious difference for the untreated and treated biochar, indicating that the alkali modification did not significantly change the structure of organic functional groups. FTIR spectra are shown in Fig. 1, the spectra of BC and Pre-BC showed similar profiles, which meant that the functional groups were not significantly changed by the alkali pretreatment. The FTIR spectrum of Post-BC was obviously changed at 3386, 2353, 1417, and 1039 cm−1, representing the functional groups of –OH, C
C–).28 The atomic ratio of O/C and H/C did not display an obvious difference for the untreated and treated biochar, indicating that the alkali modification did not significantly change the structure of organic functional groups. FTIR spectra are shown in Fig. 1, the spectra of BC and Pre-BC showed similar profiles, which meant that the functional groups were not significantly changed by the alkali pretreatment. The FTIR spectrum of Post-BC was obviously changed at 3386, 2353, 1417, and 1039 cm−1, representing the functional groups of –OH, C![[triple bond, length as m-dash]](https://www.rsc.org/images/entities/char_e002.gif) C/C
C/C![[double bond, length as m-dash]](https://www.rsc.org/images/entities/char_e001.gif) C
C![[double bond, length as m-dash]](https://www.rsc.org/images/entities/char_e001.gif) C, CO32−, and C–O–C, respectively.19,29,30 The ash content of Post-BC (30.82%) was remarkably lower than those of Pre-BC (44.68%) and BC (43.57%). This could be ascribed to the release of internal volatile substances during the carbonization of biochar,29 however, the alkali post-treatment made part of the ash wash away. The main mineral compositions in ash are listed in Table 1, which suggested that different interactions occur, such as cation exchange and precipitation, between biochar and adsorbate.31 Details will be discussed in the section below.
C, CO32−, and C–O–C, respectively.19,29,30 The ash content of Post-BC (30.82%) was remarkably lower than those of Pre-BC (44.68%) and BC (43.57%). This could be ascribed to the release of internal volatile substances during the carbonization of biochar,29 however, the alkali post-treatment made part of the ash wash away. The main mineral compositions in ash are listed in Table 1, which suggested that different interactions occur, such as cation exchange and precipitation, between biochar and adsorbate.31 Details will be discussed in the section below.
| Biochar | BC | Pre-BC | Post-BC |
|---|---|---|---|
| C | 46.97% | 46.84% | 50.71% |
| O | 14.01% | 13.28% | 15.45% |
| H | 2.19% | 2.25% | 2.26% |
| N | 1.34% | 0.27% | 0.89% |
| Na | 0.01% | 0.05% | 0.01% |
| Mg | 0.11% | 0.14% | 0.14% |
| K | 4.97% | 0.25% | 1.26% |
| Ca | 2.27% | 4.09% | 2.55% |
| Al | 0.28% | 0.22% | 0.22% |
| Si | 4.03% | 3.32% | 3.28% |
| P | 0.51% | 0.17% | 0.50% |
| Mn | 0.75% | 0.99% | 1.18% |
| O/C | 0.30 | 0.28 | 0.30 |
| H/C | 0.05 | 0.05 | 0.04 |
| Ash | 43.57% | 44.68% | 30.82% |
| SBET (m2 g−1) | 3.76 | 110.16 | 84.83 |
| Average pore size (nm) | 11.06 | 4.60 | 5.87 |
| VBJH (cm3 g−1) | 0.02 | 0.15 | 0.14 |
Table 1 shows that the specific surface area, average pore size, and pore volume of alkali-modified biochar, coupled with the N2 adsorption/desorption isotherm (Fig. S1†), changed significantly. The specific surface areas of Pre-BC (110.16 m2 g−1) and Post-BC (84.83 m2 g−1) were about 29.30 and 22.56 times higher than that of BC (3.76 m2 g−1). The average pore size of Pre-BC and Post-BC decreased by 2.40 and 1.88 times, and the pore volume increased by 7.50 and 7.00 times. These results indicated the alkali modification could alter the porous structure from the macroscale to the mesoscale. The changes in the pore structure also could be observed in Fig. 2.
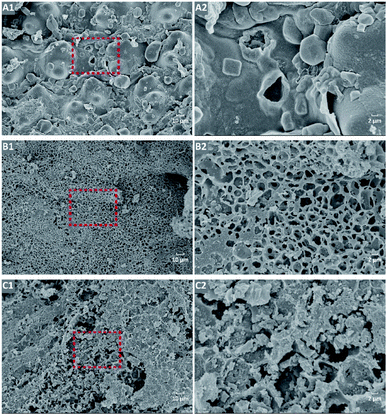 | ||
| Fig. 2 SEM spectra of BC, Pre-BC, and Post-BC. *5.0k magnification times: (A1) of BC, (B1) of Pre-BC, (C1) of Post-BC; *20.0k magnification times: (A2) of BC, (B2) of Pre-BC, (C2) of Post-BC. | ||
Adsorption performance
| Biochar | BC | Pre-BC | Post-BC | |
|---|---|---|---|---|
| Langmuir | Qmax | 20.59 | 28.37 | 8.06 |
| KL | 0.39 | 0.47 | 0.08 | |
| R2 | 0.998 | 0.994 | 0.947 | |
| Freundlich | KF | 4.441 | 8.133 | 1.800 |
| 1/n | 0.383 | 0.286 | 0.283 | |
| R2 | 0.783 | 0.457 | 0.833 | |
| Temkin | KT | 28.955 | 197.982 | 15.556 |
| RT/bT | 2.485 | 2.750 | 0.754 | |
| R2 | 0.978 | 0.877 | 0.791 |
| Biochar | BC | Pre-BC | Post-BC | |
|---|---|---|---|---|
| Pseudo-first-order | k1 | 0.002 | 7.570 | 4.244 |
| R2 | 0.814 | 0.770 | 0.571 | |
| Pseudo-second-order | k2 | 0.003 | 0.005 | 0.057 |
| R2 | 0.999 | 0.999 | 1.000 | |
| Elovich | α | 19.649 | 13363.918 | 44030796.643 |
| β | 0.478 | 0.820 | 4.762 | |
| R2 | 0.988 | 0.986 | 0.963 |
Quantification of the adsorption forces
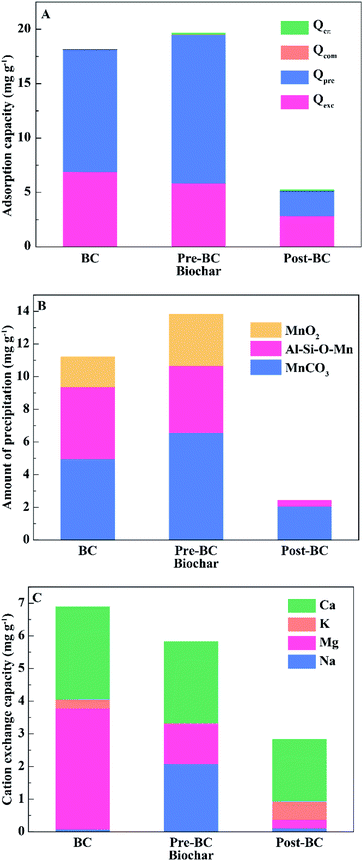
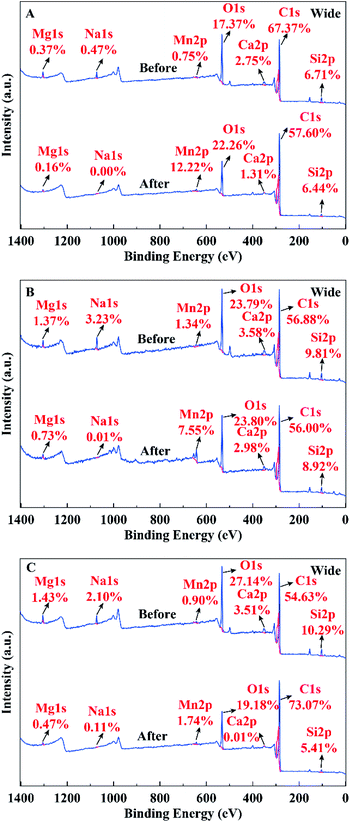
As shown in Fig. 5A, the alkali pre-modification increased the amount of precipitation, while the alkali post-modification decreased compared to the pristine biochar. This phenomenon was due to their different physicochemical properties responsible for forming precipitation. The types of precipitated particles indicated that carbonate and Si were correlated with the adsorption force of precipitation. As shown in Fig. 5B, the formation of MnCO3 could be ascribed to the precipitation, which was similarly approved by the removal of lead by using alkali lignin-derived biochar.19 The amount of carbonate formation in BC, Pre-BC, and Post-BC was 4.95, 6.56, and 2.05 mg g−1 (Fig. 5B), respectively. The intensity of carbonate peaks in the FTIR spectrum followed the order Pre-BC > BC > Post-BC (Fig. 1), which indicated that alkali pre-modification enhanced the adsorption performance of Mn2+ by increasing the carbonate concentration in biochar. Additionally, the amounts of Al–Si–Ox− formed in BC, Pre-BC, and Post-BC were 4.42, 4.09, and 0.39 mg g−1 (Fig. 5B), respectively, which matched with the sequence of Al and Si contents as BC > Pre-BC > Post-BC (Table 1). The elemental distribution in the XPS spectrum before and after adsorption was analysed. As displayed in Fig. 6A and B, the Si content was basically unchanged for BC and Pre-BC with the formation of Al–Si–O–Mn particles. However, the Si content was significantly decreased for Post-BC, which might result in the difficulty of forming similar precipitation particles (Fig. 6C). Therefore, the biochar prepared using the oxygen-limited pyrolysis process could fix silicon and aluminum to promote the adsorption of Mn2+. However, the alkali post-modification would wash away some of the minerals and reduced the stability of the combination between silica-alumina and biochar.
The amounts of the formed precipitate by MnO2 for BC and Pre-BC were 1.87 and 3.19 mg g−1, respectively, while Post-BC displayed less formation capacity (Fig. 5B). The formation of a small amount of MnO2 could be ascribed to the turbulence of the liquid during experimental operation since oxygen might dissolve in the liquid during agitation.44
It should be noted that the same ions of Na, Mg, K, and Ca displayed different exchange capacities in different biochars. As shown in Fig. 5C, the cation exchange of BC was mainly contributed by Mg2+ and Ca2+. As for Pre-BC, Mg2+, Na+ and Ca2+ played significant roles in the exchange with Mn2+. It was observed that Ca2+ was predominant for the cation exchange in Post-BC. This discrepancy among different biochar was attributed to the affinities between biochars and cations.
Conclusions
The existence of manganese ions in the drinking water reservoirs could pose potential threats to human health. In this study, biochar modified with alkali was applied to remove Mn2+ from water. Compared with the pristine biochar, alkali pre-modification biochar showed higher adsorption capacity and faster adsorption velocity, which could be used as an applicable material for Mn2+ removal from lakes and reservoirs. The maximum adsorption capacities for BC, Pre-BC, and Post-BC were 20.59, 28.37, and 8.06 mg g−1, respectively. The Langmuir isotherm model and the pseudo-second-order kinetic model were suitable fitting models to describe the adsorption process. It was revealed that the adsorption of Mn2+ by biochar was mainly contributed by cation exchange and precipitation. The precipitation of manganese minerals onto BC, Pre-BC, and Post-BC accounted for 62.95%, 69.35%, and 43.38%, of the total removal amount, and cation exchange accounted for 38.05%, 29.65%, and 53.79%, respectively, of the total. With regard to precipitation, the formation of MnCO3 and Al–Si–O–Mn was mainly driven by the precipitation of Mn2+ on the biochar surface. Alkali and alkaline earth metals facilitated the behavior of cation exchange, where the primary contributing ions for cation exchange were Na+, Mg2+ and Ca2+ during the adsorption process. The research outcomes were expected to provide methodological support for controlling manganese endogenous pollution for a safe drinking water supply.Author contributions
Jie Zhao: conceptualization, methodology, formal analysis, investigation, data curation, writing-original draft. Zhi-long Ye: project administration, funding acquisition, supervision, writing-review and editing. Xiaofang Pan: reviewing and editing. Guanjing Cai: methodology and software. Jiani Wang: formal analysis.Conflicts of interest
The authors declare that they have no known competing financial interests or personal relationships that could have appeared to influence the work reported in this paper.Acknowledgements
This work was supported by the China Central Government Guide Local Scientific and Technological Development Program of the Fujian Science and Technology Project (No. 2021L3026) and the European Union Horizon 2020 (No. 863000).References
- E. Bertone, R. A. Stewart, H. Zhang, M. Bartkow and C. Hacker, Environ. Model. Software, 2015, 73, 133–147 CrossRef.
- F. O. Ossa, A. Hofmann, J. E. Spangenberg, S. W. Poulton, E. E. Stueken, R. Schoenberg, B. Eickmann, M. Wille, M. Butler and A. Bekker, Proc. Natl. Acad. Sci. U. S. A., 2019, 116, 6647–6652 CrossRef CAS PubMed.
- Y. Chen, J. Long, S. Chen, Y. Xie, Z. Xu, Z. Ning, G. Zhang, T. Xiao, M. Yu, Y. Ke, L. Peng and H. Li, Sci. Total Environ., 2022, 805, 150237 CrossRef CAS PubMed.
- H. Yang, X. Tang, X. Luo, G. Li, H. Liang and S. Snyder, J. Hazard Mater., 2021, 415, 125707 CrossRef CAS PubMed.
- Q. An, C. Zhang, B. Zhao, Z. Li, S. Deng, T. Wang and L. Jin, Sci. Total Environ., 2021, 793, 148609 CrossRef CAS PubMed.
- A. D. Zand and M. R. Abyaneh, Sustain. Environ. Res., 2020, 30, 18 CrossRef.
- M. A. Embaby, S. M. Abdel Moniem, N. A. Fathy and A. A. El-Kady, Heliyon, 2021, 7, e08218 CrossRef PubMed.
- A. E. B. Mahdavi, E. Panahpour, R. J. Kalbasi and A. Gholami, Desalination Water Treat., 2021, 210, 316–329 CrossRef CAS.
- Y. Gao, X. Zhu, Q. Yue and B. Gao, J. Environ. Sci., 2018, 73, 185–194 CrossRef CAS PubMed.
- D. B. Pal, A. Singh, J. M. Jha, N. Srivastava, A. Hashem, M. A. Alakeel, E. F. Abd Allah and V. K. Gupta, Bioresour. Technol., 2021, 339, 125606 CrossRef CAS PubMed.
- H. Lu, L. Hu, W. Zheng, S. Yao and L. Qian, J. Cleaner Prod., 2020, 262, 121479 CrossRef.
- X. Fan, J. Zhang, Y. Xie, D. Xu, Y. Liu, J. Liu and J. Hou, Water Sci. Technol., 2021, 83, 1429–1445 CrossRef CAS PubMed.
- K. Luo, Y. Pang, D. Wang, X. Li, L. Wang, M. Lei, Q. Huang and Q. Yang, J. Environ. Sci., 2021, 108, 201–216 CrossRef CAS PubMed.
- C. Wu, L. Li, H. Zhou, J. Ai, H. Zhang, J. Tao, D. Wang and W. Zhang, J. Environ. Sci., 2021, 100, 340–352 CrossRef CAS PubMed.
- H. Chen, F. Xu, Z. Chen, O. Jiang, W. Gustave and X. Tang, J. Environ. Sci., 2020, 96, 186–193 CrossRef PubMed.
- B. Hu, Y. Ai, J. Jin, T. Hayat, A. Alsaedi, L. Zhuang and X. Wang, Biochar, 2020, 2, 47–64 CrossRef.
- W. H. Huang, D. J. Lee and C. Huang, Bioresour. Technol., 2021, 319, 124100 CrossRef CAS PubMed.
- L. Sui, C. Tang, Q. Du, Y. Zhao, K. Cheng and F. Yang, J. Environ. Sci., 2021, 106, 116–123 CrossRef CAS PubMed.
- F. Wu, L. Chen, P. Hu, Y. Wang, J. Deng and B. Mi, Bioresour. Technol., 2021, 322, 124539 CrossRef CAS PubMed.
- L. Wang, Y. Wang, F. Ma, V. Tankpa, S. Bai, X. Guo and X. Wang, Sci. Total Environ., 2019, 668, 1298–1309 CrossRef CAS PubMed.
- A. Peter, B. Chabot and E. Loranger, J. Environ. Manage., 2021, 290, 112569 CrossRef CAS PubMed.
- Q. An, Y. Miao, B. Zhao, Z. Li and S. Zhu, Mater. Chem. Phys., 2020, 248, 122895 CrossRef CAS.
- X. Cui, S. Fang, Y. Yao, T. Li, Q. Ni, X. Yang and Z. He, Sci. Total Environ., 2016, 562, 517–525 CrossRef CAS PubMed.
- L. Y. Gao, J. H. Deng, G. F. Huang, K. Li, K. Z. Cai, Y. Liu and F. Huang, Bioresour. Technol., 2019, 272, 114–122 CrossRef CAS PubMed.
- Z. Wang, G. Liu, H. Zheng, F. Li, H. H. Ngo, W. Guo, C. Liu, L. Chen and B. Xing, Bioresour. Technol., 2015, 177, 308–317 CrossRef CAS PubMed.
- A. Li, Y. Zhang, W. Ge, Y. Zhang, L. Liu and G. Qiu, Bioresour. Technol., 2021, 347, 126425 CrossRef PubMed.
- K. Iamsaard, C. H. Weng, L. T. Yen, J. H. Tzeng, C. Poonpakdee and Y. T. Lin, Bioresour. Technol., 2022, 344, 126131 CrossRef CAS PubMed.
- Y. Xu and B. Chen, J. Soils Sediments, 2015, 15, 60–70 CrossRef CAS.
- Z. Z. Chowdhury, M. R. Hasan, S. B. Abd Hamid, E. M. Samsudin, S. M. Zain and K. Khalid, RSC Adv., 2015, 5, 6345–6356 RSC.
- J. Kończyk, K. Kluziak and D. Kołodyńska, J. Environ. Manage., 2022, 313, 114958 CrossRef PubMed.
- L. Gao, Z. Li, W. Yi, L. Wang, P. Zhang, Z. Wan and Y. Li, J. Cleaner Prod., 2021, 325, 129328 CrossRef CAS.
- U. Tyagi, Bioresour. Technol., 2022, 345, 126475 CrossRef CAS PubMed.
- A. Youngwilai, P. Kidkhunthod, N. Jearanaikoon, J. Chaiprapa, N. Supanchaiyamat, A. J. Hunt, Y. Ngernyen, T. Ratpukdi, E. Khan and S. Siripattanakul-Ratpukdi, Sci. Total Environ., 2020, 713, 136708 CrossRef CAS PubMed.
- J. Chwastowski, D. Bradło and W. Żukowski, Materials, 2020, 13, 2782 CrossRef CAS PubMed.
- Y. S. Ho, J. Hazard Mater., 2006, 136, 681–689 CrossRef CAS PubMed.
- H. Qiu, L. Lv, B. C. Pan, Q. J. Zhang, W. M. Zhang and Q. X. Zhang, J. Zhejiang Univ., Sci., A, 2009, 10, 716–724 CrossRef CAS.
- G. M. Al-Senani and F. F. Al-Fawzan, Egypt. J. Aquat. Res., 2018, 44, 187–194 CrossRef.
- H. N. Tran, S. J. You, A. Hosseini-Bandegharaei and H. P. Chao, Water Res., 2017, 120, 88–116 CrossRef CAS PubMed.
- M. C. Biesinger, B. P. Payne, A. P. Grosvenor, L. W. M. Lau, A. R. Gerson and R. S. C. Smart, Appl. Surf. Sci., 2011, 257, 2717–2730 CrossRef CAS.
- Y. H. Fei, Z. Zhang, Z. Ye, Q. Wu, Y. T. Tang and T. Xiao, J. Environ. Sci., 2022, 113, 64–71 CrossRef PubMed.
- F. Huang, L. Y. Gao, R. R. Wu, H. Wang and R. B. Xiao, Sci. Total Environ., 2020, 731, 139163 CrossRef CAS PubMed.
- H. Seyama and M. Soma, J. Chem. Soc. Faraday Trans. I, 1985, 81, 485–495 RSC.
- Z. Fan, Q. Zhang, M. Li, W. Sang, Y. Qiu, X. Wei and H. Hao, J. Cleaner Prod., 2020, 256, 120672 CrossRef CAS.
- M. Idrees, S. Batool, H. Ullah, Q. Hussain, M. I. Al-Wabel, M. Ahmad, A. Hussain, M. Riaz, Y. S. Ok and J. Kong, J. Mol. Liq., 2018, 266, 373–380 CrossRef CAS.
- H. Yankovych, V. Novoseltseva, O. Kovalenko, D. M. Behunova, M. Kanuchova, M. Vaclavikova and I. Melnyk, J. Environ. Manage., 2021, 292, 112757 CrossRef CAS PubMed.
Footnote |
| † Electronic supplementary information (ESI) available. See https://doi.org/10.1039/d2ra01720b |
| This journal is © The Royal Society of Chemistry 2022 |

