 Open Access Article
Effect of humic acid on phenanthrene removal by constructed wetlands using birnessite as a substrate†
Xiaotong Shena,
Jian Zhang *bc,
Huijun Xie
 d,
Shuang Liangc,
Huu Hao Ngoe and
Wenshan Guo
 e
e
aMedical Science and Technology Innovation Center, Shandong First Medical University & Shandong Academy of Medical Sciences, Jinan, Shandong 250117, China
bCollege of Safety and Environmental Engineering, Shandong University of Science and Technology, Qingdao 266590, China. E-mail: zhangjian00@sdu.edu.cn
cShandong Key Laboratory of Water Pollution Control and Resource Reuse, School of Environmental Science & Engineering, Shandong University, Qingdao 266237, China
dEnvironment Research Institute, Shandong University, Qingdao 266237, China
eSchool of Civil and Environmental Engineering, University of Technology Sydney, Broadway, NSW 2007, Australia
First published on 18th May 2022
Abstract
The binding of polycyclic aromatic hydrocarbons (PAHs) to humic acid (HA) can boost the complexation–flocculation process and promote pollutant oxidation through the role of HA as an electron shuttle. HA-coated biochar (BA) was added to study the effects of HA on phenanthrene (PHE) removal by constructed wetlands (CWs) using birnessite as a substrate. HA reduced the average PHE concentration of effluent by 26.58% due to its role as a complexing agent, based on Fourier-transform infrared spectroscopy analysis. For CWs with birnessite, the PHE removal performance was further enhanced due to the role of electron shuttles. X-ray photoelectron spectroscopy and illumina high-throughput analysis revealed an enhanced Mn–Fe cycle. The total relative proportions of Mn-oxidizing bacteria and iron-oxidizing bacteria in VFBCW-HA/BA were 2.33 and 5.50 times as high as those in VFBCW-BA and VFCW-HA/BA. Humic acid also accelerated the biodegradation of PAHs and the quantity of PAH degradative bacteria in VFBCW-HA/BA was 6.29 times greater than in VFBCW-BA.
1. Introduction
It is recognized that polycyclic aromatic hydrocarbons (PAHs) are a kind of widely present pollutant which are highly poisonous and have carcinogenic properties. Phenanthrene (PHE), a three-ring PAH, has been discovered to be a highly polluting substance in places polluted by coal tar and some nearby aqueous situations.1 Many researchers have picked PHE as the representative of PAHs based on its structural features of a bay-region and K-region that were closely related to the carcinogenic properties of PAHs.2 Constructed wetlands (CWs) have been widely used for alleviating contaminants in many kinds of wastewater by the integrated ecological effects of hydrophytes, soils or matrices, and microbes.3 The hydrophobic properties of PHE lead to its accumulation on the substrates of CWs.4 Substrates not only play an important role in pollutant immobilization, but also in the biodegradation of microbes attached to the substrate.5,6Manganese (Mn) oxides have been reported to be an effective kind of wetland substrate for pollutant removal, such as clarithromycin, chlorophene, diclofenac, and triclosan.7,8 Distributed widely and in high amounts in the environment, Mn oxides performed with good adsorptive capability and fixed pollutants could be removed by the following Mn cycle. Accompanying the process of electron transformation from pollutants to Mn oxides, Mn oxides are reduced. Then, with microbic extracellular electron transfer (EET) by Mn-oxidizing bacteria, the reduced states of Mn ore could subsequently be oxidized.9–11 However, the inefficient electron transformation caused by the high sensitivity of Mn oxides to the natural surrounding conditions and relative microbe compositions have limited the pollutant removal efficiency of wetlands systems modified by Mn ore-coated sands.12
Based on our previous study, artificial electron shuttles boosted the performance of CWs filled with Mn oxides by enhancing the electron transformation process of Mn oxides.13 However, the high costs and unknown toxicity of the synthetic mediator hinder its utilization. As a kind of natural electron shuttle, humic acid (HA) has an important influence on the performance of natural ecosystems. It has been demonstrated that HA could boost the EET process of microbes based on its role as an electron shuttle. HA can be reduced by receiving electrons from some microorganisms that have the ability for EET, such as Mn-oxidizing bacteria, iron-oxidizing microbes, iron-reducing bacteria, archaea, and denitrificans. The reduced HA donates electrons to soils/ores and electron acceptors and goes back to oxidized HA.14–16 This redox chemistry of HA could allow it to serve as an electron shuttle for accelerating the Mn or Fe cycle.17 What is more, HA has recently been regarded as an effective biostimulation method to accelerate the bioremediation of hydrophobic organic contaminants (HOCs). The biodegradation of PAHs can be accelerated by increasing their surface solubility and disseminative mass transfer, which could promote their availability to microorganisms.1,18 Hence, it seems likely that HA can not only combine with PAHs to decrease the freely dissolved concentrations and increase the biodegradation rates, but could also serve as a catalyst in the oxidation of pollutants by Mn oxides. In addition, the coated surface may perform with different physicochemical characteristics and adsorption properties for various pollutant substances due to the formation of an HA cladding.19–21 HA may have an obvious influence on pollutant removal in CWs filled with Mn oxide-coated sands, for both common contaminants and organic pollutants.
The formation of HA cladding is based on the strong affinity of HA to surrounding solid matter, such as ores and carbons, resulting in the existence of a form of solid-phase humic acid in the natural environment.21,22 Thus, it is more meaningful to study the effect of HA adlayers on pollutant removal by CWs. Biochar (BA) was chosen to be the HA support, based on its well-developed porosity and high surface area, especially its extensive application in sewage treatment.23
In this study, HA-embedded biochar (HA/BA) was added to CW units with or without birnessite to explore the effect of HA on the removal of phenanthrene (PHE), which served as a typical PAH. The aims of this research were: (1) to study the pollutant removal performance for PHE and common contaminants by different defined wetland systems under the addition of HA-embedded carbon; (2) to examine the effect of HA/BA for catalyzing Mn ore oxidization and promoting the cycling of Mn; (3) to reveal the influence of HA on PHE microbial degradation by CWs.
2. Materials and methods
2.1 Preparation and characterization of the materials
Birnessite-coated sand was synthesized using acid-washed sand and potassium permanganate according to a previous method.8 BA was prepared according to a previous study using Arundo donax as a precursor.13 The physicochemical properties of BA were: specific surface area (SBET) of 1272.67 m2 g−1, porosity of 0.4, average pore size of 8.18 nm and the total pore volume (Vtot) of 1.02 cm3 g−1. The chemical composition of BA is given in Table S1.† HA/BA was prepared by coating BA with HA at a mass ratio of 1![[thin space (1/6-em)]](https://www.rsc.org/images/entities/char_2009.gif) :
:![[thin space (1/6-em)]](https://www.rsc.org/images/entities/char_2009.gif) 40. 15.0 g of BA was added to a 500 mL beaker with enough 750 mg L−1 HA solution to ensure full immersion. It was mixed and the mixed solution was left for 14 days according to ref. 24. The material was then collected on a 0.45 μm Millipore Teflon filter and twice washed with deionised water and filtered. The collected material after intensive drying was collected for future use and named HA/BA. X-ray photoelectron spectrometry (XPS) was carried out on a Thermo ESCALAB 250XI. The surface morphology was determined using a scanning electron microscope (SEM, Hitachi SU-8010, Japan) and nano-mechanical studies were conducted using an atomic force microscope (MFP-3D infinity). The reaction mechanism on the materials surface was further studied by Fourier-transform infrared (FTIR) spectroscopy.
40. 15.0 g of BA was added to a 500 mL beaker with enough 750 mg L−1 HA solution to ensure full immersion. It was mixed and the mixed solution was left for 14 days according to ref. 24. The material was then collected on a 0.45 μm Millipore Teflon filter and twice washed with deionised water and filtered. The collected material after intensive drying was collected for future use and named HA/BA. X-ray photoelectron spectrometry (XPS) was carried out on a Thermo ESCALAB 250XI. The surface morphology was determined using a scanning electron microscope (SEM, Hitachi SU-8010, Japan) and nano-mechanical studies were conducted using an atomic force microscope (MFP-3D infinity). The reaction mechanism on the materials surface was further studied by Fourier-transform infrared (FTIR) spectroscopy.
2.2 Experimental system setup
Eight lab-scale vertical flow constructed wetland (VFCW) systems were divided into four groups, biochar-based CW (VFCW-BA), biochar–birnessite-based CW (VFBCW-BA), HA/BC-based CW (VFCW-HA/BA) and HA/BC-birnessite-based CW (VFBCW-HA/BA), operated side by side under natural conditions in Jinan, China. The CW units were made from organic glass of 75 cm height and 12 cm inside diameter. Gravel (1–3 cm) was used to fill the bottom of the reactors to a height of 15 cm. Silica sand (3–5 mm) was well washed and prepared for the modified layer to a height of 15 cm to 50 cm above the bottom. Differently designed substrates were used for padding depending on the kinds of biochar and the addition of birnessite-coated sand. For a height of 50 cm to 60 cm above the bottom, a sand layer (1–2 mm) was designed to support a plant. A schematic diagram of the experimental setup is provided in Fig. S1.† The added capacities of birnessite-coated sand and biochar were 2 L and 1 L, respectively, with a volume ratio of 2. Iris pseudacorus was selected as the experimental plant and cultivated in 10% Hoagland solution before being transplanted into these wetland systems. When the plants were well grown, they were planted into the sand layer at a planting density of six plants per unit. A punched PVC pipe of 70 cm in height and 2 cm in diameter with gauze was inserted into the systems to simplify the sampling of the matrix and the filling mode inside the PVC tube was the same as that outside.2.3 Experimental procedure
The VFCW units were fed with activated sludge for one month before the experiment began. When the Iris pseudacorus and microbes were well set up, synthetic wastewater was added and the water feeding pattern was from top to bottom. The synthetic wastewater was prepared from tap-water by adding glucose, (NH4)2SO4, KNO3, CaCl2, KH2PO4, MgSO4 and FeSO4·7H2O. A dichloromethane solution of PHE (1 mg mL−1) was made and mixed with synthetic wastewater to reach an influent concentration of PHE of 0.3 mg L−1. Each wetland reactor was experimented with at an HRT of 3 days. There were two stages during the whole running period: the start-up stage and the stabilized stage.2.4 Sample collection and analysis
3. Results and discussion
3.1 Variation in pollutant removal efficiencies in CWs
Fig. 1 shows the contaminant removal efficiencies (PHE, TN, NH4+–N and NO3−–N) of wetland units with different substrates. The variations in COD concentrations in influent and effluent are also given in Fig. S1.† The start-up stage and stabilized stage could be used to describe the whole experimental period. The average influent concentration of PHE was 283.87 μg L−1, and the PHE removal efficiencies of VFCW-BA, VFBCW-BA, VFCW-HA/BA and VFBCW-HA/BA were 63.23%, 73.71%, 73.00% and 82.03%, respectively. HA decreased the average PHE concentration of the effluent from 104.37 μg L−1 (VFCW-BA) to 76.63 μg L−1 (VFCW-HA/BA). The reason for this phenomenon may be that HA can be used as a complexing agent to remove hydrophobic contaminants from water by a complexation–flocculation process.27,28 Humic acid can also promote the biological degradation of PAHs by enhancing the surface solubility and disseminative mass transfer and then facilitate the bio-availability.29,30 With the presence of birnessite, the enhanced effect of HA on PAH removal was greater, which may be attributed to the catalytic mechanism via the role of HA as an electron shuttle.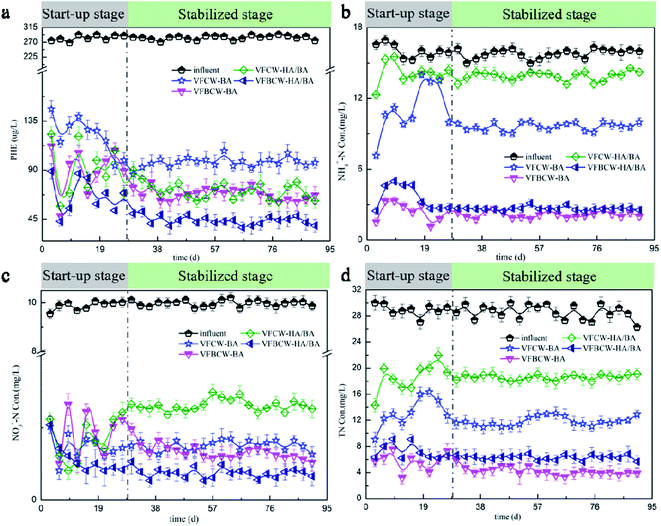 | ||
| Fig. 1 The influent and effluent concentrations of PHE (a), NH4+–N (b), NO3−–N (c) and TN (d) in different CWs over the whole experimental period. | ||
During the experimental period, different CW units performed with different removal efficiencies for N (Fig. 1b–d). Concentrations of TN, NH4+–N and NO3−–N in effluents were reduced in the laboratory stage and gradually reached a plateau in all wetland units. In this study, the NO3−–N influent average concentration was 9.95 mg L−1 for synthetic wastewater. The average effluent concentrations of NO3–N were 0.74, 0.82, 1.17 and 0.43 mg L−1 for VFCW-BA, VFBCW-BA, VFCW-HA/BA and VFBCW-HA/BA, respectively. The CW system with biochar could realize more than 88% efficient removal of NO3–N for each CW. For CW units without Mn oxides, HA inhibited the removal of NO3–N. However, for CWs using Mn oxide-coated sand as substrate, HA had a positive effect and the effluent concentration of NO3–N decreased by 47.56%. This may be attributed to the positive effect of HA on Mn oxidation. It was found that HA had an inhibiting effect on NH4+–N removal. The average effluent concentrations of NH4+–N were 10.06, 2.23, 13.97 and 4.15 mg L−1 for VFCW-BA, VFBCW-BA, VFCW-HA/BA and VFBCW-HA/BA, respectively. HA fixed on biochar occupied adsorption sites, covered the surface and blocked the pores of biochar, causing the weakened adsorption by biochar of NH4+–N.31 Synthetically, HA had an adverse impact on TN removal. For a TN influent concentration of 28.68 mg L−1, the removal efficiencies were 57.26%, 83.67%, 35.13% and 40.7% for VFCW-BA, VFBCW-BA, VFCW-HA/BA and VFBCW-HA/BA, respectively. The increased proportion of effluent TN caused by HA decreased from 51.79% to 40.81%. It was found that the usage of birnessite could effectively weaken the inhibiting effect of HA for N removal in CWs.
EEM fluorescence spectroscopy was performed to measure the dissolved organic matter (DOM) in the CWs and the results are shown in Fig. S2.† The fluorescence locations, identified EEMs and organic matter are shown in Table S2.† Peak A showed the maximum fluorescence at 229 nm/343 nm (Ex/Em) that belonged to a tryptophan-like substance. The strongest fluorescence degree of peak C was at 220/300 nm, that could be classified as a tyrosine like substance.32,33 Tryptophan-like substances and tyrosine-like substances are usually found in polluted natural waters and sewage treatment works, a decrease in which could be regarded as organic pollutant destruction in wetlands.34 It was found that CWs with birnessite showed relatively weaker fluorescence intensities, indicating better performance of organic pollutant removal. Peak B (224–278/309–313 nm) was identified as readily biodegradable substances, such as amino acids and proteins.35 Peak D (250/400 nm) is usually associated with humic matter and high molecular weight UVC humic-like components.26,36 The occurrence of peak D in VFBCW-HA/BA may indicate better microorganism action.
3.2 Characteristics of wetland substrates
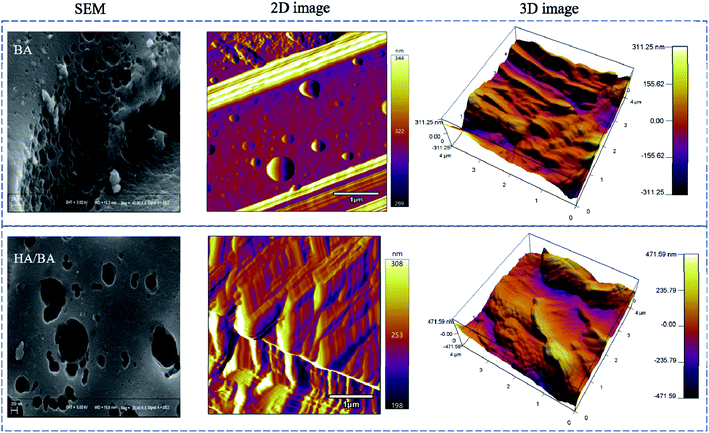
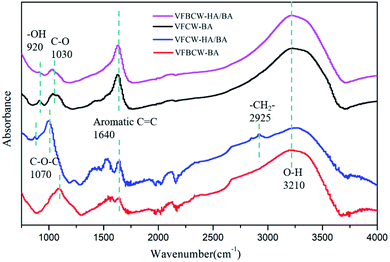
SEM and AFM images were detected and are shown in Fig. 2. It was found that bare BA was relatively slippery and homogeneous with small holes, and huge holes appeared on the surface due to the loading of macromolecular HA with colloidal properties of binding and aggregation.37 AFM images gave the surface information that the BA surface was rougher with a coverage of HA. A cladding of giant molecules with granules and networks blanketed the surfaces. The results of AFM topographic and phase images were similar to previous studies for HA adlayers on other artificial surfaces.38,39 It has been reported that for the generation of HA cladding, two steps are involved. A monolayer of HAs first formed on the material surface by an anabolic effect, and then the HA molecules were polymerized through intermolecular hydrophobic interactions.40 The increased thickness of the samples according to the height profile analysis of AFM gave the HA cladding thickness data (ca. 20 nm). The electrochemical properties of HA/BA were also characterized by the cyclic voltametric response. As shown in Fig. S4,† there were no highly reversible redox peaks of HA/BA. The electric capacity of HA/BA was 0.013 F, obtained by calculation from the cyclic voltammetry curve, offered by the binary electrical layers of ion electrolyte formed in the electrode material pores.41To study the architectural features of different CW substrates, FTIR spectroscopy analysis was determined and is shown in Fig. 3. The main absorbance bands in the FTIR spectra and their assignments are shown in Table S3.†
Typical FTIR spectroscopy responses of an aromatic nucleus could be seen. Peaks at 1640 and 1500 cm−1 in the spectra indicated the C![[double bond, length as m-dash]](https://www.rsc.org/images/entities/char_e001.gif) C and C
C and C![[double bond, length as m-dash]](https://www.rsc.org/images/entities/char_e001.gif) O, respectively, of the aromatic nucleus.42 It is obvious that the substrates of VFBCW-HA/BA showed relatively high intensities and better resolution for these peaks, indicating a better combination of substrates and PAH, in accord with the complexation–flocculation process between HA and PAH.43 HA has abundant functional groups, such as –OH, R–OH, phenolichydrazine-type –C
O, respectively, of the aromatic nucleus.42 It is obvious that the substrates of VFBCW-HA/BA showed relatively high intensities and better resolution for these peaks, indicating a better combination of substrates and PAH, in accord with the complexation–flocculation process between HA and PAH.43 HA has abundant functional groups, such as –OH, R–OH, phenolichydrazine-type –C![[double bond, length as m-dash]](https://www.rsc.org/images/entities/char_e001.gif) O and ketone-type –C
O and ketone-type –C![[double bond, length as m-dash]](https://www.rsc.org/images/entities/char_e001.gif) O. They could form interactions with active contaminants and organic substances in the environment.44 The sharp and strong bands around 3210 and 1030 cm−1 are due to the OH stretching of water and C–O–C stretching. It is worth noting that the peak at around 920 cm−1 was attributed to the stretching of radical groups on birnessite vacancies, such as OH. Moreover, small peaks at 2935 cm−1 (C–H stretching of –CH2 and –CH3) and 1240 cm−1 (C–O–C) could also be noted.45
O. They could form interactions with active contaminants and organic substances in the environment.44 The sharp and strong bands around 3210 and 1030 cm−1 are due to the OH stretching of water and C–O–C stretching. It is worth noting that the peak at around 920 cm−1 was attributed to the stretching of radical groups on birnessite vacancies, such as OH. Moreover, small peaks at 2935 cm−1 (C–H stretching of –CH2 and –CH3) and 1240 cm−1 (C–O–C) could also be noted.45
3.3 Mn/Fe transformation with HA
To reveal the element cycle, XPS analyses were used to demonstrate the main elements, with elemental spectra before and after the experiment. A peak table of relative contents (%) of the main elements for untreated substrates and substrates of different CW units after the experiment is shown in Table 1. It was found that the relative content of Mn in VFBCW-HA/BA was 4.16 times more than that in VFBCW-BA. Mn(II) was formed as a reduction product of Mn oxide in a redox reaction. Mn(II) were first fixed on the surface of birnessite and then released into the water as Mn2+ when they reached saturation point.9,10 The release of Mn2+ caused a decrease in Mn element after the experiment. During the whole experiment, we detected the Mn2+ concentrations in the final outlet every 15 days. The Mn2+ concentrations were all below 0.05 mg L−1, which were lower than the national standard for drinking water in China (0.10 mg L−1).46 The possible reason why HA increased the contents of Mn element of the substrate after the experiment may be that HA could serve as an electron acceptor for microbes that could oxidize Mn(II) back to highly-charged Mn.47 The appearance of Fe element in the substrates indicated the occurrence of an Fe cycle based on Fe2+ in the synthetic influent.| Sample | C | N | O | Mn | Fe |
|---|---|---|---|---|---|
| VFBCW-BA | 61.82 | 4.15 | 28.01 | 4.3 | 0.35 |
| VFCW-HA/BA | 57.54 | 5.29 | 32.36 | 0 | 0.9 |
| VFBCW-HA/BA | 27.35 | 1.67 | 50.03 | 17.9 | 0.82 |
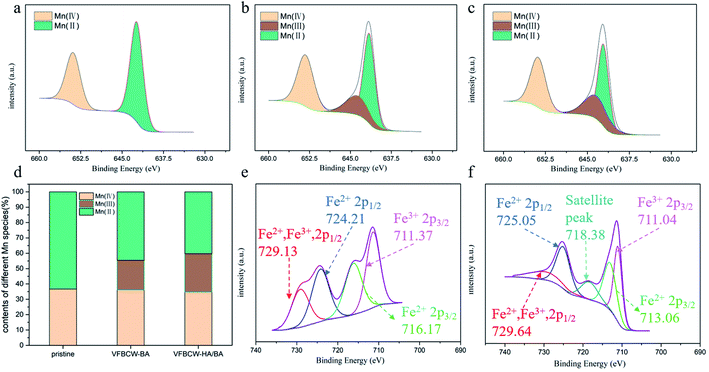
To study the process of Mn/Fe oxidation reduction cycles, average Mn oxidation states (Mn AOS), compositions of different Mn and Fe components and XPS binding energy analyses of Mn 2p, Mn 3s and Fe 2p are given in Fig. 4 and S4.† Based on the results of the Mn 2p core-level spectra and the contents of various Mn species (Fig. 4a–d), it was found that birnessite contained multivalent manganese both before and after the experiment. The proportion of high-state components Mn(III) and Mn(IV) increased to 51.05% and 62.94% in VFBCW-BA and VFBCW-HA/BA respectively, leading to better ability to remove organic matter. Compared with the pristine material, the appearance of Mn(III) gave the material better interaction with organic pollutants based on faster ligand exchange and higher redox potential.48 The splitting energy in the multiplet split Mn 3s region (Fig. S4 and Table S4†) indicates the Mn AOS values.49 The Mn MOS numbers, which have a positive relationship with the reaction rate, in VFBCW-BA and VFBCW-HA/BA were found to be 1.01 and 1.10 times greater than for the pristine material.
Fig. 4e and f show the Fe 2p spectrum, which can also be deconvoluted into five peaks at around 711.0, 713.1, 718.4, 725.1 and 729.6 eV. The photoelectron peaks at 729.6 eV can be assigned to the binding energies of 2p1/2 of Fe2+ and Fe3+, and the peaks at 725.1 eV correspond to the binding energies of 2p1/2 of Fe2+.50 The peaks at 713.1 and 711.0 eV indicate the 2p3/2 of Fe2+ and Fe3+, respectively. The peak at 718.4 eV illustrates the coexistence of Fe(II) and Fe(III) in the substrate.51 There was only Fe2+ in the synthetic influent before the experiment, while after the experiment Fe(II) and Fe(III) coexisted in the substrate. It could be concluded that the Fe cycle had indeed occurred in VFCW-HA/BA and VFBCW-HA/BA.
3.4 Microbial performance in CWs
Analysis of the microbial community in different CW substrates was well done by high-throughput sequencing analysis. The microbial quantity and diversity of bacteria in the substrates of different CWs are presented in Table S5.† The OTU numbers in VFCW-HA/BA and VFBCW-HA/BA were 64.67% and 59.96%, respectively, higher than for VFBCW-BA. While the diversity of bacteria was diminished, which may be caused by the selectivity for microorganisms by HA.To analyze the bacterial function and community structure thoroughly, Tax4Fun and genus evolutionary tree analysis were performed and are presented in Fig. 5. As shown in Fig. 5a, the main functional structures of the microbial communities were chemoheterotrophy, iron respiration, nitrite denitrification, nitrate denitrification, nitrate reduction, nitrate respiration and aromatic compound degradation, revealing the main metabolic processes of the iron cycle, chemoheterotrophy and the micro-biological degradation of nitrate nitrogen and PHE. As shown in Fig. 5b, the genus evolutionary tree at the phylum level gave the different bacterial compositions of the substrates in different CWs. Proteobacteria, Bacteroidota, Chloroflexi, Acidobacteriota and Verrucomicrobiota mainly dominated the microflora, accounting for 67.43% (VFBCW-BA), 50.82% (VFCW-HA/BA), and 80.44% (VFBCW-HA/BA), respectively, which were similar to the dominant microbial species in natural and constructed wetlands in previous studies.52 Proteobacteria are often used to indicate organic pollutant degradation.53 It was found that Proteobacteria accounted for the highest proportions at the phylum level in all samples, especially for CWs with birnessite. The proportions of Proteobacteria in VFBCW-BA and VFBCW-HA/BA were 68.69% and 55.84%, respectively, more than that of VFCW-HA/BA. What is more, Proteobacteria could also indicate the process of nitrogen cycling and wastewater treatment, contributing to the removal of common contaminants.54 VFBCW-HA/BA performed with a relatively higher amount of particular microbes that could biodegrade PAH.55–57
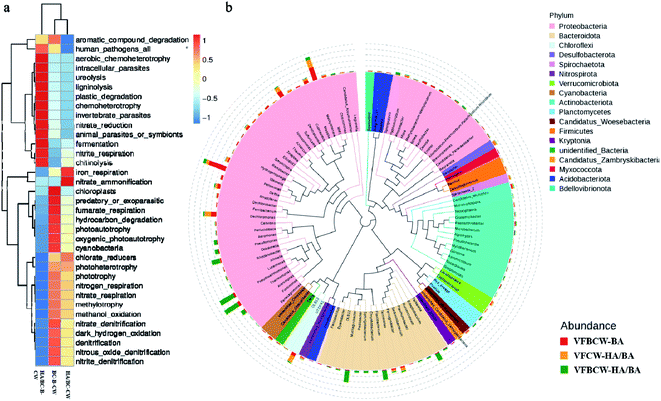 | ||
| Fig. 5 Metabolic functional diversity of bacterial community structure (a) and genus evolutionary tree of different groups (b). | ||
Microbial degradation and oxidative removal of PHE by the Mn–Fe cycle in the substrates were the main removal pathway of PAH in these CW units. Mn-oxidizing bacteria and iron-oxidizing bacteria that could oxidize low-charged components of Mn and Fe back to high-charged components, play the predominant role in the Mn/Fe cycle in CW units. To reveal the performance of wetland microorganisms on PAH removal, the diversities and proportions of Mn-oxidizing bacteria, iron-oxidizing bacteria and PAH-degrading microbes are shown in Fig. 6.
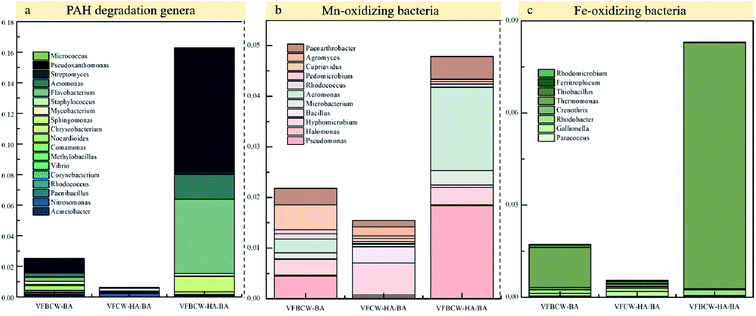 | ||
| Fig. 6 Relative abundances of PAH degradation genera (a), Mn-oxidizing bacteria (b) and Fe-oxidizing bacteria (c) in the substrates of different CW units. | ||
It has been reported that many microbes could realize PAH biodegradation such as Flavobacterium, Acinetobacter, Rhodococcus, Corynebacterium, Vibrio, Methylobacillus, Comamonas, Nocardioides, Chryseobacterium, Sphingomonas, Mycobacterium, Paenibacillus, Staphylococcus, Nitrosomonas, Aeromonas, Streptomyces, Pseudoxanthomonas and Micrococcus.55–57 The relative abundance of PAH-degrading microbes in VFBCW-HA/BA was dramatically higher than that in VFBCW-BA or VFCW-HA/BA, which may be attributed to the combined effects of HA and birnessite. The biodegradation of PAHs can be accelerated by HA through increasing the surface solubility and disseminative mass transfer, which could promote their availability to microorganisms.58 The molecular form of HA has been described as a micellar microstructure similar to surfactants, which can incorporate dissolved PAHs.59 The addition of HA may be attributed to effective biostimulation to accelerate the bioremediation of PAH. The PAH micro-biological degradation was enhanced under better reaction conditions improved by the favourable adsorption ability of birnessite.7
The total relative proportions of Mn-oxidizing bacteria and iron-oxidizing bacteria were both highest in VFBCW-HA/BA. VFBCW-HA/BA and VFBCW-BA have 4.79% and 2.18% relative abundances rates of Mn-oxidizing bacteria, respectively, compared to 1.55% for VFCW-HA/BA. Fe-oxidizing bacteria in VFBCW-HA/BA accounted for 8.31% of all detected microbic species, which was 4.80 and 15.12 times as many as that of VFBCW-BA and VFCW-HA/BA. It could be concluded that the introduction of HA boosted the Mn/Fe cycle in CWs with birnessite.
3.5 Proposed mechanisms of HA for PHE removal
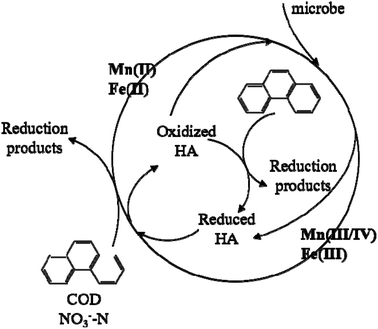
Fig. 7 illustrates the proposed mechanisms of HA for the enhanced Mn–Fe cycle and pollutant removal in CWs with Mn oxides. HA could first immobilize PHE through a complexation–flocculation process and then serve as an electron shuttle to enhance the oxidation of PHE. HA accepts electrons from microbes and then transfers these electrons to Fe(III) or high-charged Mn and, meanwhile, it goes back to oxidized HA. This oxidized HA continues to serve as an electron acceptor to complete the cycle. It was found that HA also served as a terminal electron acceptor to boost the PHE degradation rate.60 Oxidized HA realized the oxidative removal of PHE in the same way as high-charged Mn–Fe oxides. COD and NO3−–N also acted as electron acceptors in the boosted process of the Mn–Fe cycle to realize enhanced removal.4. Conclusions
HA showed a dramatic influence on pollutant removal in CWs, for both common contaminants and organic pollutants. The average PHE concentration of effluent in VFCW-HA/BA was 26.58% lower than that of VFCW-BA, which could be attributed to the complexation–flocculation process by HA to enhance hydrophobic contaminant removal from water. With the presence of birnessite, HA could further enhance PHE removal due to its role as an electron shuttle. The enhanced Mn–Fe cycle was revealed by the results of XPS and analysis of Mn-oxidizing bacteria and iron-oxidizing bacteria. Humic acid also accelerated the biodegradation of PAHs and the relative abundance of PAH-degrading microbes in VFBCW-HA/BA was 6.29 times greater than that in VFBCW-BA. However, the occupation of the adsorption sites of substrates by HA inhibited the removal of N in CWs. The increased proportion of effluent TN caused by HA decreased from 51.79% to 40.81%. It was found that the usage of birnessite could effectively weaken the inhibiting effect of HA for N removal in CWs. The weakened adsorption ability of wetland substrates caused by the attachment of HA could be enhanced by the usage of birnessite.Conflicts of interest
There are no conflicts of interest to declare.Acknowledgements
This study was supported by the National Natural Science Foundation of China (No. 51978385, 51720105013), the Shandong Provincial Key Research and Development Program (Major Scientific and Technological Innovation Project) (No. 2019JZZY010411), the National Science Foundation for Distinguished Young Scholar of China (No. 51925803), and the Shandong University Interdisciplinary Research and Innovation Team of Young Scholars (2020QNQT20).References
- Y. Laor, W. J. Farmer, Y. Aochi and P. F. Strom, Water Res., 1998, 32, 1923–1931 CrossRef CAS.
- D. Ning, H. Wang, C. Ding and H. Lu, Biodegradation, 2010, 21, 889–901 CrossRef CAS PubMed.
- S. Zhang, H.-L. Song, X.-L. Yang, H. Li and Y.-W. Wang, Bioresour. Technol., 2018, 256, 224–231 CrossRef CAS PubMed.
- K. Bao, C. Zaccone, Y. Tao, J. Wang, J. Shen and Y. Zhang, Water Res., 2020, 168 Search PubMed.
- M. S. Fountoulakis, S. Terzakis, N. Kalogerakis and T. Manios, Ecol. Eng., 2009, 35, 1702–1709 CrossRef.
- V. R. Hill and M. D. Sobsey, Water Sci. Technol., 2001, 44, 215–222 CrossRef CAS.
- J. Jiang, Z. Wang, Y. Chen, A. He, J. Li and G. D. Sheng, Chemosphere, 2017, 170, 95–103 CrossRef CAS PubMed.
- H. Xie, Y. Yang, J. Liu, Y. Kang, J. Zhang, Z. Hu and S. Liang, Water Res., 2018, 143, 457–466 CrossRef CAS PubMed.
- M. Bloethe, A. Wegorzewsld, C. Mueller, F. Simon, T. Kuhn and A. Schippers, Environ. Sci. Technol., 2015, 49, 13080 CrossRef PubMed.
- J. Liang, Y. Bai, C. Hu and J. Qu, Water Res., 2016, 89, 252–260 CrossRef CAS PubMed.
- H. C. Zhang and C. H. Huang, Environ. Sci. Technol., 2003, 37, 2421–2430 CrossRef CAS PubMed.
- X. Zhang, T. Yu, X. Li, J. Yao, W. Liu, S. Chang and Y. Chen, Crit. Rev. Environ. Sci. Technol., 2019, 49, 1425–1475 CrossRef CAS.
- X. Shen, J. Zhang, H. Xie, Z. Hu, S. Liang, H. H. Ngo, W. Guo, X. Chen, J. Fan and C. Zhao, Ecotoxicol. Environ. Saf., 2020, 205, 111028–111036 CrossRef CAS PubMed.
- C. M. Martinez, L. H. Alvarez, L. B. Celis and F. J. Cervantes, Appl. Microbiol. Biotechnol., 2013, 97, 10293–10308 CrossRef CAS PubMed.
- F. R. Van der Zee and F. J. Cervantes, Biotechnol. Adv., 2009, 27, 256–277 CrossRef CAS PubMed.
- Y. Wang, C. Wu, X. Wang and S. Zhou, J. Hazard. Mater., 2009, 164, 941–947 CrossRef CAS PubMed.
- J. T. Nurmi and P. G. Tratnyek, Abstr. Pap. Am. Chem. Soc., 2000, 220, 312 Search PubMed.
- Y. Yang, N. Zhang, M. Xue, S. T. Lu and S. Tao, Environ. Pollut., 2011, 159, 591–595 CrossRef CAS PubMed.
- B. W. Bogan, W. R. Sullivan, K. H. Cruz, J. R. Paterek, P. I. Ravikovitch and A. V. Neimark, Environ. Sci. Technol., 2003, 37, 5168–5174 CrossRef CAS PubMed.
- Z. Hong, W. Chen, X. Rong, P. Cai, W. Tan and Q. Huang, Chem. Geol., 2015, 416, 19–27 CrossRef CAS.
- M. T. O. Jonker, A. M. Hoenderboom and A. A. Koelmans, Environ. Toxicol. Chem., 2004, 23, 2563–2570 CrossRef CAS PubMed.
- G. N. Kasozi, A. R. Zimmerman, P. Nkedi-Kizza and B. Gao, Environ. Sci. Technol., 2010, 44, 6189–6195 CrossRef CAS PubMed.
- C.-D. Dong, C.-W. Chen and C.-M. Hung, Bioresour. Technol., 2017, 245, 188–195 CrossRef CAS PubMed.
- F. Lian, B. Sun, X. Chen, L. Zhu, Z. Liu and B. Xing, Environ. Pollut., 2015, 204, 306–312 CrossRef CAS PubMed.
- F. W. Gilcreas, Health Lab. Sci., 1967, 4, 137–141 CAS.
- R. M. Cory and D. M. McKnight, Environ. Sci. Technol., 2005, 39, 8142–8149 CrossRef CAS PubMed.
- H. Y. N. Holman, K. Nieman, D. L. Sorensen, C. D. Miller, M. C. Martin, T. Borch, W. R. McKinney and R. C. Sims, Environ. Sci. Technol., 2002, 36, 1276–1280 CrossRef CAS PubMed.
- M.-C. Tejeda-Agredano, P. Mayer and J.-J. Ortega-Calvo, Environ. Pollut., 2014, 184, 435–442 CrossRef CAS PubMed.
- Y. Laor, P. F. Strom and W. J. Farmer, Water Res., 1999, 33, 1719–1729 CrossRef CAS.
- Y. Xie, Z. Gu, H. M. S. K. Herath, M. Gu, C. He, F. Wang, X. Jiang, J. Zhang and Y. Zhang, Chemosphere, 2017, 184, 482–488 CrossRef CAS PubMed.
- J. J. Pignatello, S. Kwon and Y. Lu, Environ. Sci. Technol., 2006, 40, 7757–7763 CrossRef CAS PubMed.
- E. Illes and E. Tombacz, J. Colloid Interface Sci., 2006, 295, 115–123 CrossRef CAS PubMed.
- D. D. Phong and J. Hur, Water Res., 2015, 87, 119–126 CrossRef CAS PubMed.
- X. Guo, X. He, H. Zhang, Y. Deng, L. Chen and J. Jiang, Microchem. J., 2012, 102, 115–122 CrossRef CAS.
- J. F. Hunt and T. Ohno, J. Agric. Food Chem., 2007, 55, 2121–2128 CrossRef CAS PubMed.
- K. R. Murphy, G. M. Ruiz, W. T. M. Dunsmuir and T. D. Waite, Environ. Sci. Technol., 2006, 40, 2357–2362 CrossRef CAS PubMed.
- A. Armanious, M. Aeppli and M. Sander, Environ. Sci. Technol., 2014, 48, 9420–9429 CrossRef CAS PubMed.
- G. Liu, E. Luais and J. J. Gooding, Langmuir, 2011, 27, 4176–4183 CrossRef CAS PubMed.
- Y. Yuan, X. Cai, Y. Wang and S. Zhou, Chem. Geol., 2017, 456, 1–9 CrossRef CAS.
- J. J. Xu, G. Wang, Q. Zhang, D. M. Zhou and H. Y. Chen, Electrochem. Commun., 2004, 6, 278–283 CrossRef CAS.
- W. Hou, Z. Lei, E. Hu, H. Wang, Q. Wang, R. Zhang and H. Li, Environ. Pollut., 2021, 285, 117230 CrossRef CAS PubMed.
- S. Amir, A. Jouraiphy, A. Meddich, M. El Gharous, P. Winterton and M. Hafidi, J. Hazard. Mater., 2010, 177, 524–529 CrossRef CAS PubMed.
- Y. Yang, W. Hunter, S. Tao and J. Gan, Environ. Sci. Technol., 2009, 43, 1852–1857 CrossRef CAS PubMed.
- S. Amir, M. Hafidi, G. Merlina and J. C. Revel, Process Biochem., 2005, 40, 1693–1700 CrossRef CAS.
- A. Jouraiphy, S. Amir, P. Winterton, M. El Gharous, J. C. Revel and M. Hafidi, Bioresour. Technol., 2008, 99, 1066–1072 CrossRef CAS PubMed.
- Y. Zhang, H. Zhu, U. Szewzyk, S. Lübbecke and S. Uwe Geissen, Chem. Eng. J., 2017, 317, 454–460 CrossRef CAS.
- I. Ali, C. Peng, Z. M. Khan, I. Naz, M. Sultan, M. Ali, I. A. Abbasi, T. Islam and T. Ye, J. Environ. Manage., 2019, 230, 128–150 CrossRef CAS PubMed.
- A. Schippers and B. B. Jorgensen, Geochim. Cosmochim. Acta, 2001, 65, 915–922 CrossRef CAS.
- Y. Zhu, X. Liang, H. Zhao, H. Yin, M. Liu, F. Liu and X. Feng, Anal. Methods, 2017, 9, 103–109 RSC.
- T. C. Lin, G. Seshadri and J. A. Kelber, Appl. Surf. Sci., 1997, 119, 83–92 CrossRef CAS.
- S. Wang, X. Yan, K.-H. Wu, X. Chen, J.-M. Feng, P. Lu, H. Feng, H.-M. Cheng, J. Liang and S. X. Dou, Carbon, 2019, 144, 798–804 CrossRef CAS.
- G. Ansola, P. Arroyo and L. E. Saenz de Miera, Sci. Total Environ., 2014, 473, 63–71 CrossRef PubMed.
- S. Rasalingam, R. Peng and R. T. Koodali, J. Nanomater., 2014, 2014, 617405–617447 Search PubMed.
- C. Militon, D. Boucher, C. Vachelard, G. Perchet, V. Barra, J. Troquet, E. Peyretaillade and P. Peyret, FEMS Microbiol. Ecol., 2010, 74, 669–681 CrossRef CAS PubMed.
- M. Ahmad, Q. Yang, Y. Zhang, J. Ling, W. Sajjad, S. Qi, W. Zhou, Y. Zhang, X. Lin, Y. Zhang and J. Dong, J. Hazard. Mater., 2019, 380, 120863–120872 CrossRef CAS PubMed.
- J. Li, C. Luo, G. Zhang and D. Zhang, Water Res., 2018, 144, 226–234 CrossRef CAS PubMed.
- K. Yuan, B. Chen, Q. Qing, S. Zou, X. Wang and T. Luan, Environ. Pollut., 2017, 230, 936–944 CrossRef CAS PubMed.
- N. Zhao, F. Ju, H. Pan, Z. Tang and H. Ling, Environ. Sci. Pollut. Res., 2020, 27, 25754–25765 CrossRef CAS PubMed.
- R. R. Engebretson and R. Vonwandruszka, Environ. Sci. Technol., 1994, 28, 1934–1941 CrossRef CAS PubMed.
- C. Ma, Y. Wang, L. Zhuang, D. Huang, S. Zhou and F. Li, J. Soils Sediments, 2011, 11, 923–929 CrossRef CAS.
Footnote |
| † Electronic supplementary information (ESI) available. See https://doi.org/10.1039/d1ra06927f |
| This journal is © The Royal Society of Chemistry 2022 |

