
 Open Access Article
 This Open Access Article is licensed under a Creative Commons Attribution-Non Commercial 3.0 Unported Licence
Ab initio investigation of electronic structure and optical properties of IrSn4†
Thi Ly Mai *ab and
Vinh Hung Tranc
*ab and
Vinh Hung Tranc
aSimulation in Materials Science Research Group, Science and Technology Advanced Institute, Van Lang University, Ho Chi Minh City, Vietnam. E-mail: maithily@vlu.edu.vn
bFaculty of Technology, Van Lang University, Ho Chi Minh City, Vietnam
cInstitute of Low Temperature and Structure Research, Polish Academy of Sciences, PO. Box 1410, 50-422 Wrocław, Poland. E-mail: V.H.Tran@intibs.pl
First published on 16th June 2022
Abstract
We have examined the electronic structure and optical properties of intermetallic IrSn4 for three polymorphic modifications, α-IrSn4, β-IrSn4, and γ-IrSn4, utilizing the first-principles PAW-PBEsol-GGA and FP-LAPW-LSDA methods. The obtained electronic structure data reveal clear-cut differences between α-IrSn4 and the remaining morphs. This observation may be used to explain the appearance of superconductivity in β-IrSn4, and also provides reasonable grounds to suspect eventual superconductivity in γ-IrSn4. Therefore, it is highly desirable to carry out extended measurements on γ-IrSn4 at lower temperatures.
1 Introduction
Nowadays, scientists in the field of modern physics are paying particular attention to issues around superconductors. Various studies have been carried out with the aim of figuring out the mechanism of superconductivity in unconventional, as well as conventional, superconductors, and finally procuring room temperature superconductors.1,2 Commonly, superconductivity may appear in a material if there are suitable circumstances, for example pressure, magnetic field, temperature, or chemical doping. So, this became to us the important query: what underlying physics lie behind the superconductivity which exists in one morph but not in others?In this work, by means of first-principles calculations, we study the electronic structure and optical properties of intermetallic IrSn4. The existence of this compound was reported for the first time by Lang and Jeitschko.3 The material was found to crystallize in a trigonal structure (no. P3121), and is denoted by α-IrSn4 as a low-temperature morph. After that, Nordmark et al.4 identified a tetragonal form (no. I41/acd) at high temperature and denoted it as β-IrSn4. Based on the projector-augmented-wave method, the authors ascertained that α-IrSn4 is more stable than β-IrSn4. It is known that IrSn4 can occur in the orthorhombic structure (no. Ccca), denoted as γ-IrSn4. This morph was announced by the two groups of Larchev et al.5 and Künnen et al.,6 who studied the crystal structure of IrSn4 under a high pressure of 6 GPa.
It was surprising enough that superconductivity in the β-IrSn4 phase was observed by Tran et al.7 Based on experimental data, the authors suggested that the presence of superconductivity in β-IrSn4 is due to a weak electron–phonon pairing, even if the possible existence of d-electrons favors strong correlation.7 The discovery of superconductivity in β-IrSn4 invites further investigation, not only due to the fact that strong correlations are often the origin of many interesting physical phenomena in materials, such as metal–insulator transitions, magnetic ordering, and superconductivity,8,9 but also owing to the need to answer some crucial questions, e.g.: (i) how does the strong electron correlation affect the superconductivity of β-IrSn4? (ii) Why the superconductivity is absent in the α-IrSn4 and γ-IrSn4 phases? To shed some light on these issues, we compared electronic structures and optical properties between three IrSn4 morphs. We used the projector-augmented-wave method (PAW),10 implemented in VASP code,11,12 to determine several quantities, such as the densities of states (DOS), partial densities of states, electronic band structures (EBS), Fermi surfaces (FS), and electron localization functions (ELFs) of the α-IrSn4, β-IrSn4, and γ-IrSn4 phases. Moreover, we applied the full-potential linearized augmented plane-wave (FP-LAPW) method, executed in ELK program,13 to determine the dielectric functions and optical conductivities of these compounds.
2 Computational details
To obtain an optimization of the crystal structure, we relaxed all the structural parameters, starting from the literature data given in Table 1.To achieve a geometry optimization, the calculation was conducted until the difference in energy between self-consistent loops was less than 10−5 eV and the force approximated 0.01 eV Å−1. Further self-consistent charge density calculations were limited by the plane wave basis set with an energy-cutoff of 210.86 eV. The muffin-tin radii of the atoms were assumed to be RIr = 2.600 (a.u) and RSn = 3.000 (a.u). We attempted to ascertain the most stable phase amongst the studied polymorphic compounds by a comparison of their total energy. The evaluation will be meaningful if calculations of energy are performed for systems containing similar numbers of atoms, and taking into account the same Monkhorst–Pack grids. The primitive cell of the β-IrSn4 phase comprises 40 atoms, therefore, we need to construct supercells for α and γ-IrSn4 to have comparable numbers of atoms. As a result, the supercells of the latter phases possess orthogonal structures of 30 and 40 atoms, respectively. The calculations have been done for a 4 × 4 × 2 grid including 12 k-points for all states. We will scrutinize the total energy per atom given in Table 2. For the electronic structure properties’ calculations, the Brillouin zone was sampled with a 6 × 6 × 4 Monkhorst–Pack grid including 72 k-points for the α-IrSn4 phase, 24 × 24 × 8 Monkhorst–Pack grid including 312 k-points for β-IrSn4, and 8 × 4 × 8 Monkhorst–Pack grid including 32 k-points for γ-IrSn4. The electronic band structure was investigated along the high-symmetry points Γ–M–K–Γ–A–L–H–A|L–M|H–K|Γ–M′–K′–Γ in α-IrSn4, Γ–X–P–N–Γ–M–S|S0–Γ|X–R|G–M in β-IrSn4, and Γ–X–S–Y–Γ–Z–U–R–T–Z|X–U|Y–T|S–R in γ-IrSn4, in line with proposed paths by Hinuma et al.14 For the optical investigations, we adopted the full-potential linearized augmented plane-wave (FP-LAPW) method implemented in ELK code.13 The Kohn–Sham equations were formalized within the exchange and correlation functional in the local spin density approximation (LSDA). Self-consistency was achieved under the energy convergence of 10−5 eV. A complex dielectric function ε(ω) = ε1(ω) + iε2(ω) was estimated within the random phase approximation (RPA), TDDFT with bootstrap kernel (TDDFT/TB09), and no microscopic contributions. That was calculated in the field polarization direction parallel to the ab-plane. The imaginary dielectric function was derived from the momentum matrix element

where P is the principal value of the integral. The optical conductivity tensor σ was computed from the dielectric function,

where σαβ(ω) is a component taken from the interband and intraband transition contributions.15 Although all considered optical properties were calculated in both light polarization directions, perpendicular and parallel to the c-axis, we only obtained the data along the ab-plane due to the limitation of the ELK code within the TDDFT/TB09. The irreducible Brillouin zone was established with 4 × 4 × 4, 4 × 4 × 1 and 4 × 2 × 4 meshes consisting of 16, 6 and 20 k-points for α-IrSn4, β-IrSn4, and γ-IrSn4, respectively. To examine the spatial-division dependence of the optical features, we additionally calculated the dielectric function and optical conductivity of β-IrSn4 using a 4 × 4 × 2 mesh including 12 k-points. The valence electrons for the constituent elements are Ir: 5d76s2 and Sn: 5s25p2. In all calculations, the generalized gradient approximations were employed for the exchange correlation interaction, where the Perdew–Burke–Ernzerhof-type pseudopotential (PBEsol-GGA)16 was taken into account.

3 Results
The geometry optimization yields lattice parameters, given in Table 2. As one can see, the optimized parameters are slightly modified by around 6% after the structural relaxation.| Phase | a (Å) | b (Å) | c (Å) | Etot (eV at−1) |
|---|---|---|---|---|
| α-IrSn4 | 6.86299 | 6.86299 | 8.66819 | −8508.6416 |
| β-IrSn4 | 6.4139 | 6.4139 | 23.0127 | −8508.6427 |
| γ-IrSn4 | 6.41178 | 11.60777 | 6.39883 | −8508.6425 |
In addition to the lattice parameters, the relaxation provides important information in respect of the phase stability of the IrSn4 phases. The ground state total energy per atom in each morph (given in Table 2) reveals the lowest value of energy in β-IrSn4 with the differences in Etot values between α- and β-, and between β- and γ-IrSn4, of approximately 1.1 meV and 0.2 meV, respectively. Our finding is in contrast to the result of Nordmark et al., who concluded that α-IrSn4 is the most stable phase.4
The total and partial density of states (DOS and PDOS) of IrSn4 in the energy range −12–6 eV are presented in Fig. 1. One can consider the DOS structure in three different regions, from −12 to −5 eV, from −5 to 0 eV, and that above EF. The DOS structure in the first region originates from Sn-5s electrons. In the second energy range, the main DOS peaks arise from almost equal contributions of Ir-5d and Sn-5p electrons. This finding implies that Ir-5d orbitals possibly are strongly hybridized with Sn-5p ones. Finally, the valence states in the energy range between 0 and 6 eV exhibit a dominant contribution from the Sn-5p electrons.
 | ||
| Fig. 1 The total density of states and partial density of states of the Ir and Sn atoms in (a) α-IrSn4, (b) β-IrSn4 and (c) γ-IrSn4. | ||
A comparison of the DOS shows a substantial difference in the DOS structure between these polymorphs. A higher and more complicated DOS peak structure just below the Fermi level is found in β-IrSn4 and γ-IrSn4 compared to that of α-IrSn4. Moreover, the highest peak located at −1.2 eV resembles the Van Hove singularity, suggesting an electronic instability, and would involve the mechanism of Cooper pairing.17
The estimated density of states at the Fermi level N(EF) and the correspondingly derived Sommerfeld coefficient γth of all phases are listed in Table 3. To calculate γth, we used the following relation of
 | (1) |
| Phase | N(EF) (st eV−1 f.u.) | γth (mJ K−2 mol−1) |
|---|---|---|
| α-IrSn4 | 2.167 | 5.093 |
| β-IrSn4 | 1.813 | 4.259 |
| γ-IrSn4 | 1.430 | 3.361 |
A relatively high Fermi level density of states N(EF), together with electronic instability in β-IrSn4, allow us to anticipate a superconducting state in this phase, since the conditions required for superconductivity were fulfilled.17,18 Having the density of states at EF, we can estimate the Coulomb pseudopotential μ* using the phenomenological Bennemann–Garland formula:19
| μ* = 0.26N(EF)/(1 + N(EF)), | (2) |
Using the theoretical value N(EF) = 1.813, we obtain the Coulomb pseudopotential μ* = 0.167. Based on the McMillan equation:20
 | (3) |
Fig. 2 presents the band structure of the three IrSn4 phases along the high-symmetry points of the Brillouin zone. The bands crossing the Fermi level are marked by colored lines. We detect only 2 bands crossing the Fermi level in α-IrSn4 and 3 bands in the γ-IrSn4 phase, but as many as 6 bands passing through EF in β-IrSn4. The observation of many bands located around EF hints at strong interband scattering in β-IrSn4. It must be recalled that the pairing mechanism assisted by the interband exchange Coulomb interaction between s and d bands for the mechanism of superconductivity of transition metals was predicted many years ago by Kondo.21 A similar mechanism has also been examined by Yamaji in terms of a two-band Hubbard model for high-Tc oxides,22 and by Crépel et al. in the framework of an extended Hubbard model for unconventional superconductivity.23 Therefore, keeping these theoretical considerations in mind, we believe that the stronger interband scattering observed in β-IrSn4 favors the creation of superconductivity in this phase.
 | ||
| Fig. 2 Electronic band structures of (a) α-IrSn4, (b) β-IrSn4 and (c) γ-IrSn4. The colored lines denote bands crossing EF. Insets show enlarged views of the expected Dirac cone points. | ||
The EBS of the three IrSn4 morphs differ a lot from each other, not only by number of electronic bands crossing EF but also by different structures near EF. These bands in β-IrSn4 (Fig. 2b) and γ-IrSn4 (Fig. 2c) are closely comparable and they form Dirac-cone-like structures characterized by a small gap of about 13–16 meV (see enlarged figures in the insets). The bands presented in green and yellow (in Fig. 2b), and blue and gray (in Fig. 2c) share the same attribution of Ir-5d and Sn-5p electrons.
One may add that the Dirac cone has been observed in other condensed matter systems, such as topological insulators24 graphene,25 cuprate-based,26 and FeAs-based27 superconductors. There have been several efforts which proved the close relationship between the appearance of Dirac cones and the nature of the spin-density wave (SDW) state in superconductor materials.28–30
The Fermi surface topology in the primitive Brillouin zone of IrSn4 is displayed in Fig. 3. The FS illustrate multi-sheet structures and highly anisotropic character in all three morphs. However, one can distinguish several remarkable differences between them. The Fermi surface of α-IrSn4 is characterized by a 3D topology with a more complex structure, whereas a 2D-like FS is observed in β- and γ-IrSn4. The two-dimensional Fermi surface topology is an important requirement for superconductivity; e.g., it is often found in HTc FeAs-based superconductors. Therefore, the 2D-FS feature of β-IrSn4 is not alien to the superconductivity. In addition, the FS of γ-IrSn4 possesses an almost 2D topology, being a promising factor for superconductivity.
 | ||
| Fig. 3 Fermi surfaces in 3D and quasi-2D topology along the 001 configuration of (a) α-IrSn4, (b) β-IrSn4 and (c) γ-IrSn4. The figures are plotted by XCrySDen.31 | ||
The electron localization function (ELF) describes the spatial distribution of electrons in a chemical compound and it may provide information about the nature of bonding in studied systems. The ELF is defined as
 | (4) |
 ,
,  , and
, and  is the electron density.32,33 Fig. 4 exhibits the 3D visualizations of the crystal unit cell and the ELF isosurface cut in several different planes. The ELF is restricted between 0 to 1, presented in the color bar from blue to red, corresponding to the change in character of the bonding, from the perfect de-localized to localized one, respectively. The ELF map divulges the high anisotropic distributions of electrons in the considered IrSn4 phases. The low value of the ELF of about 0.5–0.6 near the Ir atoms suggests the itinerant properties of the Ir-5d electrons, responsible for the metallic character of the material. On the other hand, the quite high ELF value of 0.9 surrounding the Sn atoms points to the highly localized properties of Sn-5p electrons. It is clear that the ELF between Ir and Sn significantly varies, not only within each phase, but also between different phases. The bonding character is also inferred through the analysis of the ELF saddle points between different atoms. The high value of the ELF between Sn atoms is additionally ascribed to the covalent character of the Sn–Sn bond. One recognizes that the ELF value increases in series for the morphs α-IrSn4–β-IrSn4–γ-IrSn4. Accordingly, the character of the covalent bonding develops in the same sequence. Obviously, the atomic bonds between atoms in IrSn4 are noticeably different between the morphs, which leads to the physical properties of each phase.
 | ||
| Fig. 4 3D visualizations of the crystal unit cells and the ELF isosurfaces cut in several unique planes of (a) α-IrSn4, (b) β-IrSn4 and (c) γ-IrSn4. The figures are plotted by VESTA.34 | ||
The nature of the interaction of a material with light can be studied via calculations of optical properties. The frequency-dependent dielectric function ε(ω) = ε1(ω) + iε2(ω) yields information on the optical spectra and, furthermore, the inferred optical characteristics. Fig. 5 shows the real (ε1) and imaginary (ε2) parts of the dielectric function of all considered IrSn4 phases calculated for light polarization along the ab-plane in the energy range 0–12 eV. The effect of dielectric field on the polarized degree of materials can be followed by an inspection of the real part of the dielectric functions. The calculated results of ε1 (Fig. 5a) show the static constants of 83.7, 129.9 and 321.8 at 0 eV in the α-, β-, and γ-IrSn4 phases, respectively. These values imply that the interaction of IrSn4 with an electric field, without absorbing energy, increases for this series of compounds in the order of α-, β- and γ-IrSn4.
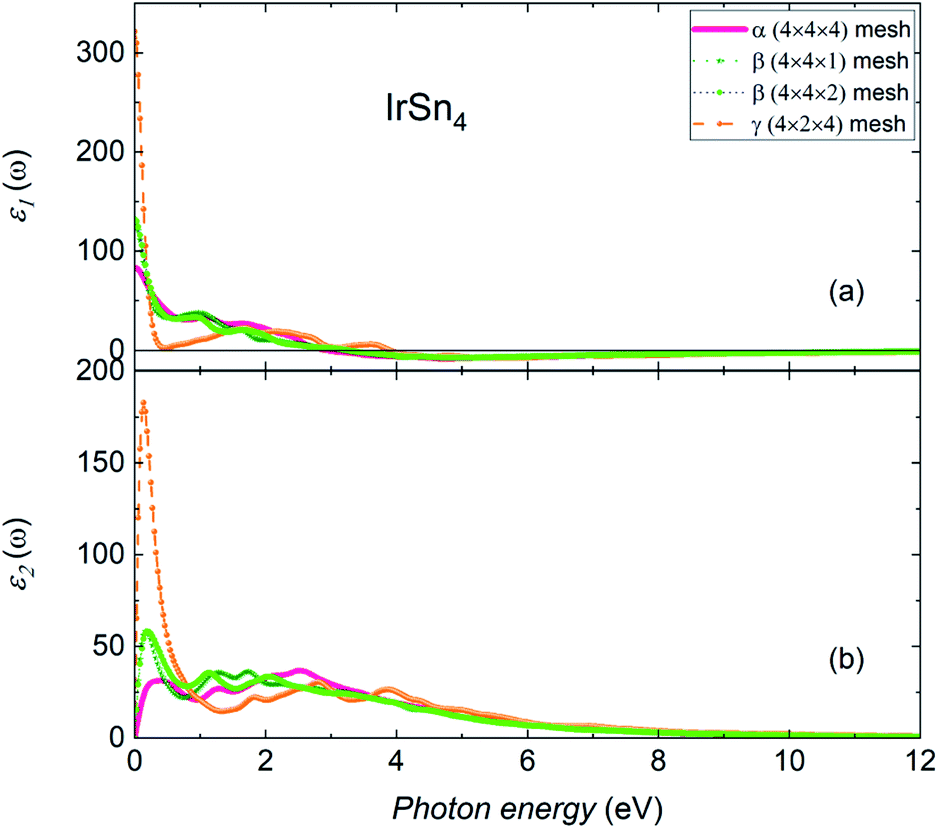 | ||
| Fig. 5 (a) Real and (b) imaginary parts of the dielectric function of α-, β- and γ-IrSn4 along the ab-plane polarization direction. | ||
Basically, ε1 in all phases dramatically decreases with increasing energy in the infrared and visible light regions, indicating that the polarization degree is reduced at the high energy range. The change of polarization following the change of photon energy in γ-IrSn4 is larger than in the remaining phases. The real part of permittivity ε1 retains a positive value until the photon energy is less than 2.9 eV, 3.2 eV and 3.9 eV in the α-, β- and γ-IrSn4 compounds, respectively, suggesting a positive phase shift and IrSn4 is therefore treated as a capacitor.35 In the higher energy ranges, ε1 decreases to a negative value, meaning that the electric field vector and electric displacement vector arrange in opposite directions, where IrSn4 displays metallic behavior.35,36
The spectra of the imaginary part of the dielectric function ε2 is related to electron excitation, which indicates the ability of materials to absorb energy. The imaginary part of the dielectric constant of IrSn4 (Fig. 5b) is found to be approximately zero at energies larger than 9 eV but in the low energy range of 0.2–4 eV, ε2 presents several maxima. Aiming to figure out the contribution of each orbital to the optical transition, we may consider the relationship between the maxima of ε2 and the partial density of states of Ir and Sn in the α-phase (Fig. 6). The optical spectra in the low energy range are suspected to consist of contributions from excitation of both Ir-d and Sn-p electrons. The peak of ε2 at 0.2 eV may be assigned to the intraband transitions of Ir-dx2−y2 ↔ Ir-dx2−y2/dz2/dxz and Sn-px ↔ py. The intraband transitions of Sn-py ↔ Sn-s/px/pz, Sn-px ↔ Sn-px/pz and Ir-dz2 ↔ Ir-dyz, and interband transition of Ir-dz2/dx2−y2 ↔ Sn-s presumably contribute to the peak at 2.5 eV.
 | ||
| Fig. 6 Partial density of states of Ir and Sn in α-IrSn4. | ||
Upon increasing the k-mesh size from 4 × 4 × 1 to 4 × 4 × 2 in β-IrSn4, the real and imaginary parts of the dielectric spectra slightly change in the energy range of 0.2–2.2 eV and are preserved in the remaining area. Therefore, the chosen Brillouin zone division is good enough to study the optical properties of β-IrSn4.
The real parts of optical conductivity σ of α-, β- and γ-IrSn4 along the ab-plane are presented in Fig. 7. In the infrared and ultraviolet ranges, the σ spectrum of γ-IrSn4 certainly exhibits a broader spectrum compared to those in the others. This behavior entails more excitation of carriers in this phase. It is remarkable that there are several pronounced peaks in the range 1.5–7 eV; namely, the maxima in the optical conductivity occur at 2.5 eV and 3.2 eV in the α- and β-morphs, respectively. The γ-IrSn4 spectrum resolves into peaks at 3 and 3.8 eV. It turns out that the electromagnetic response of the γ-morph shows an interesting behavior. Similar to the dielectric behavior under the different k-meshes, the optical conductivity spectra for the β-morph do not change much between the 4 × 4 × 1 and 4 × 4 × 2 meshes.
 | ||
| Fig. 7 Real part of optical conductivity with RPA of α-, β- and γ-IrSn4 along the ab-plane polarization direction. | ||
4 Conclusions
We have investigated the electronic and optical properties of three morphs, α-IrSn4, β-IrSn4, and γ-IrSn4. The density of states structure is found to be more complicated with a Van Hove singularity in β-IrSn4, which reveals the greater instability of electrons in this superconductor. Moreover, the strong interband scattering in this morph is suggested by the numerous bands crossing the Fermi level, corresponding to the 2D-topology of the Fermi surfaces. Meanwhile, the 3D-topology formation is observed in α-IrSn4.The electron localization function describes the high itinerant behavior of Ir electrons and the strong covalent bond of Sn–Sn in β-IrSn4 and γ-IrSn4. Interestingly, the electronic bands near the Fermi level also form Dirac cone structures in both β-IrSn4 and γ-IrSn4. The coincidence of many electronic structures between β-IrSn4 and γ-IrSn4 morphs is highly encouraging to verify the possibility of superconductivity in the latter compound.
Concerning the optical properties, the real part of the dielectric function points out that the polarization degree decreases with an increase of energy, and γ-IrSn4 shows a larger change of polarization than those in other phases. Whereas the high of imaginary part of dielectric function in the infrared and visible light regime seems to be explained by interband and intraband transitions between the valence electrons of Ir-d and Sn-p. In addition, the optical conductivity results indicate a large carrier density, reflected by pronounced maxima in the low energy region.
Author contributions
T. L. Mai: DFT calculations, data analysis, writing and editing. V. H. Tran: conceptualization, validation, writing, and supervision.Conflicts of interest
We have no conflicts of interest to disclose.Acknowledgements
T. L. Mai would like to thank the Van Lang University for financial support.Notes and references
- H. Kaur, H. Kaur and A. Sharma, Mater. Today: Proc., 2021, 37, 3612–3614 Search PubMed.
- R. Flükiger, Reviews of Accelerator Science and Technology, 2012, vol. 05, pp. 1–23 Search PubMed.
- A. Lang and W. Jeitschko, J. Mater. Chem., 1996, 6, 1897–1903 RSC.
- E.-L. Nordmark, O. Wallner and U. Häussermann, J. Solid State Chem., 2002, 168, 34–40 CrossRef CAS.
- V. Larchev and S. Popova, J. Less-Common Met., 1984, 98, L1–L3 CrossRef CAS.
- D. N. B. Künnen and W. Jeitschko, J. Alloys Compd., 2000, 309, 1–9 CrossRef.
- V. H. Tran, Z. Bukowski, P. Wiśniewski, L. M. Tran and A. J. Zaleski, J. Phys.: Condens. Matter, 2013, 25, 155701 CrossRef PubMed.
- R. M. G. Arti and T. Nandini, Nat. Phys., 2008, 4, 762–765 Search PubMed.
- H. Fukuyama, S. Maekawa and A. P. Malozemoff, Strong Correlation and Superconductivity, Springer, Berlin, Heidelberg, 1989, vol. 89 Search PubMed.
- P. E. Blöchl, Phys. Rev. B, 1994, 50, 17953–17979 CrossRef PubMed.
- G. Kresse and D. Joubert, Phys. Rev. B, 1999, 59, 1758–1775 CrossRef CAS.
- G. Kresse and J. Hafner, Phys. Rev. B, 1993, 47, 558–561 CrossRef CAS PubMed.
- J. K. Dewhurst, et. al., Version 5.2.10, 2018 Search PubMed.
- Y. Hinuma, G. Pizzi, Y. Kumagai, F. Oba and I. Tanaka, Comput. Mater. Sci., 2017, 128, 140–184 CrossRef CAS.
- G. Grosso and G. Parravicini, Solid State Physics, Academic, San Diego, 2000, https://www.elsevier.com/books/solid-state-physics/grosso/978-0-12-385030-0 Search PubMed.
- J. P. Perdew, A. Ruzsinszky, G. I. Csonka, O. A. Vydrov, G. E. Scuseria, L. A. Constantin, X. Zhou and K. Burke, Phys. Rev. Lett., 2008, 100, 136406 CrossRef PubMed.
- L. Van Hove, Phys. Rev., 1953, 89, 1189–1193 CrossRef CAS.
- J. Bardeen, L. N. Cooper and J. R. Schrieffer, Phys. Rev., 1957, 108, 1175–1204 CrossRef CAS.
- K. H. Bennemann and J. W. Garland, AIP Conf. Proc., 1972, 4, 103 Search PubMed.
- W. L. McMillan, Phys. Rev., 1968, 167, 331–344 CrossRef CAS.
- J. Kondo, Prog. Theor. Phys., 1963, 29, 1–9 CrossRef CAS.
- K. Yamaji and S. Abe, J. Phys. Soc. Jpn., 1987, 56, 4237–4240 CrossRef CAS.
- V. Crépel, T. Cea, L. Fu and F. Guinea, Phys. Rev. B, 2022, 105, 094506 CrossRef.
- B. A. Bernevig, T. L. Hughes and S. C. Zhang, Science, 2006, 314, 1757 CrossRef CAS PubMed.
- A. Geim and K. S. Novoselov, Nat. Mater., 2007, 6, 183 CrossRef CAS PubMed.
- A. Damascelli, Z. Hussain and Z.-X. Shen, Rev. Mod. Phys., 2003, 75, 473 CrossRef CAS.
- P. Richard, K. Nakayama, T. Sato, M. Neupane, Y.-M. Xu, J. H. B. G. F. Chen, J. L. Luo, N. L. Wang, X. Dai, Z. Fang, H. Ding and T. Takahashi, Phys. Rev. Lett., 2010, 104, 137001 CrossRef CAS PubMed.
- Y. Ran, F. Wang, H. Zhai, A. Vishwanath and D.-H. Lee, Phys. Rev. B, 2009, 79, 014505 CrossRef.
- M. Z. Hasan and B. Bernevig, Physics, 2010, 3, 27 CrossRef.
- D. Hsieh, Y. Xia, L. Wray, D. Qian, K. Gomes, A. Yazdani, G. F. Chen, J. L. Luo, N. L. Wang and M. Z. Hasan, arXiv:0812.2289, 2008, 3, DOI:10.48550/arXiv.0812.2289.
- A. Kokalj, Comput. Mater. Sci., 2003, 28, 155–168 CrossRef CAS.
- A. Savin, O. Jepsen, J. Flad, O. K. Andersen, H. Preuss and H. G. Schnering, Angew. Chem., Int. Ed. Engl., 1992, 31, 187–188 CrossRef.
- A. D. Becke and K. E. Edgecombe, J. Chem. Phys., 1990, 92, 5397–5403 CrossRef CAS.
- K. Momma and F. Izumi, J. Appl. Crystallogr., 2008, 41, 653–658 CrossRef CAS.
- J. D. Jackson, Classical Electrodynamics, J. Wiley and Sons, Inc, 1999 Search PubMed.
- K. Sun, J. Xin, Y. Li, Z. Wang, Q. Hou, X. Li, X. Wu, R. Fan and L. C. Kwang, J. Mater. Sci. Technol., 2019, 35, 2463–2469 CrossRef CAS.
Footnote |
| † Electronic supplementary information (ESI) available. See https://doi.org/10.1039/d2ra01672a |
| This journal is © The Royal Society of Chemistry 2022 |