
 Open Access Article
 This Open Access Article is licensed under a Creative Commons Attribution-Non Commercial 3.0 Unported Licence
Functional property optimization of sodium caseinate-based films incorporating functional compounds from date seed co-products using response surface methodology
Hajer Aloui *,
Khawla El Ouazari and
Khaoula Khwaldia*
*,
Khawla El Ouazari and
Khaoula Khwaldia*
Laboratoire des Substances Naturelles, Institut National de Recherche et d'Analyse Physico-chimique (INRAP), Pôle Technologique de Sidi Thabet, 2020 Sidi Thabet, Tunisia. E-mail: hajer.aloui@ymail.com; khaoula.khwaldia@inrap.rnrt.tn; khaoula_khwaldia@yahoo.fr
First published on 25th May 2022
Abstract
Novel composite films made of sodium caseinate (NaCas) and two functional compounds from date seed co-products, i.e. furfural and date seed oil (DSO), were produced. The effects of furfural and DSO contents on the barrier, mechanical and optical properties of NaCas films were assessed using a two-factor, five-level central composite design. Increasing DSO content increased contact angle values of NaCas films and decreased their solubility indicating an increase in their hydrophobicity. Moreover, increasing furfural concentration increased tensile strength (TS) of NaCas films due to crosslink formation between furfural and NaCas' primary amine groups. On the other hand, furfural and DSO incorporation conferred good light barrier properties to the resulting films. Overall, a furfural content of 0.69% and 1.76% DSO were selected as the optimum factor levels producing maximum contact angle (69.85°) and TS (36.47 MPa) and minimum solubility (16.95%) with overall desirability of 0.98.
1. Introduction
Naturally occurring biopolymers such as polysaccharides, proteins and lipids constitute appealing materials for the development of edible and biodegradable films and coatings which may alleviate the pressure on the environment by substituting, even partially, petroleum-based packaging materials. Among natural proteins, casein and caseinate are of particular interest thanks to their accessibility, relative inexpensiveness, and total biodegradability. Sodium caseinate (NaCas) consisting of casein monomers and small-scale aggregates obtained after removal of calcium phosphate,1 is an interesting candidate for the formation of food packaging films thanks to its high nutritional,2 water solubility3 water holding4,5 emulsifying,5,6 film-forming7,8 and thermoplastic properties.9,10 Such interesting physical and techno-functional properties allow the potential use of NaCas as stand-alone edible or biodegradable films,11–13 edible coatings on food products14,15 or biodegradable coatings on packaging materials.16,17 However, some drawbacks including low mechanical, high water solubility and low water vapor barrier properties can limit the application range of NaCas films in food packaging. Therefore, a variety of approaches has been used to modify either the structure of the caseinate biopolymer or the properties of caseinate-based films. In this context, the cold plasma process (CPP) has been proven effective in improving the film-forming and emulsifying properties of NaCas by inducing structural and interfacial modifications in protein chains.11 However, the practical application of CPP is limited due to its complexity and the lack of appropriate information on mechanisms underlying the complex interaction between plasma and protein matrix. On the other hand, NaCas film structure and functionality may be modified through the incorporation of many additives such as plasticizers,18 surfactants19 cross-linking agents12 reinforcements20 lipidic compounds and other hydrophobic substances.10,21 Moreover, caseinate can act as an efficient carrier for bioactive compounds, giving rise to polymeric matrices with interesting physical and functional properties and biological activities.7 Nowadays, the recovery of valuable compounds from agro-industrial co-products and by-products has been investigated as an efficient tool to enhance the functionality of hydrocolloid-based films and coatings while at the same time ensuring the sustainability of food preservation in the frame of the circular economy concept. In fact, about 998 million tons of agricultural waste with a huge variety of valuable bioactive compounds end up yearly in landfills or dumped in rivers, causing a significant pollution problem in absence of an effective management strategy.22 In this context, the extraction of valuable products from agriculture byproducts and wastes can be investigated as a key challenge to counteract the negative environmental impact of waste disposal while at the same time providing sustainable highly valuable compounds that can be incorporated into hydrocolloid-based films and coatings providing them with additional functional properties. In this view, date seeds, a co-product from the date processing industry, account for about 10–15% of the fresh date and exceed 1 million tons per year.23 Date seeds are mostly discarded or used in animal feeding. However, this co-product contains high contents of fibers, proteins, sugars, phenols, and minerals, with potential antioxidant, antimicrobial, and antiviral properties.23 Moreover, date pits are a valuable source of oil (5–13%) which consists of fatty acids, tocopherols, phytosterols, and phenolic compounds. Such composition and the presence of bioactive substances offer added value to date seed oil (DSO) and make it a suitable candidate for the development of biodegradable films and coatings. On the other hand, the carbohydrate content of date seeds could be exploited to produce furfural. Furfural, a heterocyclic aldehyde, continues to draw attention as a bio-based platform for developing a wide range of biochemicals and biofuels.24 Being used in many industries, including food, paper, plastics, agrochemical, textile, aerospace, cosmetic, and pharmaceutical, furfural possesses significant chemical activity and thermal stability, has good water resistance, and a proven crosslinking capacity.25,26 Agricultural wastes rich in carbohydrates such as date seeds are a promising source for furfural production due to their high availability and low cost. In this work, novel biodegradable film-forming formulations based on NaCas and functional compounds extracted from date seeds were developed. To the best of our knowledge, only one published study has investigated the recovery of furfural from date pits.27 However, no research has been performed on the modification of caseinate films through the incorporation of functional compounds from date seed co-product. Therefore, the objectives of this study were to evaluate the effects of furfural and DSO contents on the structural, thermal, and functional properties of caseinate films using a two-factor, five-level central composite design and to establish the optimum parameters combination that may enhance the functionality of the resulting composite films.2. Materials and methods
2.1. Materials
Date seeds were collected from the oasis Ibn Chabbat, located in the governorate of Tozeur (south-west Tunisia) in 2019. Date seeds used in this study are from the Deglet Nour dates, the main exported Tunisian variety appreciated around the world for its superior quality and exceptional taste. Palm date seeds were five times washed with distilled water and oven-dried at 70 °C for 24 h, then ground into a fine powder using a Polymix PX-MFC 90 D mill (Kinematica AG, Malters, Switzerland) and stored in amber glass jars until use at room temperature and humidity.Analytical grade solvents used in this study, furfural analytical standard, glycerol and NaCas were purchased from Sigma Aldrich (Steinheim, Germany).
2.2. Extraction of furfural
The extraction of furfural from palm date seeds was performed by hydrodistillation according to Barbosa et al.28 method with some modifications. Briefly, 5 g of date seeds powder was mixed with 5 g of NaCl and 25 ml of HCl (3 M) in a boiling flask, which is linked to a simple distillation apparatus. The distillate was recovered into a separating funnel containing 20 ml of chloroform. Two distinct layers were formed and recovered separately, the aqueous one at the top and the furfural–solvent mixture at the bottom of the funnel. Chloroform was removed from the non-aqueous solution using a rotary evaporator (Heidolph, Schwabach, Germany) to isolate furfural, which was stored in amber glass jars at 4 °C.2.3. Extraction of date seed oil (DSO)
DSO extraction from 30 g of date seeds powder was carried out using a Soxhlet extractor with 150 ml of hexane. A rotary evaporator (Heidolph, Schwabach, Germany) was used to remove the solvent from oil samples at 68 °C and the extracted DSO was stored in amber glass jars at −20 °C until use.2.4. Chemical characterization of functional compounds recovered from date seed co-products
2.5. Preparation of NaCas-based films
The procedure used for the preparation of NaCas film-forming solutions was adapted from Aloui and Khwaldia.16 NaCas dispersions at 10% (w/w) were obtained by dissolving NaCas biopolymer in distilled water heated at 70 °C under mechanical stirring until complete NaCas dispersion. Glycerol as a plasticizer was added at 25 wt% of NaCas to the biopolymer dispersions with constant mechanical stirring. Selected amounts of furfural and DSO were added according to the experimental plan displayed in Table 1 and a concentration of 0.25% (v/v) Tween 80 was then added to the resulting dispersions before being homogenized at 21![[thin space (1/6-em)]](https://www.rsc.org/images/entities/char_2009.gif) 500 rpm for 5 min with an Ultra-Turrax T25 (IKA, Labortechnik GmbH, Munich, Germany) and degassed at room temperature under vacuum.
500 rpm for 5 min with an Ultra-Turrax T25 (IKA, Labortechnik GmbH, Munich, Germany) and degassed at room temperature under vacuum.
| Variable levels | Independent variables | |
|---|---|---|
| Furfural concentration (%, w/w) | DSO concentration (%, w/w) | |
| DSO: date seed oil. | ||
| −1.41 | 0.00 | 0.00 |
| −1 | 0.22 | 0.29 |
| 0 | 0.75 | 1.00 |
| +1 | 1.28 | 1.71 |
| +1.41 | 1.50 | 2.00 |
20 g of each film-forming dispersion was cast onto a flat Petri dish (100 × 20 mm) and dried at 25 °C in a Memmert forced convection oven (Schwabach, Germany) for 48 h. The resulting dried films with an average uniform thickness of 173 ± 15 μm were stored in a constant climate chamber at 25 °C and 50% relative humidity until characterization. Films thickness was measured using a ProGage thickness tester (Thwing-Albert Instrument Company, Philadelphia, PA) in accordance with ISO 534-2005. Thickness measurements were performed in triplicate for each film sample.
2.6. Film characterization
Thermogravimetric analysis (TGA) was performed to study the thermal stability of the NaCas-based films using a TGA 2950 thermogravimetric analyzer (TA Instruments, Champaign, USA). Samples of approximately 10 mg were heated from room temperature to 800 °C at a heating rate of 10 °C min−1 under a nitrogen atmosphere. The initial degradation temperature (T0) and the temperatures at the maximum degradation rate (Tmax) were determined from the TG and the derivative (DTG) curves, respectively, according to Arrieta et al.29Attenuated total reflection-Fourier transform infrared (ATR-FTIR) spectra of the films were carried out using a FTIR Bruker spectrometer (Equinox 55, Bruker Co., Ettlingen, Germany). Flat film samples with uniform thickness were placed in contact with the diamond crystal of the ATR device, with an incidence value of 45°. The gripper plate was then placed on the sample and the pressure applied on the gripper plate was adjusted allowing intimate contact between the sample and the ATR crystal. The spectra were acquired between 4000 and 600 cm−1 using a total of 32 scans and 4 cm−1 resolution.
The film surface was examined with a FEI Quanta 200 scanning electron microscope (FEI Company, Eindhoven, the Netherlands) at 20 kV. Film samples (10 × 10 mm) were cut and gold-coated in a sputtering unit through a sputter deposition process. This conductive coating is required to provide a homogeneous surface of analysis and prevent the charging of the sample with the electron beam when using the conventional SEM mode (high vacuum, high voltage).
Contact angle measurements of NaCas-based films were carried out using a goniometer (Pocket Goniometer PGX, Sweden) according to the sessile drop method as previously described by Aloui et al.30 Ten measurements on each film were performed at 25 °C.
The water solubility of NaCas-based films was carried out according to the method described by Sun et al.,31 with some modifications. Briefly, films were cut into 2 cm × 2 cm samples and dried at 105 °C to constant weight (m1). Afterward, film specimens were immersed in 15 ml of distilled water for 24 h. Film samples were then superficially wiped with tissue paper to remove the remaining water before being dried at 105 °C to constant weight to obtain the final dry mass (m2). Water solubility was calculated using the following equation:
| Film solubility = m1 − m2/m1 × 100% |
The mechanical properties of the different NaCas-based films were evaluated in terms of tensile strength (TS) and elongation at break (% E) using a material testing machine (Lloyd LRX, Lloyd Instruments Ltd, Royston, UK) according to the ISO 1924-2-1994 method as previously described by Aloui et al.7 Ten replicates of each film type were tested.
Films transparency was measured by UV-Vis spectroscopy at wavelengths between 200 and 800 nm as previously described by Aloui et al.32 The transparency was calculated using the following equation:
| Transparency = −log(T600)/X, |
2.7. Experimental design
A five-level, two-factor central composite design (CCD) was used to evaluate the effect of two independent factors, namely, furfural concentration (X1) and date seed oil concentration (X2) on the functional and physical properties of NaCas-based films and to reveal the best factors combination that may improve their functionality as potential food packaging materials. The selected variables were studied at five different coded levels (−α, −1, 0, +1, and +α). The experimental levels for each variable were selected based on preliminary assays and the objective responses were expressed as contact angle, solubility, tensile strength (TS), elongation at break (% E) and transparency. Variable levels expressed in coded and real values are presented in Table 1. The experimental design involved 11 runs including two replicates (10, 11) at the central point (9) for residual variance estimation (Table 2).| Exp | Variablesa | Responsesb | |||||
|---|---|---|---|---|---|---|---|
| X1 | X2 | Contact angle (Y1) (°) | Solubility (Y2) (%) | TS (Y3) (MPa) | % E (Y4) (%) | Transparency (Y5) | |
| a Factors: X1, furfural concentration (%, w/w); X2, DSO concentration (%, w/w).b Responses: TS, tensile strength; % E, elongation at break. | |||||||
| 1 | 0.22 | 0.29 | 48.25 | 17.90 | 45.77 | 60.82 | 0.18 |
| 2 | 1.28 | 0.29 | 54.15 | 19.30 | 46.46 | 115.03 | 0.42 |
| 3 | 0.22 | 1.71 | 64.48 | 10.91 | 24.59 | 108.06 | 0.32 |
| 4 | 1.28 | 1.71 | 65.65 | 10.38 | 43.51 | 36.57 | 0.71 |
| 5 | 0.00 | 1.00 | 60.10 | 12.55 | 16.31 | 126.28 | 0.24 |
| 6 | 1.50 | 1.00 | 59.95 | 14.34 | 47.35 | 10.62 | 0.76 |
| 7 | 0.75 | 0.00 | 52.95 | 22.22 | 47.82 | 148.49 | 0.24 |
| 8 | 0.75 | 2.00 | 73.25 | 14.86 | 35.50 | 16.910 | 0.41 |
| 9 | 0.75 | 1.00 | 63.75 | 24.13 | 44.16 | 81.970 | 0.27 |
| 10 | 0.75 | 1.00 | 63.74 | 25.90 | 43.87 | 80.870 | 0.27 |
| 11 | 0.75 | 1.00 | 62.71 | 22.94 | 44.25 | 80.480 | 0.29 |
Response surface methodology using a second-order polynomial regression model was used to determine the relationship between the independent variables and the measured responses as follows:
| Y = b0 + b1X1 + b2X2 + b11X12 + b22X22 + b12X1X2 |
2.8. Statistical analysis
NEMROD® software (Mathieu and Phan-Than-Luu 1997) was used to perform the statistical analysis and generate the regression model along with the predicted responses. Data were analyzed by analysis of variance (ANOVA) (Table 3), multiple regression analysis, and desirability function. ANOVA and canonical analysis were used to confirm the adequacy of the model. The polynomial model fit quality was expressed by the coefficient of determination R2 and adjusted R2 (Table 4).| Source of variation | Sum of square | Degrees of freedom | Mean square | ||||||||
|---|---|---|---|---|---|---|---|---|---|---|---|
| Y1 | Y2 | Y3 | Y4 | Y5 | Y1 | Y2 | Y3 | Y4 | Y5 | ||
| Y1, contact angle; Y2, solubility; Y3, TS; Y4, % E; Y5, transparency. * 1% < α < 5%. ** 1‰ < α < 1%. *** α < 1‰. | |||||||||||
| Regression | 446.6254 | 292.2687 | 9.70073 × 10² | 2.29990 × 10⁴ | 0.3643 | 5 | 89.3251** | 58.4537** | 1.94015 × 10² | 4.59981 × 10³*** | 0.0729*** |
| Residual | 30.9933 | 12.3200 | 1.01709 × 10² | 2.39105 × 10³ | 0.0062 | 5 | 6.1987 | 2.4640 | 2.03420 × 10 | 4.78209 × 10² | 0.0012 |
| Lack of fit | 30.2791 | 7.8831 | 1.01631 × 10² | 2.38985 × 10³ | 0.0059 | 3 | 10.0930* | 2.6277 | 3.38770 × 10 | 7.96618 × 10²*** | 0.0020 |
| Pure error | 0.7142 | 4.4369 | 7.88667 × 10⁻² | 1.19407 | 0.0003 | 2 | 0.3571 | 2.2184 | 3.94333 × 10⁻² | 5.97033 × 10⁻¹ | 0.0001 |
| Total | 477.6187 | 304.5887 | 1.07178 × 10³ | 2.53901 × 10⁴ | 0.3705 | 10 | |||||
| Variables | Contact angle (Y1) (°) | Solubility (Y2) (%) | TS (Y3) (MPa) | % E (Y4) (%) | Transparency | |
|---|---|---|---|---|---|---|
| * 1% < α < 5%. ** 1‰ < α < 1%. *** α < 1‰. | ||||||
| Intercept linear | 63.400*** | 24.323*** | 44.093*** | 81.107*** | 0.277*** | |
| Furfural concentration | b1 | 1.212 | 0.601 | 11.227*** | −49.648*** | 0.241*** |
| DSO concentration | b2 | 9.977*** | −4.653** | −7.346*** | −56.092*** | 0.119** |
| Quadratic | b11 | −5.090** | −11.563*** | −10.595*** | 2.115 | 0.221** |
| b12 | −2.365 | −0.965** | 9.115* | −12.850** | 0.075 | |
| Interaction | b22 | −2.015 | −6.648 | −0.765*** | 16.365*** | 0.046 |
| R2 | 0.935 | 0.960 | 0.905 | 0.906 | 0.983 | |
| Adjusted R2 | 0.870 | 0.919 | 0.810 | 0.812 | 0.967 | |
3. Results and discussion
3.1. Chemical characterization of functional compounds recovered from date seed co-products
 | ||
| Fig. 1 1H NMR (a) and 13C NMR (b) spectra of furfural extracted from date co-products and standard furfural from Sigma. | ||
The 13C NMR spectrum of furfural extracted from date seeds co-products displayed several peaks at 80, 110, 120, 150 and 180 ppm (Fig. 1b). Similar 13C NMR signals were depicted for the standard furfural sample provided by Sigma.
 | ||
| Fig. 2 GC-FID chromatogram of DSO. | ||
| Fatty acids | Percentage (%) |
|---|---|
| Lauric acid (C12:0) |
31 |
| Myristic acid (C14:0) |
12 |
| Palmitic acid (C16:0) |
9 |
| Stearic acid (C18:0) |
3 |
| Oleic acid (C18:1) |
38 |
| Linoleic acid (C18:2) |
7 |
The peak at the retention time of 29.8 min (Fig. 2) was assigned to oleic acid which represents the major fatty acid of date seed oil (38%) followed by lauric acid (31%). Lower amounts of myristic acid (12%), palmitic acid (9%), stearic acid (3%) and linoleic acid (7%) were also detected in the fatty acid composition of date seeds oil (Table 5). In agreement with our findings, Besbes et al.34 reported that the most abundant fatty acids of date seed oil of Deglet Nour cultivar were oleic and lauric acids. In this context, Deglet Nour seed oil was defined as an oleic–lauric oil. It has been reported that oils with high oleic acid content are of great importance owing to their high stability and nutritional value. In fact, oleic acid is considered among the most important unsaturated fatty acids in human food owing to its low saturation, high oxidative stability and its high potential in reducing cholesterol and preventing heart vascular diseases.35 Likewise, some studies have underlined the antimicrobial properties of lauric acid and its high potential in preventing prostatic hyperplasia development.36,37 Previously, Ali, Al-Hattab, and Al-Hydary38 stated that Iraqi date seed oil was regarded as an oleic–palmitic type. In another study, Suresh et al.39 reported that Omani date seeds oil was defined as an oleic–myristic type. Fatty acids content and composition in date seed oil are strongly dependent on the variety of dates and their ripening stage as well as the method used for oil extraction.40
3.2. Thermal behavior
TGA results of neat NaCas film and NaCas composite films incorporating furfural and/or DSO are presented in Table 6 and Fig. 3.| Films | Thermogravimetric parameters | Residue at 700 °C (%) | |||
|---|---|---|---|---|---|
| T0 (°C) | Stage I, Tmax 1 (°C) | Stage II, Tmax 2 (°C) | Stage III, Tmax 3 (°C) | ||
| DSO: date seed oil. | |||||
| Neat NaCas | 162 | 93 | 256 | 304 | 16.0 |
| NaCas/1% DSO (Exp 5) | 191 | 128 | 263 | 311 | 16.0 |
| NaCas/0.75% furfural (Exp 7) | 170 | 107 | 255 | 312 | 16.5 |
| NaCas/0.75% furfural/2% DSO (Exp 8) | 170 | 104 | 260 | 309 | 17.2 |
 | ||
| Fig. 3 (a) TG and (b) DTG curves of neat NaCas films and NaCas composite films incorporating furfural and/or DSO. | ||
Neat and composite NaCas films exhibited a first mass loss stage at about 100 °C corresponding to the loss of moisture and water that remained in conditioned protein films from the casting process. The second mass loss stage occurring between 200 and 270 °C indicated the removal of glycerol and some volatile components of furfural from caseinate films. It has been reported that glycerol loss from caseinate structure occurs at a temperature range of 105 to 250 °C.29,41 Qin et al.42 indicated that the combustion phase of volatile compounds in furfural could take place between 250 and 370 °C. The third mass loss stage, occurring at temperatures over 300 °C was attributed to caseinate decomposition mainly due to the breaking-up of glycosidic bonds.
NaCas/1% DSO films (Exp 5) showed the highest initial degradation temperature and the lowest degradation rate with a T0 of 193 °C and a maximum protein decomposition temperature of 311 °C indicating an increase in the thermal stability of NaCas films with the addition of oil. This improved thermal resistance has been reported for caseinate films incorporating fatty acids and Matricaria recutita essential oil or the lipidic fraction of tomato pomace.4,7 As shown in Table 6, NaCAS films displayed a maximum decomposition temperature of 304 °C while it shifted to 312 °C in presence of 0.75% furfural (Exp 7).
Moreover, NaCas incorporating different amounts of furfural showed higher decomposition temperatures than neat NaCas films, indicating an enhancement in thermal stability with the incorporation of furfural. This result can be explained by the formation of a more stable and cohesive protein structure due to the interaction between caseinate polymer and furfural through covalent and hydrogen bonds, as confirmed by ATR-FTIR analysis (Fig. 4). In another study, Lakra et al.25 reported that furfural, acting as a crosslinking agent, improved the thermal stability of collagen by stabilizing collagen matrix through intramolecular and intermolecular bonds. Likewise, an improvement in the thermal stability of soy protein isolate-based films was recorded after incorporation of furfural.43 Recently, Zhang et al.44 attributed the high thermal resistance of phenolic resin crosslinked with furfural to the high molecular weight and stable structure of furan-based heterocycles.
 | ||
| Fig. 4 ATR-FTIR spectra of (a) furfural and DSO and (b) NaCas-based films. | ||
3.3. ATR-FTIR
As shown in Fig. 4a, the FTIR spectrum of DSO revealed two intense aliphatic C–H stretching peaks at 2854 and 2926 cm−1 (ref. 45) and a peak at 3011 cm−1 corresponding to unsaturated fatty acids.7 The peak at 1746 cm−1 is associated with C![[double bond, length as m-dash]](https://www.rsc.org/images/entities/char_e001.gif) O stretching vibration of ketones, carboxylic acids, aldehydes, and esters. The C–H bending region shows peaks at 1458 and 1366 cm−1 assigned to CH2 and CH3 groups. The C–O stretching and aromatic C–H in-plane bending vibration are ascribed to peaks located at 1156 cm−1 and 724 cm−1, respectively. The peak at 581 cm−1 corresponds to various inorganic compounds.38
O stretching vibration of ketones, carboxylic acids, aldehydes, and esters. The C–H bending region shows peaks at 1458 and 1366 cm−1 assigned to CH2 and CH3 groups. The C–O stretching and aromatic C–H in-plane bending vibration are ascribed to peaks located at 1156 cm−1 and 724 cm−1, respectively. The peak at 581 cm−1 corresponds to various inorganic compounds.38
The FTIR spectrum of furfural extracted from palm seeds (Fig. 4a) showed an intense peak at 1670 cm−1 assigned to the carbonyl CO group. Bands at 3133, 2853, 2808, and 1367 cm−1 are characteristic of aldehyde groups.33 The C–O stretching vibration is ascribed to peaks located at 1159 and 1222 cm−1. The aromatic CC bending and C–H out-plane bending vibration are ascribed to peaks from 1565 to 1464 cm−1 and 927 to 841 cm−1, respectively.46
The ATR-FTIR spectrum of neat caseinate films (Fig. 4b) revealed a broad band at 3275 cm−1 and a small shoulder at 3062 cm−1 assigned to –OH and NH groups, respectively. The bands at 1633 and 1534 cm−1 correspond to the amide group. The characteristic bands at 2928 and 2874 cm−1 are in good agreement with the caseinate ATR-FTIR spectrum reported in many studies.7,10,17
From the ATR-FTIR spectrum of caseinate/1% DSO films (Exp 5), a shift of O–H and N–H stretching toward higher frequencies as well as a decrease in the intensity of their corresponding bands were noticed, endorsing the interactions between caseinate and DSO through intermolecular hydrogen bonds. The peaks corresponding to asymmetric and symmetric stretching vibrations of C–H bonds were shifted to 2868 and 2922 cm−1, due to hydrophobic interactions between film constituents (Fig. 4b). After incorporation of furfural into films (Exp 7 & Exp 8), the intensity of bands corresponding to amide I and amide II groups decreased and were shifted to 1638 and 1538 cm−1, respectively, indicating a decrease in free amine groups due to their interaction with furfural aldehyde groups. A similar decrease in intensity of other bands (1443 and 1394 cm−1), corresponding to the amide group, was also noticed (Fig. 4b). When comparing the ATR-FTIR spectrum of neat caseinate films with that of caseinate films incorporating DSO and furfural, no new peak was observed, which denoted the complete and homogenous distribution of the incorporated compounds into the polymeric matrix. The observed spectral changes for caseinate after the addition of furfural and DSO were in accordance with those observed for NaCas or calcium caseinate films incorporating glycerol and carvacrol.29 Likewise, crosslinked collagen films were obtained after the incorporation of furfural.25
3.4. Scanning electronic microscopy (SEM) analysis
SEM images of the different NaCas-based films are shown in Fig. 5. Neat NaCas film exhibited a smooth, compact, and homogeneous surface with the presence of some pinholes arising from air bubbles created during the film drying process (Fig. 5a). In contrast, NaCas/furfural composite film exhibited a heterogeneous structure with a rough surface (Fig. 5b) most likely due to the strong interactions promoted by the incorporation of furfural which can act as an efficient crosslinking agent. Likewise, the incorporation of DSO at high content led to an increase in the surface roughness of the resulting composite film compared with the neat NaCas film probably due to the aggregation and coalescence of lipid droplets during the film drying process (Fig. 5c). | ||
| Fig. 5 Scanning electron microscopy images (×600) of (a) neat NaCas film, (b) NaCas composite film incorporating 0.75% (w/w) of furfural (Exp 7), (c) NaCas composite film incorporating 1% (w/w) of DSO (Exp 5) and (d) NaCas composite film incorporating 0.75% (w/w) of furfural and 1% (w/w) of DSO (Exp 9). | ||
Similar observations were previously reported by Kadzińska et al.47 who revealed a rough film surface structure with a heterogeneous oil droplets distribution and a tendency of cluster formation upon the incorporation of different vegetable oils including hazelnut, coconut and rapeseed oils into sodium alginate-apple puree-based films. Likewise, Cao et al.48 observed an increase in the heterogeneity of barnyard millet starch-based film surface upon borage seed oil incorporation due to lipid aggregates formation. A further increase in the surface roughness and heterogeneity of NaCas-based films was noticed because of increasing both furfural and DSO concentrations with the appearance of agglomerated regions within the polymeric matrix (Fig. 5d). Previously, a very rough film surface was observed by Nayak et al.43 when inspecting SEM images of soy protein isolate films incorporating oleic acid and furfural. Such increase in film surface roughness was mainly ascribed to the crosslinking of furfural with protein chains along with oleic acid droplets aggregation within the polymeric matrix.
3.5. Contact angle
Water contact angle measurement is important for films intended for food packaging applications as it gives information on surface hydrophobicity that represents a key characteristic in controlling moisture transfer through polymer-based films. Overall, contact angle rises with increasing surface hydrophobicity.7ANOVA for the studied experimental responses and the regression coefficients of predicted second-order polynomial models are reported in Tables 3 and 4, respectively. The surface response plot of contact angle as a function of furfural and DSO contents is shown in Fig. 6a.
 | ||
| Fig. 6 Response surface plots of contact angle (a) and solubility (b) as a function of furfural (X1) and DSO (X2) concentrations. | ||
As it can be inferred from this figure, contact angle values of NaCas-based films significantly increased with increasing DSO content (X2) indicating an increase in their hydrophobicity. Concerning furfural content, no significant effect on contact angle response was revealed. Based on FTIR analysis (Fig. 4), such increase in the hydrophobicity of the resulting NaCas composite films can be attributed to the establishment of intermolecular hydrogen bonds NaCas chains and DSO which may limit the number of hydrophilic groups interacting with water at the film surface giving rise to a decrease in the hydrophilic tendency of the resulting NaCas composite films. In agreement with our findings, higher contact angle values were recorded for NaCas-based films as a result of increasing the concentration of the tomato pomace lipidic fraction from 0 to 40 wt%.7 Such an increase in the hydrophobicity of the resulting composite films was mainly ascribed to the hydrophobic nature of the incorporated lipidic fraction. Previously, Pereda et al.10 stated that the incorporation of linseed oil resin (LO) at 5 wt% enhanced by more than 60% the contact angle of caseinate films due to the nonpolar compounds in LO that decrease surface film polarity. In contradiction with our findings, no continuous increase in contact angle values of gelatin films was noticed by Li et al.49 as the quantity of hydrophobic compounds (thymol and lecithin) increased. According to these authors, the water contact angle is not only related to the hydrophobicity of the film but also to its surface roughness and porosity.
3.6. Solubility
As shown in Table 4 and Fig. 6b, water solubility values of NaCas-based films were negatively affected by the linear term of DSO content but remained unchanged with increasing furfural content. The decrease in water solubility of NaCas-based films with increasing DSO content can be ascribed to the nonpolar nature of the incorporated oil along with the reduction in the number of available hydrophilic groups due to the establishment of intermolecular hydrogen bonds between NaCas chains and DSO as revealed by ATR-FTIR analysis (Fig. 4). In agreement with our findings, Manrich et al.50 reported a significant reduction in water solubility of pectin-based films when increasing cutin content from 0 to 50 wt%. Such improvement in water barrier properties of pectin/cutin composite films was mainly ascribed to the homogeneous dispersion of the cutin lipophilic phase into the polymeric matrix which may decrease its affinity towards water molecules. Similar behavior was previously noticed by Sartori and Menegalli51 when incorporating either solid lipid microparticles or palmitic and stearic acids, respectively, into unripe banana starch and corn starch-based films.However, Augusto et al.52 and Peng et al.53 attributed the increase in water solubility of chitosan films after incorporation of tea and seaweed extracts, respectively, to the reduction in cross-linking degree of intermolecular chitosan chains which may reduce retractive force, promoting water molecules absorption.
3.7. Mechanical properties
Fig. 7a shows the surface response plot of TS as a function of furfural and DSO concentrations. As it can be inferred from isoresponse contours analysis, the TS of NaCas composite films increased with increasing furfural content which had the most significant effect on TS. Based on FTIR analysis (Fig. 4), this reinforcing effect can be ascribed to the formation of crosslinks between furfural and NaCas' primary amine groups, resulting in a more cohesive protein matrix. In agreement with our results, Nayak et al.43 reported a significant increase in TS of soy protein isolate-fatty acid blends upon the addition of furfural. This improvement in the stiffness of composite films has been attributed to the ability of the incorporated furfural to act as an efficient crosslinking agent by interacting with the free amino groups present in soy protein isolate leading to the formation of a rigid and cohesive network. In another study, Hazaveh et al.54 reported a significant increase in TS of fish gelatin films as a result of increasing either ribose or fructose concentration due to the ability of these sugars to crosslink proteins after mild heat treatments.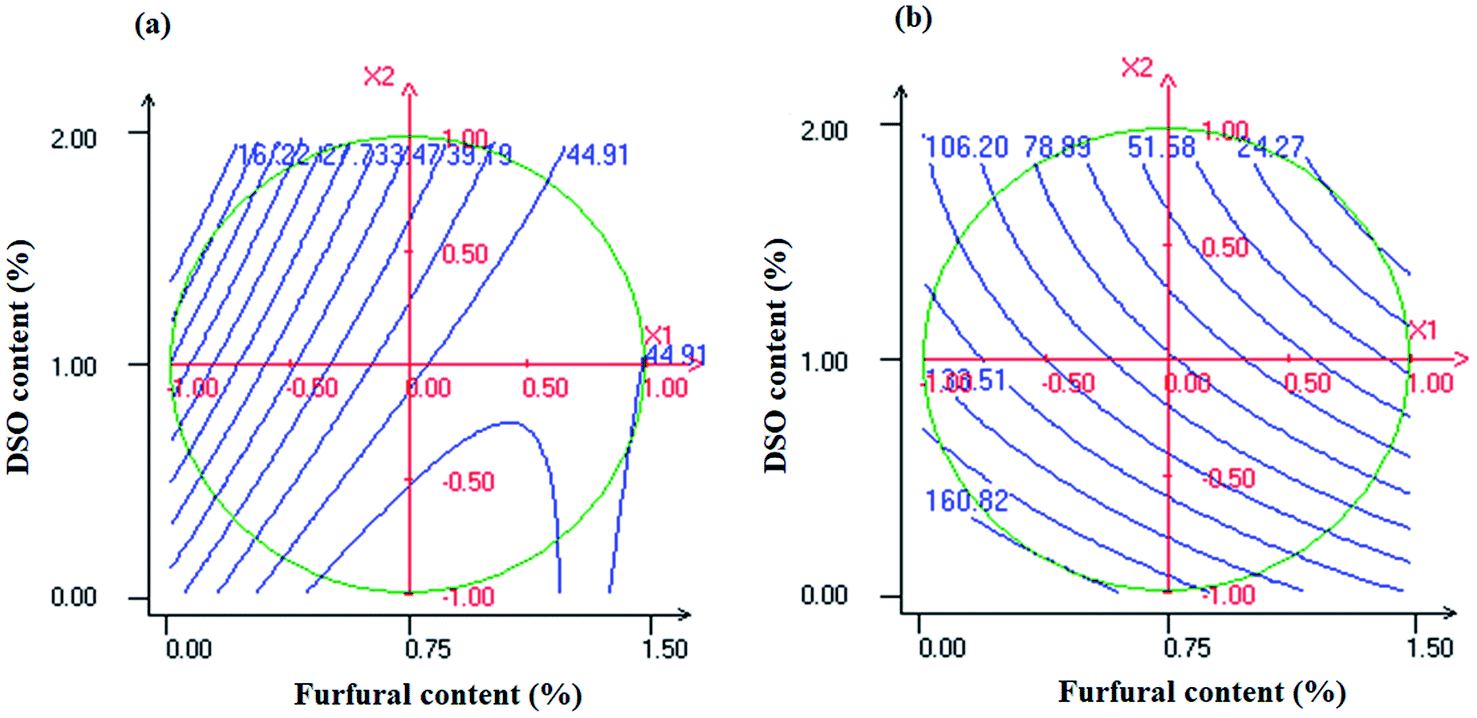 | ||
| Fig. 7 Response surface plots of tensile strength (a) and elongation at break (b) as a function of furfural (X1) and DSO (X2) concentrations. | ||
On the other hand, increasing DSO concentration significantly decreased the TS of NaCas composite films (Fig. 7a).
As revealed by SEM analysis (Fig. 5), this behavior can be explained by the increase in the surface roughness and heterogeneity of the film matrix most likely due to the aggregation and coalescence of lipid droplets during the film drying process which may affect the cohesiveness of the polymeric matrix and reduce its mechanical resistance to fracture. In agreement with our results, a decrease by 90% in TS values of NaCas-based films was reported by Aloui et al.7 because of increasing the tomato pomace lipidic fraction content from 0 to 40 wt%. Previous studies have also reported the weakening effect excreted by hydrophobic compounds on the mechanical resistance of hydrocolloid-based films.55,56
On the other hand, % E values of NaCas-based films were negatively affected by the linear terms of both furfural and DSO contents (Table 4). As shown in Fig. 7b, increasing furfural concentration significantly decreased the % E of the resulting NaCas composite films. As confirmed by ATR-FTIR analysis (Fig. 3), such behavior can be attributed to the strong interactions through covalent and hydrogen bonds between the incorporated agent and the polymeric matrix which may reduce the mobility of the polymeric chains and consequently decrease the flexibility of the resulting films. Our results are in line with data reported by Hazaveh et al.54 who found that sugars reduced water content in gelatin-based films through Maillard reaction which may limit water plasticizing effect leading to the loss of film flexibility. Concerning DSO content, the % E of NaCas-based films decreased with increasing oil concentration (Fig. 7b). A similar effect on % E of chitosan-based films was previously reported by Yuan et al.57 as a result of cinnamon oil incorporation. According to these authors, such decrease in % E of chitosan/cinnamon oil composite films can be attributed to the crosslinking effect arising from the strong interactions between the polymeric matrix and the incorporated oil which may decrease the free volume in the polymer matrix and restrict the mobility of the polymeric chains leading to a decrease in the flexibility of the resulting composite films. In contradiction with our results, Aloui et al.7 reported an increase in the % E of NaCas films because of increasing the concentration of the tomato pomace lipidic fraction from 0 to 40 wt%. Such improvement in the flexibility of the composite films was mainly ascribed to the increase in polymeric chain mobility due to the establishment of new hydrogen bonds between polymer chains and hydrophobic compounds leading to an improvement in the plastic response of the resulting composite films. Previously, Ma et al.56 reported an increase in the flexibility of chitosan-based films because of increasing cinnamon oil concentration. According to these authors, such improvement in the plastic response of composite films can be attributed to the ability of the incorporated hydrophobic compound to act as a plasticizer leading to an increase in the flexibility of the composite films.
3.8. Transparency
Transparency values of NaCas-based films were positively affected by the linear terms of both furfural and DSO contents (Table 4). The effect of furfural on the transparency of the resulting composite films was more pronounced than that of DSO (Table 4). As it can be inferred from Fig. 8, transparency values of NaCas-based films increased with increasing furfural (X1) and DSO (X2) contents indicating an increase in their opacity. These results denote the ability of the incorporated compounds to confer good light barrier properties to the resulting composite films. Such improvement in light barrier properties of NaCas-based films could be attributed to the presence of pigments and light-absorbents such as phenolic and flavonoid compounds in the incorporated compounds that may prevent light transmission through the film along with the difference in the refractive index between the dispersed and continuous phases.55 In agreement with our results, Yao Désiré et al.58 reported an increase in the opacity of cassava starch-based films as a result of increasing peanut oil and/or soybean lecithin contents. According to these authors, the increase in peanut oil and/or soybean lecithin concentration may increase the number of droplets dispersed in the polymeric matrix which may decrease the luminance of the film increasing their opacity. This light scattering effect has been reported to be higher when oil droplets are small and uniformly dispersed in the polymeric matrix.56 Similar observations were previously noticed by Aloui et al.7 who reported an increase in transparency values of NaCas-based films because of increasing the concentration of the tomato pomace lipidic fraction from 0 to 40 wt%. | ||
| Fig. 8 Response surface plot of transparency as a function of furfural (X1) and DSO (X2) concentrations. | ||
3.9. Optimization using desirability function
The desirability function approach was investigated to set the best factors combination simultaneously allowing the maximization of both contact angle and TS of the developed NaCas-based films and the minimization of their solubility. The above-mentioned responses are defined as the most relevant properties describing the functionality of materials intended for food packaging applications. A furfural content of 0.69% and a DSO of 1.76% were selected as the optimum factors' levels producing maximum contact angle (69.85°) and TS (36.47 MPa) and minimum solubility (16.95%) with overall desirability of 0.98. The obtained value of desirability (>0.95) confirms that the predicted values were the closest to achieve the target responses.4. Conclusion
NaCas-based films incorporating two functional compounds from date seed co-products were successfully produced by the casting method. The effects of furfural and DSO contents on the functional and physical properties of NaCas composite films were investigated using response surface methodology. DSO content had a positive effect on water barrier properties of the resulting composite films, however increasing furfural content led to no significant effect on contact angle and solubility responses. With respect to mechanical properties increasing furfural content significantly enhanced the TS of the resulting composite films, however no improvement in terms of film flexibility was observed with increasing both furfural and DSO contents. On the other hand, increasing furfural and DSO contents significantly improved light barrier properties to the resulting composite films. Based on the multi-response optimization procedure, Overall, date palm by-products were converted into functional compounds that were exploited to enhance the functionality of NaCas films. The developed composite films can be investigated as excellent food packaging materials against moisture transfer and photooxidation, making a valuable contribution to the circular economy.Conflicts of interest
The authors declare that there is no conflict of interest.Acknowledgements
This work was supported by the VallCET project (2021–2023) which is funded through the PRIMA (Partnership for Research and Innovation in the Mediterranean Area) by the Ministry of Higher Education and Scientific Research (MHESR, Tunisia).References
- S. K. Pankaj, C. Bueno-Ferrer, N. N. Misra, L. O’Neill, B. K. Tiwari, P. Bourke and P. J. Cullen, Food Res. Int., 2014, 66, 438–444 CrossRef CAS.
- I. Belyamani, F. Prochazka and G. Assezat, J. Food Eng., 2014, 121, 39–47 CrossRef CAS.
- L. Bonnaillie, H. Zhang, S. Akkurt, K. Yam and P. Tomasula, Polymers, 2014, 6, 2018–2036 CrossRef.
- N. Aliheidari, M. Fazaeli, R. Ahmadi, M. Ghasemlou and Z. Emam-Djomeh, Int. J. Biol. Macromol., 2013, 56, 69–75 CrossRef CAS PubMed.
- K. Khwaldia, C. Ferez, S. Banon, S. Desobry and J. Hardy, Crit. Rev. Food Sci. Nutr., 2004, 44, 239–251 CrossRef CAS PubMed.
- C. Broyard and F. Gaucheron, Dairy Sci. Technol., 2015, 95, 831–862 CrossRef CAS.
- H. Aloui, K. Baraket, R. Sendon, A. S. Silva and K. Khwaldia, Int. J. Biol. Macromol., 2019, 139, 128–138 CrossRef CAS PubMed.
- K. Khwaldia, S. Banon, C. Perez and S. Desobry, J. Dairy Sci., 2004, 87, 2011–2016 CrossRef CAS.
- B. Y. Colak, F. Gouanve, P. Degraeve, E. Espuche and F. Prochazka, J. Membr. Sci., 2015, 478, 1–11 CrossRef CAS.
- M. Pereda, N. E. Marcovich and M. A. Mosiewicki, Food Hydrocolloids, 2015, 44, 407–415 CrossRef CAS.
- M. Jahromi, M. Niakousari, M. T. Golmakani, F. Ajalloueian and M. Khalesi, Innovative Food Sci. Emerging Technol., 2020, 66, 102542 CrossRef CAS.
- M. L. Picchio, Y. G. Linck, G. A. Monti, L. M. Gugliotta, R. J. Minari and C. I. Alvarez Igarzabal, Food Hydrocolloids, 2018, 84, 424–434 CrossRef CAS.
- E. Rezvani, G. Schleining, G. Sümen and A. R. Taherian, J. Food Eng., 2013, 116, 598–605 CrossRef CAS.
- J. Bonilla, T. Poloni and P. J. A. Sobral, Int. J. Food Sci. Technol., 2018, 53, 700–708 CrossRef CAS.
- M. Valentino, S. Volpe, F. A. Di Giuseppe, S. Cavella and E. Torrieri, Coatings, 2020, 10, 706 CrossRef CAS.
- H. Aloui and K. Khwaldia, Cellulose, 2017, 24, 4493–4507 CrossRef CAS.
- K. Khwaldia, A. H. Basta, H. Aloui and H. El-Saied, Carbohydr. Polym., 2014, 99, 508–516 CrossRef CAS PubMed.
- Y. R. Wagh, H. A. Pushpadass, F. M. E. Emerald and B. S. Nath, J. Food Sci. Technol., 2014, 51, 3767–3775 CrossRef CAS PubMed.
- A. Marín, L. Atarés, M. Cháfer and A. Chiralt, LWT--Food Sci. Technol., 2017, 79, 60–69 CrossRef.
- W. Kajthunyakarn, R. Khlibsuwan, D. Sakloetsakun and T. Pongjanyakul, J. Drug Delivery Sci. Technol., 2019, 54, 101235 CrossRef CAS.
- M. J. Fabra, A. Jiménez, L. Atarés, P. Talens and A. Chiralt, Biomacromolecules, 2009, 10, 1500–1507 CrossRef CAS PubMed.
- F. O. Obi, B. O. Ugwuishiwu and J. N. Nwakaire, Nigerian Journal of Technology, 2016, 35, 957–964 CrossRef.
- A. Mrabet, A. Jiménez-Araujo, R. Guillén-Bejarano, R. Rodríguez-Arcos and M. Sindic, Foods, 2020, 9 Search PubMed.
- T. Zhang, R. Kumar and C. E. Wyman, RSC Adv., 2013, 3, 9809–9819 RSC.
- R. Lakra, M. S. Kiran, R. Usha, R. Mohan, R. Sundaresan and P. S. Korrapati, Int. J. Biol. Macromol., 2014, 65, 252–257 CrossRef CAS PubMed.
- R. Mariscal, P. Maireles-Torres, M. Ojeda, I. Sádaba and M. López Granados, Energy Environ. Sci., 2016, 9, 1144–1189 RSC.
- B. S. N. Al-Rahbi and D. P. B. Dwivedi, Green Chemistry & Technology Letters, 2016, 2, 219 Search PubMed.
- B. M. Barbosa, J. L. Colodette, D. Longue Júnior, F. J. B. Gomes and D. C. Martino, J. Wood Chem. Technol., 2014, 34, 178–190 CrossRef CAS.
- M. P. Arrieta, M. A. Peltzer, M. D. C. Garrigós and A. Jiménez, J. Food Eng., 2013, 114, 486–494 CrossRef CAS.
- H. Aloui, F. Licciardello, K. Khwaldia, M. Hamdi and C. Restuccia, Int. J. Food Microbiol., 2015, 200, 22–30 CrossRef CAS PubMed.
- L. Sun, J. Sun, L. Chen, P. Niu, X. Yang and Y. Guo, Carbohydr. Polym., 2017, 163, 81–91 CrossRef CAS PubMed.
- H. Aloui, A. R. Deshmukh, C. Khomlaem and B. S. Kim, Food Hydrocolloids, 2021, 113, 106508 CrossRef CAS.
- I. Ismiyarto, N. Ngadiwiyana, T. Windarti, R. S. Purbowatiningrum, M. Hapsari, F. H. Rafi'Ah, S. Suyanti and M. S. Haq, in IOP Conference Series: Materials Science and Engineering, Institute of Physics Publishing, 2017, vol. 172, p. 012027 Search PubMed.
- S. Besbes, C. Blecker, C. Deroanne, G. Lognay, N. E. Drira and H. Attia, Food Sci. Technol. Int., 2004, 10, 333–338 CrossRef CAS.
- M. Kirthy Reddy, H. Durga Rani, C. Naga Deepika, S. Samrawat, V. Akshara and K. Rajesh, Int. J. Curr. Microbiol. Appl. Sci., 2017, 6, 486–492 CrossRef.
- S. V. Veeresh Babu, B. Veeresh, A. A. Patil and Y. B. Warke, Eur. J. Pharmacol., 2010, 626, 262–265 CrossRef CAS PubMed.
- S. T. Kenny, J. N. Runic, W. Kaminsky, T. Woods, R. P. Babu and K. E. O'Connor, Appl. Microbiol. Biotechnol., 2012, 95, 623–633 CrossRef CAS PubMed.
- M. A. Ali, T. A. Al-Hattab and I. A. Al-Hydary, Extraction of Date Palm Seed Oil (Phoenix dactylifera) by Soxhlet Apparatus, 2015, vol. 8 Search PubMed.
- S. Suresh, N. Guizani, M. Al-Ruzeiki, A. Al-Hadhrami, H. Al-Dohani, I. Al-Kindi and M. S. Rahman, J. Food Eng., 2013, 119, 668–679 CrossRef CAS.
- W. Al-Shahib and R. J. Marshall, Int. J. Food Sci. Technol., 2003, 38, 709–712 CrossRef CAS.
- M. Pereda, M. I. Aranguren and N. E. Marcovich, J. Appl. Polym. Sci., 2008, 107, 1080–1090 CrossRef CAS.
- H. Qin, W. Wang, H. Liu, L. Zhang, Q. Wang, C. Shi and K. Yao, Appl. Therm. Eng., 2017, 120, 19–25 CrossRef CAS.
- P. L. Nayak, A. Sasmal, P. K. Nanda, P. L. Nayak, J. Kim and Y. W. Chang, Polym.–Plast. Technol. Eng., 2008, 47, 466–472 CrossRef CAS.
- Y. Zhang, N. Li, Z. Chen, C. Ding, Q. Zheng, J. Xu and Q. Meng, Polymers, 2020, 12, 1–14 Search PubMed.
- R. Dutta, U. Sarkar and A. Mukherjee, Fuel, 2014, 116, 794–802 CrossRef CAS.
- H. Nsubuga, C. Basheer, H. A. S. Al-Muallem and A. N. Kalanthoden, J. Environ. Chem. Eng., 2016, 4, 857–863 CrossRef CAS.
- J. Kadzińska, J. Bryś, E. Ostrowska-Ligęza, M. Estéve and M. Janowicz, Polym. Bull., 2020, 77, 883–900 CrossRef.
- T. Cao, S.-Y. Yang and K. Song, Coatings, 2017, 7, 183 CrossRef.
- X. Li, X. Yang, H. Deng, Y. Guo and J. Xue, Int. J. Biol. Macromol., 2020, 150, 161–168 CrossRef CAS PubMed.
- A. Manrich, F. K. V. Moreira, C. G. Otoni, M. V. Lorevice, M. A. Martins and L. H. C. Mattoso, Carbohydr. Polym., 2017, 164, 83–91 CrossRef CAS PubMed.
- T. Sartori and F. C. Menegalli, Food Hydrocolloids, 2016, 55, 210–219 CrossRef CAS.
- A. Augusto, J. R. Dias, M. J. Campos, N. M. Alves, R. Pedrosa and S. F. J. Silva, Foods, 2018, 7, 53 CrossRef PubMed.
- Y. Peng, Y. Wu and Y. Li, Int. J. Biol. Macromol., 2013, 59, 282–289 CrossRef CAS PubMed.
- P. Hazaveh, A. Mohammadi Nafchi and H. Abbaspour, Int. J. Biol. Macromol., 2015, 79, 370–376 CrossRef CAS PubMed.
- S. Galus, Food Hydrocolloids, 2018, 85, 233–241 CrossRef CAS.
- Q. Ma, D. Hu, H. Wang and L. Wang, Food Hydrocolloids, 2016, 56, 127–133 CrossRef CAS.
- G. Yuan, H. Lv, Y. Zhang, H. Sun and X. Chen, Food Sci. Technol. Res., 2016, 22, 291–296 CrossRef CAS.
- A. Y. Désiré, N. Charlemagne, K. B. Roger, C. Souleymane, A. N. Georges, S. Marianne and T. FabriceAchille, International Journal of Environment, Agriculture and Biotechnology, 2018, 3, 1432–1440 CrossRef.
| This journal is © The Royal Society of Chemistry 2022 |