 Open Access Article
Monodisperse magnetic lecithin-PFP submicron bubbles as dual imaging contrast agents for ultrasound (US) and MRI
Hira Waqara,
Ramish Riazad,
Nasir M. Ahmedb,
Ayesha Isani Majeedc and
Shah Rukh Abbas *ad
*ad
aDepartment of Industrial Biotechnology, ASAB-NUST, Pakistan. E-mail: sabbas@asab.nust.edu.pk
bDepartment of Material Engineering, SCME-NUST, Pakistan
cDepartment of Radiology, PIMS, Pakistan
dBiosensors and Therapeutics Lab, School of Interdisciplinary Engineering and Sciences (SINES)-NUST, Pakistan
First published on 5th April 2022
Abstract
Multimodal imaging is a recent idea of combining two or more imaging methods synergistically to overcome the weakness of individual imaging modalities and utilizing complementary benefits. Ultrasound (US) and magnetic resonance imaging (MRI) are widely used imaging techniques in healthcare and to fully utilize the potential of fusion imaging, dual-modal contrast agents are necessary to improve disease diagnosis by enhancing contrast resolution and reducing health risks associated with the dual dosage of contrast agents. In this study, magnetic microbubbles were synthesized by incorporating oleic acid stabilized superparamagnetic iron oxide nanoparticles (OA-SPIONs) into lecithin microbubbles, encapsulating the perfluoropentane (PFP) core. The magnetic microbubbles were characterized by FTIR, SEM, MFM, zeta potential, in vitro MRI, and ultrasound. Upon in vitro MRI, magnetic microbubbles showed a negative contrast effect by producing darker T2 weighted images. Magnetic microbubbles showed concentration-dependent response with a decrease in signal intensity with an increase in the concentration of OA-IONP in microbubbles. However, a decrease in acoustic enhancement was also observed with an increase in OA-IONP concentration, therefore concentration was optimized to achieve the best effect on both modalities. The magnetic lecithin microbubble with 10 mg SPIONs provided the best contrast on both US and MR imaging. The hemocompatibility testing resulted in hemolysis less than 7% with plasma recalcification time and thrombin time of 240 s and 6 s corresponding to excellent hemocompatibility. Thus the magnetic microbubbles with a phase convertible PFP core encapsulated by a lecithin shell loaded with OA-SPIONs can serve as a potential bimodal contrast agent for both US and MRI imaging.
1. Introduction
In clinical practice, molecular imaging provides information about biological processes via non-invasive approaches offering advantages of real-time performance and continuous monitoring. Traditional imaging techniques that are accessible to radiologists and clinicians include ultrasound (US), magnetic resonance imaging (MRI), positron emission tomography (PET), X-ray, and computed topography (CT). Unfortunately, no single model of imaging modality is perfect as each has its own shortcomings.CT and X-rays are cost-effective and have fast imaging times; however, they require ionizing radiation. PET/SPECT provides the benefit of whole body scanning and takes less time but requires ionizing radiation and limited spatial resolution.1 This can be solved by multimodal imaging which is a recent idea for combining two or more imaging methods synergistically to overcome the weakness of individual imaging modalities.1
MRI and ultrasound are the most utilized modalities due to their non-ionizing nature US has inherent merits of nonionizing nature, portability, high temporal resolution, and cost-effectiveness however is operator dependent, prone to image artifacts, limited field of view and limited contrast resolution. The greater contrast resolution at high frequencies further reduces the penetration power thereby limiting field of view which is required for detailed clinical analysis for better diagnosis. MRI on the other side gives excellent soft tissue contrast and high spatial resolution, but limited by longer acquisition times and lower sensitivity. Both modalities utilize use of non-ionizing radiations and are complementary in terms of contrast and temporal resolution.2 The fusion of US and MRI can help to resolve the drawbacks of individual imaging modalities. The multimodal imaging initially came by the idea of using two modalities in tandem, one right after the other but has now evolved to generation of integrated scanners most common of which are PET/CT and PET/MR machines.3 Recently fused MRI and ultrasound scanners for abdominal imaging especially for image-guided interventions have been developed.2
All the imaging techniques require contrast agents that increase the contrast between the region of interest and its background. The use of multiple contrast agents each specific for an imaging modality can increase the economic burden on patients, increase toxicity, and may interfere with each other. The integrated machines for bimodal imaging stimulated the need for multimodal/bimodal contrast agents for improving diagnosis. Some research groups have combined contrast agents for different imaging techniques to obtain a bimodal contrast agent. The development of a bimodal contrast agent for multimodal imaging is still in its infancy.3
Gadolinium-based contrast agents (GBCAs) are T1 contrast agents (positive contrast agents) paramagnetic having a huge magnetic moment and work by reducing longitudinal relaxation times (T1) of protons producing bright T1 image. Gadolinium exhibit reduced cellular uptake, and carries a risk of nephrogenic systemic fibrosis (NSF).4 Compared with the GBCAs, SPIONs are biocompatible T2 contrasts agents for MRI. SPIONs have a unique capacity to reduce spin–spin relaxation time thus reducing signal intensity producing a darker image.5 The effect of SPIONs on transverse relaxation times doesn't prevent its use on T1 relaxation and can be used to achieve both T1 and T2 weighted images if the sequences are chosen properly.6
Liposomes owing to properties like biocompatible nature, lessened toxicity concerns, the multifunctional surface can serve as a theranostic platform that supports multimodal imaging.7 Lipids due to their soft flexible nature and good echogenic response under the acoustic field have been used as shell materials for core–shell microbubble ultrasound contrast agents. The tunable size, superparamagnetic nature, and surface decoration abilities are few benefits that iron oxide nanoparticles offer that makes them suitable T2 contrast agent for MR imaging. To develop a multimodal contrast agent, liposomes can be hybridized with magnetic nanoparticles to produce magnetic microbubbles.8 Many studies reported the incorporation of hydrophilic iron oxide nanoparticles (IONPs) in the aqueous core of liposomes but only a few research groups showed interest in developing magnetic microbubbles by integrating hydrophobic IONPs in the lipid bilayer for use as negative T2 contrast agent in MRI.9
A large body of literature focuses on superior MR contrast enhancement by magnetic microbubbles however, using perfluorocarbons (PFCs) as the core of such liposomes to amplify backscattered signals on ultrasound is still unexplored. Compared to gaseous core, the perflurocarbons (PFCs) have poor solubility in both water and blood, are inert, low surface tension and have good compatibility.4 Among liquid PFCs, perfluoropentane (PFP) was chosen as core material which when exposed to suitable temperature and acoustic pressure undergoes phase transition5
The current paper is focused on the preparation of magnetic lecithin microbubbles with perfluoropentane (PFP) as core and their use in bimodal US/MR imaging. The synthesis route opted for iron oxide nanoparticles was co-precipitation and SPIONs were stabilized by oleic acid and incorporated in lecithin microbubbles using thin-film hydration. The main objective of our study was to determine the effect of different concentrations of iron NP on ultrasound and MR imaging abilities of designed contrast agents.
2. Experimental
2.1. Materials
Ferric chloride hexahydrate (FeCl3·6H2O), ferric chloride tetrahydrate (FeCl2·4H2O) were purchased from DUKSAN. Oleic acid (OA, 99%), chloroform and sodium hydroxide pellets (NaOH) from Sigma-Aldrich. Cholesterol from Scharlau, and perfluoropentane (PFP) was purchased from Shanghai Tianfu.2.2. Methods
![[thin space (1/6-em)]](https://www.rsc.org/images/entities/char_2009.gif) :
:![[thin space (1/6-em)]](https://www.rsc.org/images/entities/char_2009.gif) 1 and magnetically stirred at 800 rpm under an inert atmosphere. The temperature of the reaction medium was increased to 80 °C and 25% sodium hydroxide (NaOH) solution was added dropwise until black colour appeared that indicated the existence of iron oxide nanoparticles. After a growth of 30 minutes, oleic acid (OA) was added and magnetically stirred at 80 °C for 1 hour. The synthesized nanoparticles were collected using a bar magnet followed by washing with water and acetone and vacuum drying at 60 °C to obtain powder nanoparticle.
1 and magnetically stirred at 800 rpm under an inert atmosphere. The temperature of the reaction medium was increased to 80 °C and 25% sodium hydroxide (NaOH) solution was added dropwise until black colour appeared that indicated the existence of iron oxide nanoparticles. After a growth of 30 minutes, oleic acid (OA) was added and magnetically stirred at 80 °C for 1 hour. The synthesized nanoparticles were collected using a bar magnet followed by washing with water and acetone and vacuum drying at 60 °C to obtain powder nanoparticle.2.3. Characterizations
2.3.9.1. Hemolysis assay. The hemolysis assay was performed using the method reported in the literature.9 Briefly, 3 ml of blood was collected in EDTA vials. The blood was centrifuged at 6000 rpm for 10 minutes to separate blood cells from plasma, blood cells (RBCs) were washed 5 times with isotonic PBS. The washed RBCs were suspended in PBS. The concentration of 10 mg-SPIONs loaded lecithin microbubbles were 1 × 10⁶, 1 × 10⁵, 1 × 10⁴, and 1 × 10³. 20 μl of these samples were transferred to Eppendorf tubes, to which 180 μl of diluted blood suspension was added and allowed to agitate for 30 minutes at 37 °C and were moved to an ice bath before centrifugation at 1500×g. Then 100 μl of supernatant was diluted with 900 μl of chilled PBS and 200 μl of the mixture was added to a 96-well plate. Triton X-100 (0.1%) was used as positive control and PBS was used as a negative control. The absorption for each sample was measured at 550 nm. The percent of hemolysis was calculated using the formula:
2.3.9.2. Thrombin time. Thrombin time test was performed to check bleeding profile. Blood was collected in a tube having anticoagulant (sodium citrate) and was centrifuged at 2000 rpm for 10 minutes at room temperature to obtain platelet rich plasma (PRP). 40 μl of the sample (10 mg SPIONs loaded lecithin microbubbles with concentrations 1 × 10⁶, 1 × 10⁵, and 1 × 10³) was added to PRP. The plasma was warmed at 37 °C and the thrombin reagent was added and the time taken by the plasma to clot was measured using a stopwatch.
2.3.9.3. Plasma recalcification test. Blood was collected in a tube having anticoagulant (sodium citrate) and was centrifuged at 2000 rpm for 10 minutes at room temperature to obtain platelet rich plasma (PRP) which was then centrifuged at 3000 rpm for 5 minutes to get platelet poor plasma (PPP). 40 μl of a sample (10 mg SPIONs loaded lecithin microbubbles with concentration 1 × 10⁶, 1 × 10⁵, and 1 × 10³) was incubated with 100 μl of PPP for 5 minutes at 37 °C. The addition of 20 μl 0.16 M CaCl2 induced clotting and time was recorded for the formation of visible white threads.
3. Results & discussion
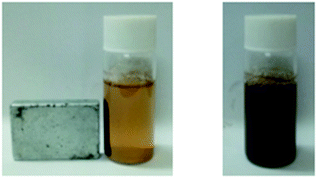
The iron oxide nanoparticles were synthesized and coated with oleic acid using Co-precipitation. The appearance of black color during reaction corresponds to the synthesis of iron oxide nanoparticles. To confirm the magnetic nature of iron oxide NPs, a magnet was placed near to glass vial containing iron NPs and they were readily attracted to an external magnet as evident from Fig. 1.3.1. Fourier transform infrared spectrometry
FTIR analysis was carried out to identify functional groups and to confirm the encapsulation of SPIONs and PFP in the final magnetic microbubble. The obtained FTIR spectrum for bare SPIONs, oleic-SPIONs, unloaded PFP-lecithin microbubble, and SPIONs-PFP loaded lecithin microbubbles are shown in Fig. 2. In bare and OA-SPIONs, the major peak at 631 cm−1 is attributed to Fe–O stretching vibrations indicative of iron oxide nanoparticles.10 The sharp peaks observed at 3420 cm−1 and 3448 cm−1 for bare IONPs and OA-SPIONs respectively correspond to O–H vibrations. In bare SPIONs, the sharp peaks observed at 3420 cm−1 and 1632 cm−1 corresponds to O–H vibrations, implying abundance of hydroxyl groups on the surface of iron oxide nanoparticles.11 The spectrum of OA-SPIONs appears to be similar to that of bare SPIONs with some additional bands at 1420 cm−1 and 1529 cm−1 attributed to asymmetric and symmetric vibrations of the COO– group respectively. This confirms the presence of oleic acid as a carboxyl group (COO–) on the surface of iron nanoparticles. The characteristic band at 1110 cm−1 indicating stretching vibrations of O–C–O bonds of oleate that confirms the coating of oleic acid on the surface of iron oxide nanoparticles. The absence of the C![[double bond, length as m-dash]](https://www.rsc.org/images/entities/char_e001.gif) O band at 1710 cm−1 confirms the single-layer surface modification of oleic acid SPIONs. These results are similar to those reported earlier.10,11
O band at 1710 cm−1 confirms the single-layer surface modification of oleic acid SPIONs. These results are similar to those reported earlier.10,11
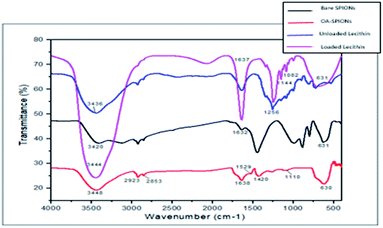 | ||
| Fig. 2 FTIR spectra of bare SPIONs, oleic acid-SPIONs, unloaded PFP-lecithin microbubbles, and SPIONs-PFP loaded lecithin microbubbles. | ||
The FTIR spectrum for SPIONs-PFP encapsulated lecithin microbubbles revealed the efficient encapsulation of PFP and SPIONs in lecithin microbubble with a core–shell structure. The sharp peaks at 3436 cm−1 and 3444 cm−1 corresponding to O–H vibrations (strong hydrogen bonding) of unloaded PFP lecithin microbubbles and SPIONs-PFP loaded lecithin microbubbles respectively. The band corresponding to C![[double bond, length as m-dash]](https://www.rsc.org/images/entities/char_e001.gif) C at 1637 cm−1 suggests chemical bonding between lecithin and cholesterol. The characteristic bands of lecithin P
C at 1637 cm−1 suggests chemical bonding between lecithin and cholesterol. The characteristic bands of lecithin P![[double bond, length as m-dash]](https://www.rsc.org/images/entities/char_e001.gif) O can be found at 1256 cm−1 that lies within bands of 1392 cm−1 to 1159 cm−1 and absorption peaks at 1082 cm−1 for P–O–C stretch are observed as.12 All spectral bands related to lecithin and cholesterol for making liposomes are presented in the figure. The distinctive peak showing strong C–F bonding at 1144 cm−1 can be attributed to indicate encapsulation of (PFP) inside lecithin microbubble. The encapsulation of iron oxide nanoparticles in lecithin microbubble is confirmed by a strong peak observed at 630 cm−1.13
O can be found at 1256 cm−1 that lies within bands of 1392 cm−1 to 1159 cm−1 and absorption peaks at 1082 cm−1 for P–O–C stretch are observed as.12 All spectral bands related to lecithin and cholesterol for making liposomes are presented in the figure. The distinctive peak showing strong C–F bonding at 1144 cm−1 can be attributed to indicate encapsulation of (PFP) inside lecithin microbubble. The encapsulation of iron oxide nanoparticles in lecithin microbubble is confirmed by a strong peak observed at 630 cm−1.13
3.2. Scanning electron microscopy
SEM images of bare-SPIONs, OA-SPIONs, lecithin microbubbles, and SPIONs loaded lecithin microbubbles are shown in Fig. 3. The bare iron oxide nanoparticles showed a size of 70 nm which implies they exhibit critical superparamagnetic behavior. The successful coating of oleic acid to minimize aggregation of iron oxide nanoparticles showed spherical nanoparticles with a size of 172 nm due to long hydrocarbon tails of oleic acid consistent with previous studies.6 The lecithin-shelled microbubbles were spherical with a smoother surface as compared to SPIONs loaded lecithin microbubbles that showed coarser surface which is in good agreement with the literature.14,15 It is noticeable from SEM images that lecithin MBs showed small size but size increases after SPIONs loading. This enlargement of size could be attributed to the successful integration of iron nanoparticles in shells of magnetic microbubbles.8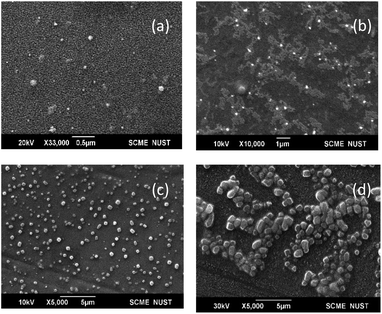 | ||
| Fig. 3 SEM images (a) bare-SPIONs, (b) oleic acid-SPIONs, (c) PFP-lecithin microbubbles, (d) SPIONs loaded PFP-lecithin microbubbles. | ||
3.3. Magnetic force microscopy (MFM)
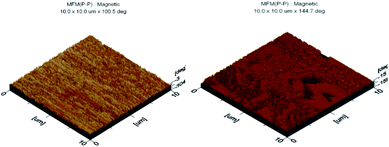
Magnetic force microscopy (MFM) was used to gain information regarding the magnetic behaviour of iron oxide nanoparticles and magnetic lecithin microbubbles. The phase shift detected via MFM depends greatly on particle diameter.6 From Fig. 4, a dipolar contrast was observed for both samples. The bright and dark color in MFM images corresponds to attractive and repulsive interaction between tip and samples as reported in the literature.7 A strong magnetic signal at around 100° from the MFM phase profile was observed that confirms the presence of magnetic iron oxide nanoparticles. A phase shift of 144.7° in magnetic lecithin microbubble was also observed. As the iron oxide nanoparticles were incorporated in lipid microbubbles, the possibility of particle aggregation inside the lipid shell of microbubbles cannot be ignored. The particle aggregation can cause non-uniform distribution of phase shifts due to dipole–dipole interactions within agglomerates as reported by.8 The larger the phase shift, the better the magnetic properties of the sample.93.4. Atomic force microscopy (AFM)
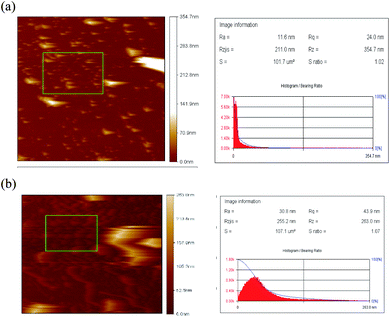
Atomic force microscopy (AFM) was performed on OA-SPIONs as well as SPIONs-loaded lecithin microbubbles. In Fig. 5a and b the surface of SPIONs appear to be relatively smooth with average roughness (Ra) of 11.6 nm and root-mean-square roughness (Rq) of 24 nm. However, SPIONs loaded lecithin microbubbles exhibit a rougher shell structure with average roughness (Ra) = 30.8 nm and root-mean-square roughness of 43 nm. This increase in roughness can be attributed to SPIONs encapsulation in microbubble shell as reported in other studies.10,11 The appearance of a rougher surface after depositing SPIONs in a microbubble shell is analogous to SEM results and confirms the efficient loading of iron oxide NPs to the lecithin shell of microbubbles.3.5. Particle size & zeta potential measurement
The colloidal stability of prepared microbubbles was measured in terms of zeta potential, where a high value of zeta potential corresponds to more repulsive interaction between nanoparticles thus helps to avoid agglomeration.12 The zeta size, zeta potential, and PDI of samples are summarized in Table 1. Oleic acid-coated iron nanoparticles carry a charge of −50 which depicts good stability and reduced aggregation due to the abundance of carboxylate ions covering the surface of nanoparticles analogous to findings of Lai et al. causing greater inter-particles repulsion effect.13 An interesting behaviour was observed for lecithin microbubbles and magnetic microbubbles, the zeta potential decreases from −75.4 to −70 after integration of SPIONs in lipid shells that could be associated with some attractive forces of nanoparticles caused by the interaction of IONPs with the lipid bilayer. Both lecithin and magnetic lecithin MBs exhibited excellent colloidal stability.| Zeta size (nm) | Zeta potential (mV) | Poly dispersity index | |
|---|---|---|---|
| Oleic acid-SPIONs | 271 ± 33.78 | −50 ± 4.66 | 0.015 |
| Lecithin-PFP MBs: peak 1, peak 2 | 753.7 ± 226.2, 362 ± 110 | −75.4 ± 7.16 | 0.431 |
| SPIONs-PFP-loaded lecithin MBs | 644 ± 343.4 | −70 ± 11.5 | 0.137 |
The zeta size analysis summarized in the table showed a sharp peak of 271 nm for oleic acid-coated SPIONs. Plain lecithin microbubbles showed two peaks, peak one of 52.6% intensity was attributed phase converted nanobubble with a size of 753 nm. Peak 2 of 47% intensity corresponds to non-phase converted nanobubbles with a size of 362 nm. Oleic acid-coated SPIONs loaded lecithin microbubbles showed a single sharp peak of 644 nm which showed that all the microbubbles were phase converted. Studies show that the acoustic droplet vaporization threshold needed for phase transition of perfluoropentane (PFP) droplets is achieved either by heating at 29 °C or by providing ultrasound pressure. The incorporation of nanoparticles also helps in reducing the threshold for ADV. Upon phase conversion, gas bubbles increase in size by 3–10 times.14
3.6. Contact angle measurement
The contact angle of oleic acid SPIONs, unloaded lecithin microbubbles, and magnetic microbubbles are depicted in Fig. 6. Oleic acid SPIONs exhibited mild hydrophobicity based on the contact angle of 32° due to the amphiphilic nature of oleic acid coating on naked iron oxide nanoparticles as expected.15 The oleic acid molecule have tails with both carboxyl group (COO–) and methyl group (CH3) that acts as hydrophilic and hydrophobic groups respectively.16 As the contrast agent is bimodal, the successful incorporation of SPIONs in lecithin microbubbles lead to a slight increase in water contact angle from 17.9° to 24° but still considered hydrophilic. This hydrophilic surface functionality can help to exploit the potential of T2 based contrast agents as the hydrophilic surfaces can attract neighbouring water molecules with more power than their intermolecular attractive forces between water molecules.17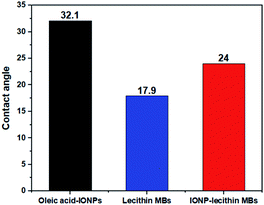 | ||
| Fig. 6 Contact angle measurements of (a) oleic acid-IONPs, (b) plain lecithin MBs, (c) IONPs-loaded lecithin MBs. | ||
3.7. X-ray diffractometry
Fig. 7 shows XRD patterns of synthesized bare, oleic acid modified iron oxide nanoparticles, and SPIONs loaded lecithin microbubbles. As evident from figure, several peaks related to bare SPIONs were observed at 2θ = 20°, 31°, 45°, 50°, 59° with corresponding planes of 160°, 76°, 70.2°, 63° respectively. The diffraction spectrum resembles that of magnetite. However, due to close resemblance of diffraction patterns of magnetite, and magnemite, no conclusions about the phase of samples could be drawn.18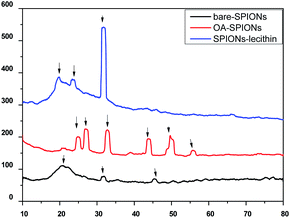 | ||
| Fig. 7 XRD of bare SPIONs, oleic acid coated SPIONs and OA coated SPIONs loaded lecithin nanobubbles. | ||
The observed main diffraction peaks at 2θ = 25°, 27°, 32°, 49°, 55° and peaks at 2θ = 20°, 23°, 32°, 45° are related to oleic acid coated SPIONs and SPIONs loaded lecithin microbubbles respectively. As evident from figure, the coating of oleic acid on bare iron oxide nanoparticles caused reduction in peak intensity and broadening corresponding to reduction in nanoparticles agglomeration size and successful coating of oleic acid on the surface of bare SPIONs. Oleic acid could minimize the magnetic attraction between nanoparticles that could lead to the decrement of crystallite size.19 Also from figures, the increase in coating on nanoparticles caused suppression of iron oxide peaks. SPIONs when incorporated inside lecithin microbubbles showed maximum broadening suggesting the increase in surface layers on nanoparticles caused formation of a more compact structure as reported in literature.20
3.8. In vitro ultrasound imaging
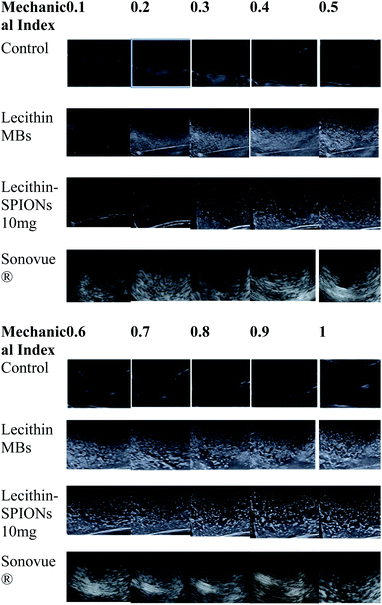
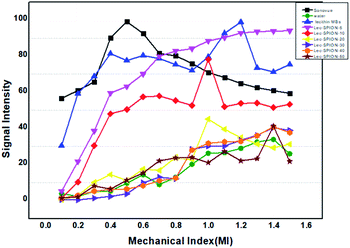
In vitro ultrasound imaging was performed to determine the response of SPIONs loaded lecithin microbubbles in an acoustic field. The ultrasound images for control, and SPIONs loaded lecithin microbubbles are presented in Fig. 8.Compared to control which was water, lecithin microbubbles showed 66 times contrast enhancement, and 10 mg magnetic lecithin microbubbles presented 40 times contrast enhancement. This echogenicity was observed due to the expansion and compression of PFP. Also, the lipid shell of lecithin microbubbles being viscoelastic facilitates the oscillations of the gas core resulting in improved backscattered signal. The concentrations of SPIONs used in formulation were 5 mg, 10 mg, 20 mg, 30 mg, 40 mg, and 50 mg. Fig. 9 shows comparison of ultrasound image intensities of different concentration of oleic acid coated IONPs loaded lecithin microbubbles with water and plain lecithin microbubbles. Magnetic lecithin MBs with 10 mg SPIONs showed better response. Both loaded and unloaded microbubbles showed comparable response to standard Sonovue® contrast agent especially at higher MIs.
The plain lecithin microbubbles without SPIONs showed maximum contrast enhancement among all constructs. Lecithin microbubbles with 5 mg and 10 mg SPIONs showed comparable enhancement but with increase in SPION dose, drop in signal was observed. This reduction in a backscattered signal can be explained by the phenomenon that encapsulating oleic acid-coated SPIONs to the bilayer of lecithin can alter its viscoelastic properties resulting in a stiffer shell that hinders the oscillations of microbubbles thus providing less contrast enhancement as reported by previous studies.21,22 Another study reported the synthesis of PVA microbubbles with SPIONs embedded in shell and on the surface of shell were checked for both MR and US image enhancement. Their results also showed that an increase in SPION dosage causes a decrease in ultrasound contrast.2
3.9. Magnetic characterization using vibrating sample magnetometer (VSM)
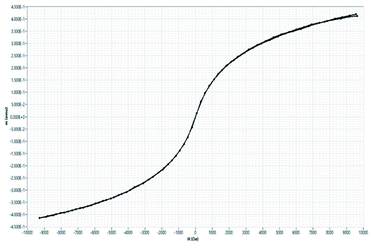
The magnetic hysteresis curve is shown Fig. 10. There is no pronounced hysteresis loop that confirms the superparamagnetic behaviour of oleic acid-modified iron oxide nanoparticles. The samples exhibit coercivity and remanence values close to zero suggesting superparamagnetic behaviour. The saturation magnetization (Ms) values for oleic acid modified iron oxide nanoparticles is 8.28 emu g−1 which is smaller than those reported in the literature23 which can be attributed to presence of non-magnetic layer of oleic acid surrounding magnetic core. Earlier literature shows small size can cause larger spin disordering and canting effects which lead to a reduction in magnetization24 which is consistent with our results. The magnetic properties shown by VSM, and MFM showed the potential of designed construct to be used as T2 contrast agent in MR imaging.3.10. In vitro magnetic resonance imaging (MRI)
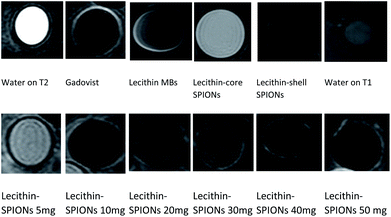
The contrast effect on MRI of all samples having different densities of SPIONs (5, 10, 20, 30, 40, 50 mg) were compared to water and lecithin microbubbles without SPIONs and commercially used Gadovist.In routine MR imaging, mild T2 shortening effects (decrease in signal) of gadolinum contrast agent at low doses are usually masked by dominant T1 shortening effects (increase in signal) and are therefore not normally observed. As the concentration of gadolinum contrast agent increases, signal intensity decreases causing darkening effects on T2 weighted image and it depends on particular tissue.25 Gadolinum contrast agent is excreated and concentrated in kidney and bladder. Urine in bladder may exhibit a unique and rare triple-layering phenomenon, where T2 shortening effects dominates giving darker contrast in bottom pseudolayer having highest concentration of gadolinum, also middle layer having moderate concentration results in T1 shortening.26 Gadovist® is used for comparison to magnetic lecithin microbubbles which at high concentration gives negative contrast enhancement resulting in darker T2 images.
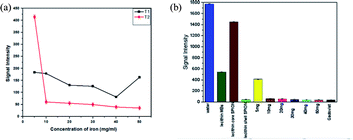
Fig. 11a describes the comparative analysis of T1 and T2 image intensities of all the samples having different iron concentrations. It was observed that all the samples showed better T2 response as the concentration of iron increases, a considerable drop in signal intensity was observed that is in good agreement with the literature.10,27,28 As only a moderate contrast change was observed for the T1 weighted image so it suggests that the liposomal formulation might be more favourable to be used as a T2 contrast.
The samples containing 10 mg SPIONs resulted in a 20-fold reduction in signal intensity when compared to concentrated commercial contrast agent Gadovist®. The principle of MR depends on protons that precess with a Larmor frequency of 42.58 MHz when an RF pulse of the same frequency is applied, protons absorb this energy and start precessing in phase in a particular direction. The presence of magnetic material results in local magnetic field inhomogeneity in samples due to difference in Larmor frequencies causing dephasing of magnetization of protons ultimately resulting in shortening of T2.29,30 From Fig. 11b and 12, it is evident that by increasing iron oxide NPs in lecithin microbubble, the signal intensity decreases thus intensifying the darkening of the image. The increase in the concentration of iron nanoparticles accelerates the spin–spin relaxation process due to increase interactions between magnetic center and protons.
Many parameters can affect T2 values like the type of surface modification of magnetic materials, degree of hydration, ligands attached to the contrast agent. It is noticeable from contact angle measurement, decrease in contact angle produces a hydrophilic surface of both unloaded and loaded lecithin bubbles that attract more water resulting in more spin–spin relaxation giving a greater negative contrast. A moderate darkening of lecithin bubbles without SPIONs was also observed. The possible explanation for this lecithin formulation is a complex molecule having ligands rich in π-electrons that can create small local magnetic fields as they precess at a frequency different than that of protons causing a local magnetic field inhomogeneity. Also, different elements and functional groups precess at a different frequency causing increase in local magnetic field inhomogeneity that results in faster dephasing of protons.31
3.11. Hemocompatibility testing
Due to safety concerns, iron-oxide based MR contrast agents haven been taken off from the market. To overcome this various coated IONPs are under research. Magento liposomes have been investigated as safe alternated to SPIONs as T2-contrast agents.32 The current study not only described the MR potential but also showed encapsulation of PFP making it as dual mode contrast agent for both MRI and ultrasound. Once contrast effect is established, next step is safety evaluation.For safety evaluation of developed magnetic microbubbles, a hemolysis assay was performed using human blood to study its interaction with red blood cells. Various concentrations range from 1 × 10⁶ to 1 × 10³ MBs per ml were used. The microbubbles with the highest concentration (1 × 10⁶) showed less than 7% hemolysis from Fig. 13. The magnetic microbubbles were also tested for change in bleeding time. The magnetic microbubbles showed a thrombin time of 6 s and a plasma recalcification time of 240 s which is similar to that of normal plasma times that confirms microbubbles showed no significant effect on bleeding times and did not impede the clotting at any stage. Table 2 shows the thrombin time and plasma recalcification time of samples with various concentrations.
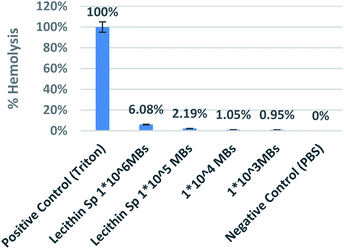 | ||
| Fig. 13 Graph showing % hemolysis with different concentration of iron loaded lecithin MBs with Triton as positive and PBS as negative control. | ||
| Samples | Thrombin time (Tt) (s) | Plasma recalcification time (s) |
|---|---|---|
| Plasma | 8 | 240 |
| Plasma + PBS | 10 | 220 |
| Lecithin-IONP (1 × 10⁶) | 6 | 220 |
| Lecithin-IONP (1 × 10⁵) | 5 | 240 |
| Lecithin-IONP (1 × 10³) | 5 | 240 |
| Aspirin | 35 |
3.12. Biocompatibility testing
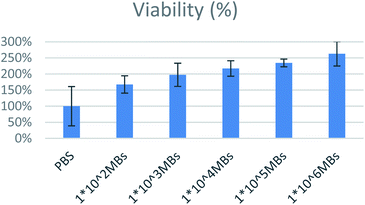
For safety establishment of magnetic microbubbles, biocompatibility testing on MCF-7 lines was performed. Various concentrations range from 1 × 10⁶ to 1 × 10² MBs per ml were assessed. All bubbles were found to be biocompatible as shown in Fig. 14. Bioactivity of lecithin has already been reported in literature and has been exploited in cell growth and tissue engineering applications. Similar finding was observed in our case. Increase in amount of lecithin microbubbles increased the cellular viability.334. Conclusions
Oleic acid-coated SPIONs embedded in lecithin microbubbles proved to be a suitable candidate for bimodal imaging of ultrasound and MRI. The magnetic lecithin microbubble with 10 mg iron oxide NPs concentration provides a suitable balance of contrast effect on both ultrasound and MR images. The designed construct showed good blood compatibility with haemolysis less than 7% and holds great potential for multimodal imaging in the future.Conflicts of interest
There are no conflicts to declare.References
- M. Wu, Multimodal Molecular Imaging: Current Status and Future Directions, Contrast Media Mol. Imaging, 2018, 2018, 1382183 Search PubMed.
- C. Sciallero, L. Balbi, G. Paradossi and A. Trucco, Magnetic resonance and ultrasound contrast imaging of polymer-shelled microbubbles loaded with iron oxide nanoparticles, R. Soc. Open Sci., 2016, 3(8), 160063 CrossRef PubMed.
- J. Rieffel, U. Chitgupi and J. F. Lovell, Recent Advances in Higher-Order, Multimodal, Biomedical Imaging Agents, Small, 2015, 11(35), 4445–4461 CrossRef CAS PubMed.
- M. Pilarek, Liquid perfluorochemicals as flexible and efficient gas carriers applied in bioprocess engineering: an updated overview and future prospects, Chem. Process Eng., 2014, 35(4), 463–487 CAS.
- P. G. Durham and P. A. Dayton, Applications of sub-micron low-boiling point phase change contrast agents for ultrasound imaging and therapy, Curr. Opin. Colloid Interface Sci., 2021, 56, 101498 CrossRef CAS.
- S. Mourdikoudis, R. M. Pallares and N. T. K. Thanh, Characterization techniques for nanoparticles: comparison and complementarity upon studying nanoparticle properties, Nanoscale, 2018, 10(27), 12871–12934 RSC.
- X. Li, W. Lu, Y. Song, Y. Wang, A. Chen and B. Yan, et al., Quantitatively probing the magnetic behavior of individual nanoparticles by an AC field-modulated magnetic force microscopy, Sci. Rep., 2016, 6, 1–8 CrossRef CAS PubMed.
- Y. Zhang, M. Yang, M. Ozkan and C. S. Ozkan, Magnetic Force Microscopy of Iron Oxide Nanoparticles and Their Cellular Uptake, Biotechnol. Prog., 2009, 25(4), 923–928 CrossRef CAS PubMed.
- L. Yue, Y. Jin, W. Zhang and D. J. Sellmyer, Magnetic force microscopy study of Zr2Co11-based nanocrystalline materials: effect of MO addition, J. Nanomater., 2015, 2015, 151740 Search PubMed.
- G. Guo, L. Lu, L. Yin, J. Tu, X. Guo and J. Wu, et al., Mechanical and dynamic characteristics of encapsulated microbubbles coupled by magnetic nanoparticles as multifunctional imaging and drug delivery agents, Phys. Med. Biol., 2014, 59(22), 6729–6747 CrossRef PubMed.
- E. Bagheripour, A. R. Moghadassi, F. Parvizian, S. M. Hosseini and B. Van der Bruggen, Tailoring the separation performance and fouling reduction of PES based nanofiltration membrane by using a PVA/Fe3O4 coating layer, Chem. Eng. Res. Des., 2019, 144, 418–428 CrossRef CAS.
- A. Prabhakar and R. Banerjee, Nanobubble Liposome Complexes for Diagnostic Imaging and Ultrasound-Triggered Drug Delivery in Cancers: A Theranostic Approach, ACS Omega, 2019, 4(13), 15567–15580 CrossRef CAS PubMed.
- C. W. Lai, F. W. Low, M. F. Tai and S. B. Abdul Hamid, Iron oxide nanoparticles decorated oleic acid for high colloidal stability, Adv. Polym. Technol., 2018, 37(6), 1712–1721 CrossRef CAS.
- P. S. Sheeran and P. A. Dayton, Phase-Change Contrast Agents for Imaging and Therapy, Curr. Pharm. Des., 2012, 18(15), 2152–2165 CrossRef CAS PubMed , http://www.eurekaselect.com/openurl/content.php?genre=article%26issn=1381-6128%26volume=18%26issue=15%26spage=2152.
- T. Lü, D. Qi, D. Zhang, Y. Lü and H. Zhao, A facile method for emulsified oil-water separation by using polyethylenimine-coated magnetic nanoparticles, J. Nanopart. Res., 2018, 20, 88 CrossRef.
- S. Munjal and N. Khare, Transforming single domain magnetic CoFe2O4 nanoparticles from hydrophobic to hydrophilic by novel mechanochemical ligand exchange, J. Nanopart. Res., 2017, 19, 1 CrossRef CAS.
- J. W. Song and L. W. Fan, Temperature dependence of the contact angle of water: a review of research progress, theoretical understanding, and implications for boiling heat transfer, Adv. Colloid Interface Sci., 2021, 288, 102339 CrossRef CAS PubMed.
- M. Bloemen, W. Brullot and T. T. Luong, et al., Improved functionalization of oleic acid-coated iron oxide nanoparticles for biomedical applications, J. Nanopart. Res., 2012, 14, 1100 CrossRef PubMed.
- F. C. Nalle and A. Sabarudin, Synthesis & characterization of magnetic Fe3O4 nanoparticles using oleic acid as stabilizing agent, Rasayan J. Chem., 2019, 12(1), 14–21 CrossRef CAS.
- R. Gupta, K. Pancholi and R. De Sa, et al., Effect of Oleic Acid Coating of Iron Oxide Nanoparticles on Properties of Magnetic Polyamide-6 Nanocomposite, JOM, 2019, 71, 3119–3128 CrossRef CAS.
- Z. Liu, T. Lammers, J. Ehling, S. Fokong, J. Bornemann and F. Kiessling, et al., Iron oxide nanoparticle-containing microbubble composites as contrast agents for MR and ultrasound dual-modality imaging, Biomaterials, 2011, 32(26), 6155–6163 CrossRef CAS PubMed.
- X. Cai, F. Yang and N. Gu, Applications of magnetic microbubbles for theranostics, Theranostics, 2012, 2(1), 103–112 CrossRef CAS PubMed.
- K. Yan, H. Li, P. Li, H. Zhu, J. Shen and C. Yi, et al., Biomaterials self-assembled magnetic fluorescent polymeric micelles for magnetic resonance and optical imaging, Biomaterials, 2013, 35(1), 344–355 CrossRef PubMed.
- A. Aliakbari, M. Seifi, S. Mirzaee and H. Hekmatara, Influence of different synthesis conditions on properties of oleic acid-coated-Fe3O4 nanoparticles, Mater. Sci., 2015, 33(1), 100–106 CAS , https://content.sciendo.com/view/journals/msp/33/1/article-p100.xml.
- M. Rohrer, H. Bauer, J. Mintorovitch, M. Requardt and H. J. Weinmann, Comparison of magnetic properties of MRI contrast media solutions at different magnetic field strengths, Invest. Radiol., 2005, 40(11), 715–724 CrossRef PubMed.
- A. D. Elster, W. T. Sobol and W. H. Hinson, Pseudolayering of Gd-DTPA in the urinary bladder, Radiology, 1990, 174(2), 379–381 CrossRef CAS PubMed.
- M. S. Martina, J. P. Fortin, C. Ménager, O. Clément, G. Barratt and C. Grabielle-Madelmont, et al., Generation of superparamagnetic liposomes revealed as highly efficient MRI contrast agents for in vivo imaging, J. Am. Chem. Soc., 2005, 127(30), 10676–10685 CrossRef CAS PubMed.
- M. R. Faria, M. M. Cruz, M. C. Gonçalves, A. Carvalho, G. Feio and M. B. F. Martins, Synthesis and characterization of magnetoliposomes for MRI contrast enhancement, Int. J. Pharm., 2013, 446(1–2), 183–190 CrossRef CAS PubMed.
- E.-W. Radue, M. Weigel, R. Wiest and H. Urbach, Introduction to Magnetic Resonance Imaging for Neurologists, CONTINUUM: Lifelong Learning in Neurology, 2016, 22(5), 1379–1398 Search PubMed , http://journals.lww.com/00132979-201610000-00006.
- P. Oswald, O. Clement, C. Chambon, E. Schouman-Claeys and G. Frija, Liver positive enhancement after injection of superparamagnetic nanoparticles: respective role of circulating and uptaken particles, Magn. Reson. Imaging, 1997, 15(9), 1025–1031 CrossRef CAS PubMed.
- N. Kostevšek, A review on the optimal design of magnetic nanoparticle-based T2 MRI contrast agents, Magnetochemistry, 2020, 6(1), 1–12 CrossRef.
- N. Kostevšek, C. C. L. Cheung and I. Serša, et al., Magneto-Liposomes as MRI Contrast Agents: A Systematic Study of Different Liposomal Formulations, Nanomaterials, 2020, 10(5), 889 CrossRef PubMed.
- Z. Xu, P. Liu, H. Li, M. Zhang and Q. Wu, In vitro study on electrospun lecithin-based poly(L-lactic acid) scaffolds and their biocompatibility, J. Biomater. Sci., Polym. Ed., 2020, 31(17), 2285–2298 CrossRef CAS PubMed.
| This journal is © The Royal Society of Chemistry 2022 |


