 Open Access Article
Trap column-based intact mass spectrometry for rapid and accurate evaluation of protein molecular weight†
Gyu-Min Lim a,
Byung-Gee Kim
 ab and
Hee-Jin Jeong
 *c
*c
aInterdisciplinary Program for Biochemical Engineering and Biotechnology, Seoul National University, Seoul, 08826, South Korea
bBio-MAX/N-Bio, Seoul National University, Seoul, 08826, South Korea
cDepartment of Biological and Chemical Engineering, Hongik University, Sejong, 30016, South Korea. E-mail: heejinjeong@hongik.ac.kr
First published on 24th May 2022
Abstract
The determination of the molecular weight (MW) of a protein using high-resolution mass spectrometry (MS) is a crucial tool used to confirm whether the protein was correctly expressed and adequately purified. However, a non-volatile buffer is normally used for protein purification and storage. Therefore, a pre-treatment step using ultrafiltration (UF) is required to exchange the buffer with a volatile buffer prior to the introduction of the protein sample into the MS equipment. This pre-treatment step is time-consuming. In this study, a trap column-based pre-treatment method applied in a nano-LC system was developed for rapid and convenient analysis of the MW of proteins. First, the trap column system was compared with the conventional UF treatment system and non-treatment system using bovine serum albumin. Subsequently, the trap column system was applied to analyze the MW of commercially available and lab-synthesized recombinant proteins. The intensity of the base peak and signal-to-noise ratio of the trap column-based pre-treated protein were higher than those of the UF-treated protein. Moreover, the entire automated procedure of the trap column-based system was conducted within 20 min, which confirms its use in versatile and accurate protein identification.
Introduction
Recombinant proteins are commonly produced by transforming cells using DNA, followed by the induction of protein overexpression using isopropyl β-D-1-thiogalactopyranoside. The expressed protein is extracted from the cell lysate and purified by affinity tag-based purification, which uses affinity beads that bind to the tag inserted at the end of the protein.1–4 Subsequently, by comparing the position of the electrophoretically separated protein on the gel with the bands of a standard marker, electrophoresis-based SDS-PAGE analysis is used to evaluate whether the protein was properly expressed and within the expected size range.5,6 However, owing to imperfections in protein folding and post-translational modification that occurs when proteins are expressed in cells, a difference of 5–10% is obtained between the expected molecular weight (MW) and the MW results derived from the SDS-PAGE analysis, which impedes accurate protein identification.7–10 Subsequently, the measurement of protein MWs using high-resolution mass spectrometry (MS) has become possible, which enables faster and more accurate identification of protein MWs than conventional SDS-PAGE-based analysis.11–14 However, since signal suppression occurs in MS owing to protein storage buffers, such as PBS, Tris, and HEPES, they cannot be used for MS.15 Instead, volatile salt-containing buffers, such as ammonium acetate-containing buffer, are commonly used for MS. However, ammonium acetate acts as a buffer when the pKa reaches 4.7 (acetic acid) and 9.2 (ammonium), and its useful pH ranges are 3.8–5.8 and 8.2–10.2.16,17 When ammonium acetate is dissolved in water, the pH of the solution is neutral. However, the pH of the ammonium acetate solution in water changed significantly, even when a small amount of H+ or OH− is added. Moreover, the pH of the ammonium acetate solution changes over time owing to its volatility. Thus, ammonium acetate may not a suitable physiological buffer for long-term protein storage. Therefore, purified proteins are stored in non-volatile buffers, such as PBS, Tris or HEPES, to stabilize the proteins. Subsequently, the buffer is exchanged with an MS-compatible buffer using molecular weight cut-off (MWCO) ultrafiltration (UF) prior to MS analysis.15 However, several issues exist with the type of sample pre-treatment process. (1) UF of several samples requires considerable labor and time, and UF columns are expensive; (2) protein loss and aggregation occurs during UF;18,19 (3) when the target protein undergoes an auto-reaction, modifications may occur during UF, which prevents accurate MS analysis.A trap column of nano-LC was developed to reduce the time and pressure required to load a large quantity of sample (2–5 μL) at a low flow rate.20,21 For example, nano-LC without a trap column requires 16 min to load a 5 μL sample onto an analytical column at a flow rate of 0.3 μL min−1. Because the pressure in the analytical column is critical, it is not preferable to increase the flow rate or shorten the loading time. To resolve this issue, a trap column with a wider diameter than that of commonly used analytical columns was developed. The trap column-installed nano-LC concentrated the sample at a higher flow rate (5 μL min−1) and then introduced it to the analytical column, resulting in a reduction in sample loading time from 16 to 1 min. Salt removal from the sample followed the trapping process, which was performed automatically using a trap column. The trap column was also used with other analytical columns for nano liquid chromatography-mass spectrometry (LC-MS) analysis.22–24 For example, a capillary-scale monolithic trap column has been used for one- or two-dimensional separation of peptide or protein samples using desalting and preconcentration as pretreatment steps.25 However, to the best of our knowledge, no studies have reported the use of a trap column to identify the intact mass of a protein. Based on the trap column characteristics that enabled both sample concentration and salt removal, we hypothesized that the labor- and time-intensive UF-based buffer exchange process may be omitted using a trap column in nano-LC, thereby shortening the time required for protein size determination. Moreover, it was expected that protein aggregation and loss during the UF process19 would be minimized.
In this study, intact protein identification was conducted by measuring the MW of proteins using a trap column without pretreatment. First, we compare three MS analysis methods with or without a pretreatment step using bovine serum albumin (BSA) as a model protein. This protein is easily available and information on its amino acid sequence for calculating the theoretical MW is known. The trap column-based method is then applied to verify the MW of commercially available protein sample with a known sequence. Subsequently, sequence of a recombinant protein, which was expressed from cells and purified, was resolved in a purification or storage buffer (Fig. 1).
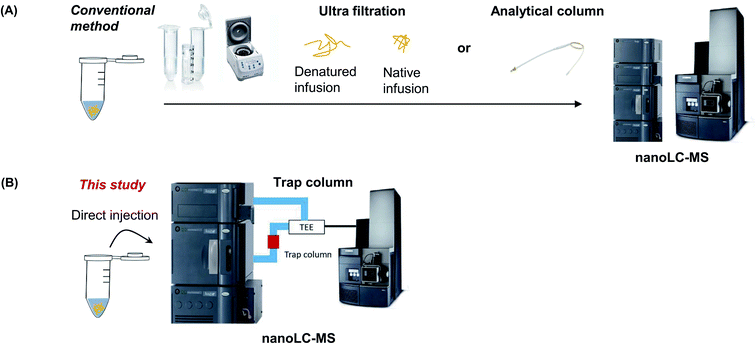 | ||
| Fig. 1 Schematic diagram of the conventional sample preparation method using UF filter (A) or trap column (B). | ||
Results and discussion
Intact MS analysis without pretreatment
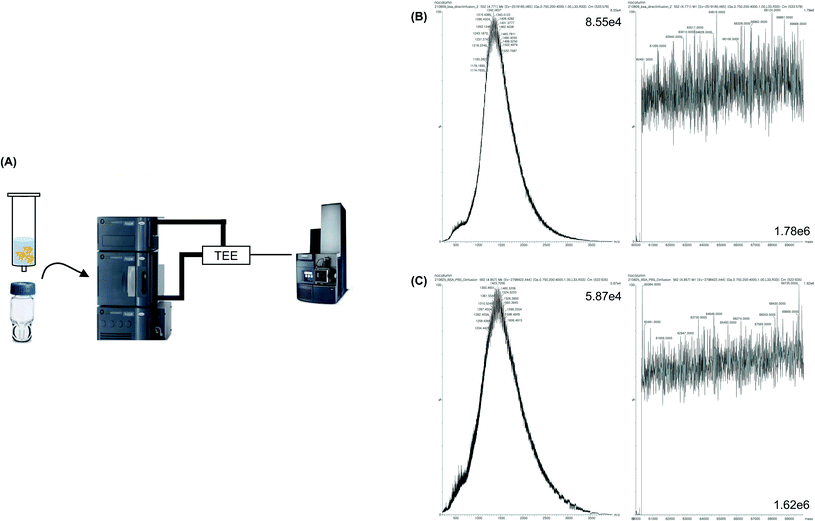
The MW of BSA dissolved in 1 M PBS was measured without pretreatment (Fig. 2A). As expected, the identification of proteins based on the deconvolution result was difficult because the signal-to-noise ratio (S/N) was low owing to the formation of salt adductions (Fig. 2C). Therefore, 0.1% formic acid was added to the protein sample, which was reported to increase the ionization efficiency of a protein sample by supplying proton ions as adducts to the sample via an acid–base reaction. Moreover, formic acid lowered the pH of the protein, which caused protein denaturation, and thereby provided the space for the attachment of proton ions to the protein. Thus, a low concentration of formic acid is typically added to a protein sample to obtain a clear MS peak.26,27 When 0.1% formic acid was added to the sample and MS analysis of the sample was performed without pretreatment, protein identification was also difficult. However, a slightly higher S/N than that of the sample without formic acid was observed (Fig. 2B). Hence, since it was difficult to measure the MW of the protein without pretreatment, a simple and effective sample pretreatment step was required for desalting the protein sample.Intact MS analysis after desalting using ultrafiltration
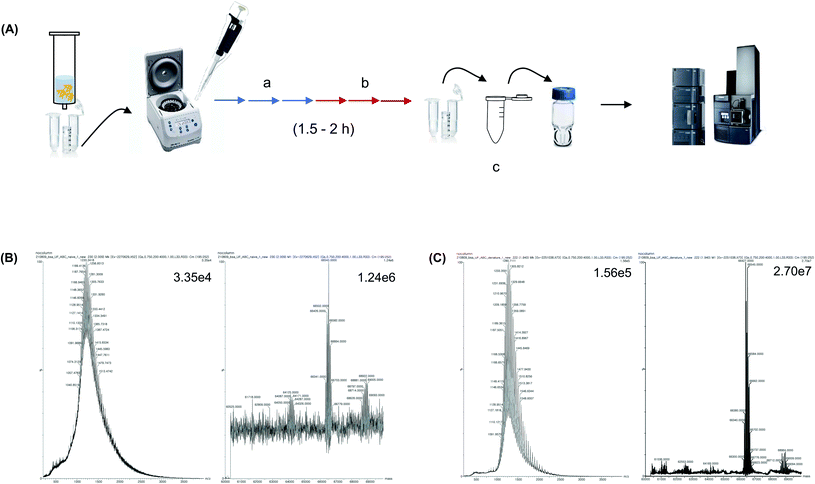
Widely known desalting methods for protein pretreatment prior to MS analysis include precipitation, 2D GELErEE and UF.15,28,29 Precipitation and 2D GELFrEE are used when a large number of proteins are present in the sample. Whereas, UF is used when the sample is initially purified and has a low complexity, that is, 1–5 proteins exist in the sample. Desalting using UF has traditionally been performed because the UF filter column is easily available and facilitates the exchange of salt-containing buffer with the MS compatible volatile buffer. In this study, we aimed to analyze purified proteins rather than whole proteins that contain several proteins, such as cellular and organ protein extracts. Therefore, UF-based desalting was performed and the results were compared with those of trap-column-based pretreatment. The BSA sample was dissolved in 1 M PBS and centrifuged using a 3K MWCO UF column for 10 min. Subsequently, the buffer was exchanged three times every 15 min using a 10 mM ammonium bicarbonate solution; then, the buffer was exchanged three times every 15 min using a 2.5 mM ammonium bicarbonate solution (Fig. 3A). Subsequently, the sample was diluted to 50 ng μL−1 with a 0.1% formic acid aqueous solution and injected into the MS instrument to analyze the native form of the protein. It was confirmed that the UF treatment step removed the salt, compared to the sample without UF (Fig. 3B). Moreover, the MS spectrum and deconvolution results of the sample after UF treatment showed a high S/N and high spectral resolution. Subsequently, the protein samples were denatured by dilution with 0.1% formic acid in 50% acetonitrile. The S/N was higher than that of the native form of the protein, and the MW of the protein was accurately determined from the MS peak after deconvolution, which confirmed the efficacy of the UF treatment (Fig. 3C). Nonetheless, the UF process required 1.5–2 h, and the buffer-exchange procedure every 10–15 min is labor-intensive. Moreover, the amount of sample decreased during the UF treatment.Intact MS analysis using an analytical column
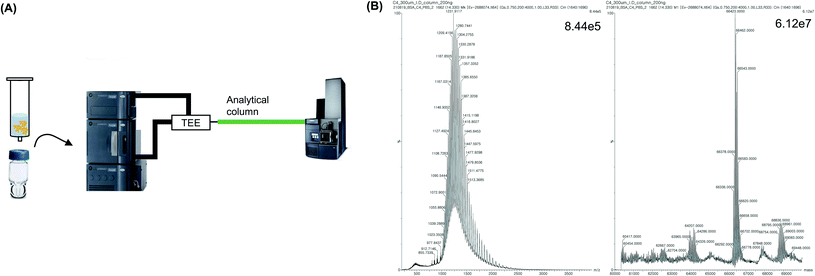
To decrease the sample loss caused by UF treatment, and reduce the laborious pretreatment step, an analytical C4 column was directly connected to the MS instrument, and the sample was injected into the column. Subsequently, the protein MW was analyzed without any intermediate process (Fig. 4A). First, desalting was conducted using an analytical column instead of UF. Next, 2 μL of the sample was injected into the column and 100% flow of mobile phase A (0.1% formic acid in water) was applied for 10 min to trap and desalt the protein in the column. Subsequently, 50% of mobile phase A and 50% of mobile phase B (0.1% formic acid in acetonitrile) was flowed for 20 min to analyze the MW of the trapped protein in the denatured form using MS. It was observed that the protein MW was accurately measured and the value was similar to the expected MW, which was calculated based on the amino acid sequence of BSA (Fig. 4B). Furthermore, the S/N was higher than that of UF-treated protein peaks. No need for a separate pretreatment step was identified, since pretreatment was conducted automatically according to the LC method, resulting in a simplified procedure with a reduced analysis time (by more than 30 min). Therefore, these results indicate that a similar analytical result was obtained with less labor and time, using the analytical column-based method compared with the UF-based method. However, because the analytical column for nano-LC was designed to separate proteins from trap proteins, the length of the column was long (150–250 mm) and the inner diameter (ID) was narrow (<75 μm), which resulted in blockages caused by contaminants and salts in the sample without pretreatment.30,31 In particular, because the sample had a high MW of intact proteins that could aggregate, the frit of the column, which had a narrow ID, was easily blocked. Consequently, 30 min was required to allow the solvent to flow and eliminate the salt.Intact MS analysis using a trap column
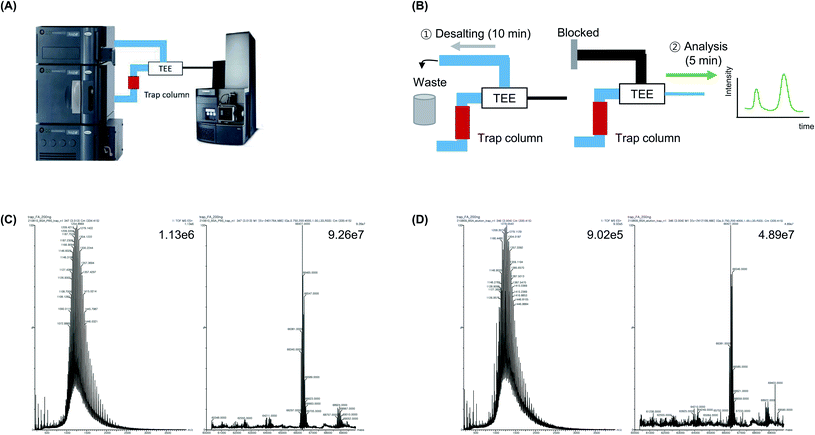
A trap column, which is located ahead of the analytical column, is typically used to concentrate a small amount of the sample to reduce the sample loading time and minimize peak broadening.32,33 Moreover, the salt in the sample is eliminated during the trapping process using a trap column (Fig. 5A). Because the trap column is located before the fork that separates the waste line, TEE, and analysis line, it is possible to control whether the sample enters the waste line or analysis line using the LC method (Fig. 5B). The proteins in the sample were trapped when the sample was injected into a trap column. Subsequently, the protein sample was concentrated and desalted, after which mobile phase A was flowed to the waste line for 15 min at a flow rate of 5 μL min−1, followed by MS analysis. MS analysis was conducted by flowing 50% mobile phase A and 50% mobile phase B for 5 min into the nanoline at a relatively low flow rate (1 μL min−1). In addition, because the trap column had a larger ID (150 μm) and shorter length (20 mm) than the analytical column (ID: 75 μm; length: 150 mm), it was washed at a flow rate that was five times faster compared with the flow rate used to wash the analytical column. This resulted in a reduced analysis time and the risk of column blockages was avoided.Based on these advantages, BSA in PBS was analyze using the developed trap column-based method. The analysis was performed within 20 min, and the base peak intensity was 9.26 × 10⁷, which was 3.42-fold higher than that of the UF-treated sample (2.70 × 10⁷) and 1.5-fold higher than that of the analytical column-treated sample (6.12 × 10⁷) (Fig. 5C and D). The average mass value (66![[thin space (1/6-em)]](https://www.rsc.org/images/entities/char_2009.gif) 427 Da) was similar to that of commercial BSA (66
427 Da) was similar to that of commercial BSA (66![[thin space (1/6-em)]](https://www.rsc.org/images/entities/char_2009.gif) 430–66
430–66![[thin space (1/6-em)]](https://www.rsc.org/images/entities/char_2009.gif) 462 Da) as well as the theoretical MW of BSA, which was calculated based on its amino acid sequence (Uniprot sequence P02769: 66
462 Da) as well as the theoretical MW of BSA, which was calculated based on its amino acid sequence (Uniprot sequence P02769: 66![[thin space (1/6-em)]](https://www.rsc.org/images/entities/char_2009.gif) 432 Da, PDB sequences 4F5S and 3V03: 66
432 Da, PDB sequences 4F5S and 3V03: 66![[thin space (1/6-em)]](https://www.rsc.org/images/entities/char_2009.gif) 462 Da). When we confirmed the backpressure values after each analysis and compared the processing time with that of the analytical column-based method, approximately no time was required for washing and regeneration of the trap column, which indicate that the risk of column blockage was significantly lower than that of the analytical column. Additionally, we dissolved BSA using elution buffer for Ni-NTA affinity tag purification (50 mM NaH2PO4, 300 mM NaCl, 500 mM imidazole) and identified the protein using the trap column-based method. It was observed that the salt caused equipment damage and blocked the spray tip, which should be eliminated before the sample entered the MS. Subsequently, during trap column-based MS analysis, the sample was washed at a fast flow rate, salt was removed, and protein analysis was achieved within 20 min without buffer exchange.
462 Da). When we confirmed the backpressure values after each analysis and compared the processing time with that of the analytical column-based method, approximately no time was required for washing and regeneration of the trap column, which indicate that the risk of column blockage was significantly lower than that of the analytical column. Additionally, we dissolved BSA using elution buffer for Ni-NTA affinity tag purification (50 mM NaH2PO4, 300 mM NaCl, 500 mM imidazole) and identified the protein using the trap column-based method. It was observed that the salt caused equipment damage and blocked the spray tip, which should be eliminated before the sample entered the MS. Subsequently, during trap column-based MS analysis, the sample was washed at a fast flow rate, salt was removed, and protein analysis was achieved within 20 min without buffer exchange.
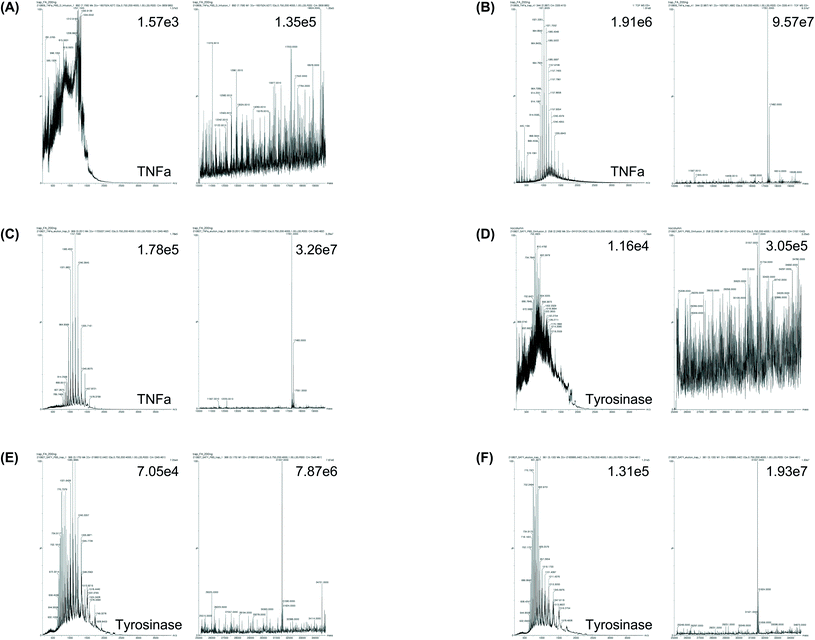
After comparing the three methods using BSA, we further verified the efficacy of the trap column method by applying the method for the accurate MW determination of two recombinant proteins: commercial human tumor necrosis factor alpha (TNFα) and lab-synthesized tyrosinase. First, a commercial TNFα, whose amino acid sequence is known, was analyzed using the trapping method (Fig. 6A–C). Consequently, when the TNFα was dissolved in PBS and no pretreatment step was conducted, it was difficult to determine the MW by MS analysis. Furthermore, when TNFα was dissolved in a high concentration of salt-containing protein elution buffer and no pretreatment step was conducted, the emitter tip was blocked and MS analysis was impossible. However, when the trap column method was used, the MW of TNFα dissolved in PBS or the protein elution buffer was clearly determined within 20 min. Since the protein was expressed in bacteria (E. coli), two peaks could be present in the mass spectrum, which indicate whether the N-terminal methionine (start codon) exists or falls when methionine aminopeptidase is operational.34 Accordingly, the calculated mass values of TNFα were 17![[thin space (1/6-em)]](https://www.rsc.org/images/entities/char_2009.gif) 483 Da (without methionine cleavage) and 17
483 Da (without methionine cleavage) and 17![[thin space (1/6-em)]](https://www.rsc.org/images/entities/char_2009.gif) 352 Da (with methionine cleavage), respectively. The MS results showed that the MW of TNFα was different (±1 Da) compared with that of the expected value (17
352 Da (with methionine cleavage), respectively. The MS results showed that the MW of TNFα was different (±1 Da) compared with that of the expected value (17![[thin space (1/6-em)]](https://www.rsc.org/images/entities/char_2009.gif) 352 Da). When the analysis was conducted with 0.2 Da resolution using TNFα dissolved in Tris–HCl or PBS with glycerol, the deconvolution mass was almost the same as the expected mass, which indicated that the present method is applicable to the analysis of proteins stored in commonly used protein storage buffers (Table 1 and ESI Fig. 2 and 3†).
352 Da). When the analysis was conducted with 0.2 Da resolution using TNFα dissolved in Tris–HCl or PBS with glycerol, the deconvolution mass was almost the same as the expected mass, which indicated that the present method is applicable to the analysis of proteins stored in commonly used protein storage buffers (Table 1 and ESI Fig. 2 and 3†).
| Solvent | Deconvolution mass (Da) |
|---|---|
| 50 mM Tris–HCl | 17![[thin space (1/6-em)]](https://www.rsc.org/images/entities/char_2009.gif) 351 351 |
| 100 mM Tris–HCl | 17![[thin space (1/6-em)]](https://www.rsc.org/images/entities/char_2009.gif) 351 351 |
| 200 mM Tris–HCl | 17351.2 |
| 1 M Tris–HCl | 17![[thin space (1/6-em)]](https://www.rsc.org/images/entities/char_2009.gif) 351 351 |
| PBS | 17![[thin space (1/6-em)]](https://www.rsc.org/images/entities/char_2009.gif) 351 351 |
| PBS with 10% glycerol | 17351.2 |
| PBS with 20% glycerol | 17351.2 |
| PBS with 30% glycerol | 17351.2 |
| PBS with 40% glycerol | 17351.4 |
| PBS with 50% glycerol | 17351.2 |
Subsequently, tyrosinase was analyzed, which is a self-reactive protein. As the enzyme can actively react if its concentration increases during UF, the pretreatment of the enzyme using UF is not suitable (Fig. 6D–F). Tyrosinase was expressed in E. coli and purified using Ni-NTA affinity chromatography with a universal elution buffer (50 mM NaH2PO4, 300 mM NaCl, 500 mM imidazole), which contained the maximum salt concentration among the protein solvents. Subsequently, the MW was directly analyzed using the trap column method. Although protein identification without pretreatment was difficult, as expected, MW determination was achieved within 20 min using the trap column method, and the MW of the identified peak corresponded to 31![[thin space (1/6-em)]](https://www.rsc.org/images/entities/char_2009.gif) 557 Da, which varied by only 2 Da compared with the expected MW of tyrosinase (31
557 Da, which varied by only 2 Da compared with the expected MW of tyrosinase (31![[thin space (1/6-em)]](https://www.rsc.org/images/entities/char_2009.gif) 555 Da). This result indicates that recombinant proteins, which were produced using a universal method, such as cellular expression followed by Ni-NTA purification, may be identified within 20 min without an additional buffer exchange procedure by applying the trap column method, even at a high salt concentration in the buffer. Moreover, it was possible to accurately determine the MW of a protein, using a small amount of sample (100 ng), which was comparable to the traditional protein size evaluation method, SDS-PAGE, followed by Coomassie brilliant blue (CBB) staining or silver staining, which has a protein detection range of 100 ng and 1 ng, respectively.35,36
555 Da). This result indicates that recombinant proteins, which were produced using a universal method, such as cellular expression followed by Ni-NTA purification, may be identified within 20 min without an additional buffer exchange procedure by applying the trap column method, even at a high salt concentration in the buffer. Moreover, it was possible to accurately determine the MW of a protein, using a small amount of sample (100 ng), which was comparable to the traditional protein size evaluation method, SDS-PAGE, followed by Coomassie brilliant blue (CBB) staining or silver staining, which has a protein detection range of 100 ng and 1 ng, respectively.35,36
Conclusions
In this study, a method was developed for the rapid determination of protein MW within 20 min using a nano-LC-MS coupled with a trap column. Compared to the traditional method, this process did not use any pretreatment step, which typically requires more than 1 h for sample pretreatment using UF, or compared to the analytical column-based method, which requires 30 min and has a high risk of blockage. Moreover, the trap column-based method showed a higher base peak intensity than the UF-based and analytical column-based methods, indicating that a high sensitivity and small sample quantity of approximately 100 ng may be used to achieve an accurate protein MS. Because this trap column-based protein identification method is simple, rapid, and accurate, we propose that it may be used for MW measurement and identification of various proteins of interest. By combining this method with the fragmentation procedure and bottom-up peptide sequencing, such as in-solution digestion, filter aid sample preparation (FASP), and S-trap, convenient and accurate MW measurement of a protein and protein sequencing may be conducted.Experimental section
Materials
Bovine serum albumin (Cat. no. BSAS 0.1) was obtained from Bovogen (Keilor East, Australia). Recombinant human TNFα (Cat. no. 10602-HNAE) was obtained from Sino Biological (Beijing, China). UF column (MWKO 3K, Cat. no. UFC500396) was obtained from Millipore (Burlington, MA). PBS was obtained from Biosesang (Seoul, Korea). LC-MS grade acetonitrile, water, and methanol were obtained from Duksan (Seoul, Korea). LC-MS grade formic acid was obtained from Sigma Aldrich (St Louis, MO). Emitter tip (Cat. no. 186003916, pre-cut pico tip emitter 360 μm OD × 20 ID μm 10 μm tip), ACQUITY UPLC M-Class Symmetry C18 trap column (Cat. no. 186008821, 100 A, 5 μm, 180 μm × 20 mm), C4 analytical column (Cat. no. 186004639, 1.7 μm BEH 300 C4 75 μm × 100 mm), and LC with ACQUITY UPLC M-Class System, composed by Trap Valve Manager, μSample Manager–FL, and μBinary Solvent Manager Module, Mass spectrometry Xevo G2-XS Q-tof were obtained from Waters Corporation (Milford, MA).Protein sample preparation
A 50 ng μL−1 BSA solution was prepared by dissolving 2.5 mg of BSA in 50 mL of PBS, PBS with 0.1% formic acid, or Ni-NTA elution buffer (50 mM NaH2PO4, 300 mM NaCl, 500 mM imidazole, pH 8.0). Desalting using a UF column was performed as follows: 100 μL of 5 μg μL−1 BSA in PBS was loaded onto a 3K MWCO UF column, and the buffer was exchanged with 350 μL of 10 mM ammonium bicarbonate solution three times, followed by three buffer exchanges using 350 μL of 2.5 mM ammonium bicarbonate solution. After desalting using the UF column, the concentration of the protein was determined using a nanodrop, and the protein was diluted to 50 ng μL−1 using 0.1% formic acid in water or 0.1% formic acid in 50% acetonitrile. Commercially available purified recombinant TNFα protein was dissolved in 1 M PBS or Ni-NTA elution buffer and directly injected into the trap column. The expression and purification of recombinant tyrosinase were performed according to the method described by our group.37 The concentration of the purified tyrosine was determined using a nanodrop.38 Half of the protein content in the elution buffer was directly used for analysis, and the remaining half was used for buffer exchange using the UF column.LC-MS analysis
5 μL of sample loop was used for nanoinjection, and the details of the capillary tube connection are summarized in ESI Fig. 1.† The lines were replaced according to each analysis method with the use of different tube connecting methods as follows: (1) direct injection without column: μSample Manager–FL and total recovery vial (186000385c) was used for loading the sample, because the μSample Manager–FL is suitable for handling a small sample volume below 5 μL and reducing sample loss. LC analysis was performed using the Direct injection mode (Masslynx), and the analytical gradient was solvent A (50%) and solvent B (50%) for 10 min. MS was scanned at a rate of 2 Hz from 500 to 4000 m/z. (2) Analysis after analytical column-based pretreatment: the method was the same as in (1), except that line 2 was changed to the 186004639 BEH C4 column. LC analysis was performed using the Direct injection mode (Masslynx). The analytical gradient was 100% solvent A (1 μL min−1) for 10 min, followed by solvent A (50%) and solvent B (50%) for 20 min. MS was scanned at a rate of 2 Hz from 200 to 4000 m/z. (3) Analysis using a trap column: the method was the same as in (1), except that line 1 was changed to a 186008821 trap column. LC analysis was performed in Trapping mode (Masslynx). The trapping gradient table consisted of 99% solvent A (5 μL min−1) and 1% solvent B for 15 min. The analytical gradient was 50% solvent A (1 μL min−1) and 50% solvent B for 5 min. MS was scanned at a rate of 2 Hz from 200 to 4000 m/z.Solvent A, solvent B, strong needle wash solution, seal wash solution, and weak needle wash solution contained 0.1% formic acid in water, acetonitrile with 0.1% formic acid, acetonitrile with 0.1% formic acid, 10% acetonitrile, and 3% acetonitrile with 0.1% TFA, respectively. A Nanoflow TM ESI source, universal nanosprayer with a pre-cut pico tip emitter (360 μm OD × 20 ID μm, 10 μm tip) was used as the ionization source. Tuning was performed using the MS tune parameter (Glu-fibrinopeptide B, 785.842 m/z, +2 charge state). The details regarding the LC and MS methods of the MSlynx program and each parameter are described in the ESI.† Data processing was performed using MassLynx and MaxEnt 1 deconvolution software using the following parameters: Damage model; uniform Gaussian width at half-height: 0.75 Da; minimum intensity ratios: left = 33%, right = 33%; output mass resolution: 1 Da per channel; output mass range of TNFα: 10–20 kDa; output mass range of BSA: 60–70 kDa; output mass range of tyrosinase: 25–35 kDa.
Author contributions
Conceptualization, G.-M. L., B.-G. K. and H.-J. J.; methodology and analysis, G.-M. L.; investigation, G.-M. L. and H.-J. J.; writing—original draft preparation, G.-M. L.; writing—review and editing, B.-G. K. and H.-J. J.; supervision, H.-J. J. All authors reviewed the manuscript.Conflicts of interest
There are no conflicts to declare.Acknowledgements
This work was supported by Korea Medical Device Development Fund grant (KMDF_PR_20200901_0073) and National Research Foundation of Korea (NRF) grants (NRF-2020R1I1A307411712, 2021H1D3A2A02096525) funded by the Korea Government.Notes and references
- A. Spriestersbach, J. Kubicek, F. Schafer, H. Block and B. Maertens, Methods Enzymol., 2015, 559, 1–15 CAS.
- A. Einhauer and A. Jungbauer, J. Biochem. Biophys. Methods, 2001, 49, 455–465 CrossRef CAS PubMed.
- X. Y. Zhao, G. S. Li and S. F. Liang, J. Anal. Methods Chem., 2013, 2013, 1–8 CrossRef PubMed.
- R. S. Donovan, C. W. Robinson and B. R. Glick, J. Ind. Microbiol., 1996, 16, 145–154 CrossRef CAS PubMed.
- U. K. Laemmli, Nature, 1970, 227, 680–685 CrossRef CAS PubMed.
- Z. Q. Liu, T. Mahmood and P. C. Yang, N. Am. J. Med. Sci., 2014, 6, 160 CrossRef PubMed.
- A. L. Shapiro, E. Vinuela and J. V. Maizel, Biochem. Biophys. Res. Commun., 1967, 28, 815–820 CrossRef CAS PubMed.
- A. K. Dunker and R. R. Rueckert, J. Biol. Chem., 1969, 244, 5074–5080 CrossRef CAS PubMed.
- J. G. Williams and W. B. Gratzer, J. Chromatogr., 1971, 57, 121–125 CrossRef CAS PubMed.
- K. Weber and M. Osborn, J. Biol. Chem., 1969, 244, 4406–4412 CrossRef CAS PubMed.
- M. Mann and N. L. Kelleher, Proc. Natl. Acad. Sci., 2008, 105, 18132–18138 CrossRef CAS PubMed.
- A. J. Heck and R. H. Van Den Heuvel, Mass Spectrom. Rev., 2004, 23, 368–389 CrossRef CAS PubMed.
- K. Muneeruddin, J. J. Thomas, P. A. Salinas and I. A. Kaltashov, Anal. Chem., 2014, 86, 10692–10699 CrossRef CAS PubMed.
- K. Muneeruddin, M. Nazzaro and I. A. Kaltashov, Anal. Chem., 2015, 87, 10138–10145 CrossRef CAS PubMed.
- D. P. Donnelly, C. M. Rawlins, C. J. DeHart, L. Fornelli, L. F. Schachner, Z. Q. Lin, J. L. Lippens, K. C. Aluri, R. Sarin, B. F. Chen, C. Lantz, W. Jung, K. R. Johnson, A. Koller, J. J. Wolff, I. D. G. Campuzano, J. R. Auclair, A. R. Ivanov, J. P. Whitelegge, L. Pasa-Tolic, J. Chamot-Rooke, P. O. Danis, L. M. Smith, Y. O. Tsybin, J. A. Loo, Y. Ge, N. L. Kelleher and J. N. Agar, Nat. Methods, 2019, 16, 587–594 CrossRef CAS PubMed.
- L. Konermann, J. Am. Soc. Mass Spectrom., 2017, 28, 1827–1835 CrossRef CAS PubMed.
- B. Lide and J. Thomas, CRC Handbook of Chemistry and Physics, CRC Press, 83rd edn, 2002–2003 Search PubMed.
- K. J. Kim, V. Chen and A. G. Fane, Biotechnol. Bioeng., 1993, 42, 260–265 CrossRef CAS PubMed.
- M. E. Cromwell, E. Hilario and F. Jacobson, AAPS J., 2006, 8, E572–E579 CrossRef CAS PubMed.
- G. Mitulovic, M. Smoluch, J. P. Chervet, I. Steinmacher, A. Kungl and K. Mechtler, Anal. Bioanal. Chem., 2003, 376, 946–951 CrossRef CAS PubMed.
- S. R. Wilson, T. Vehus, H. S. Berg and E. Lundanes, Bioanalysis, 2015, 7, 1799–1815 CrossRef CAS PubMed.
- J. Alcantara-Duran, D. Moreno-Gonzalez, M. Beneito-Cambra and J. F. Garcia-Reyes, Talanta, 2018, 182, 218–224 CrossRef CAS PubMed.
- F. Rigano, A. Albergamo, D. Sciarrone, M. Beccaria, G. Purcaro and L. Mondello, Anal. Chem., 2016, 88, 4021–4028 CrossRef CAS PubMed.
- X. Shao, X. T. Wang, S. Guan, H. Z. Lin, G. Q. Yan, M. X. Gao, C. H. Deng and X. M. Zhang, Anal. Chem., 2018, 90, 14003–14010 CrossRef CAS PubMed.
- C. Schley, R. Swart and C. G. Huber, J. Chromatogr. A, 2006, 1136, 210–220 CrossRef CAS PubMed.
- A. A. Doucette, D. B. Vieira, D. J. Orton and M. J. Wall, J. Proteome Res., 2014, 13, 6001–6012 CrossRef CAS PubMed.
- A. Kruve and K. Kaupmees, J. Am. Soc. Mass Spectrom., 2017, 28, 887–894 CrossRef CAS PubMed.
- L. Jiang, L. He and M. Fountoulakis, J. Chromatogr. A, 2004, 1023, 317–320 CrossRef CAS PubMed.
- A. T. Phillips and M. W. Signs, Curr. Protoc. Protein Sci., 2005, 38, 4.4 Search PubMed.
- I. A. H. Ahmad, Chromatographia, 2017, 80, 705–730 CrossRef.
- M. Noga, F. Sucharski, P. Suder and J. Silberring, J. Sep. Sci., 2007, 30, 2179–2189 CrossRef CAS PubMed.
- H. Roberg-Larsen, S. R. Wilson and E. Lundanes, TrAC, Trends Anal. Chem., 2021, 136, 116190 CrossRef CAS.
- S. R. Wilson, C. Olsen and E. Lundanes, Analyst, 2019, 144, 7090–7104 RSC.
- Y. Liao, Protein Sci., 2004, 13, 152 CrossRef PubMed.
- J. L. Brunelle, R. Green, Methods in Enzymology, Laboratory Methods in Enzymology: Protein Part C, 2014, vol. 541, pp. 161-167 Search PubMed.
- A. T. Kopylov, V. G. Zgoda, A. V. Lisitsa and A. I. Archakov, Proteomics, 2013, 13, 727–742 CrossRef CAS PubMed.
- S. H. Lee, K. Baek, J. E. Lee and B. G. Kim, Biotechnol. Bioeng., 2016, 113, 735–743 CrossRef CAS PubMed.
- P. Desjardins, J. B. Hansen and M. Allen, J. Visualized Exp., 2009, 33, 1610 Search PubMed.
Footnote |
| † Electronic supplementary information (ESI) available. See https://doi.org/10.1039/d2ra00429a |
| This journal is © The Royal Society of Chemistry 2022 |

