 Open Access Article
Development of bacterial resistance induced by low concentration of two-dimensional black phosphorus via mutagenesis†
Huixiang Wangab,
Fang Fangab,
Chengxun Dengbc,
Chengzhu Zhuad,
Zhimin Yubc and
Xiaowei Liu *bc
*bc
aSchool of Resources and Environmental Engineering, Hefei University of Technology, Hefei 230009, China
bSchool of Biology, Food, and Environment, Hefei University, Hefei 230601, China. E-mail: liuxw@hfuu.edu.cn
cInternational (Sino-German) Joint Research Center for Biomass of Anhui Province, Hefei, 230601, China
dKey Laboratory of Nanominerals and Pollution Control of Higher Education Institutes, Hefei University of Technology, Hefei 230009, China
First published on 30th May 2022
Abstract
The wide use of nano-antibacterial materials has triggered concerns over the development of nanomaterials-associated bacterial resistance. Two-dimensional (2D) black phosphorus (BP) as a new class of emerging 2D nanomaterial has displayed excellent antibacterial performance. However, whether bacteria repeatedly exposed to 2D BP can develop resistance is not clear. We found that wild type E. coli K-12 MG 1655 strains can increase resistance to 2D-BP nanosheets after repeated exposure with subinhibitory concentration of 2D-BP nanosheets. Adaptive morphogenesis including the reinforced barrier function of cell membrane were observed in the resistant bacteria, which enhanced the resistance of bacteria to 2D-BP nanosheets. The whole-genome sequencing analysis showed that the three mutation genes including dmdA, mntP, and gyrA genes were observed in the 2D-BP resistant strains, which controlled catabolism, membrane structure, and DNA replication, respectively. Furthermore, transcriptional sequencing confirmed that these genes related to metabolization, membrane structure, and cell motility were upregulated in the 2D-BP resistant bacteria. The development of resistance to 2D-BP in bacteria mainly attributed to the changes in energy metabolism and membrane structure of bacteria caused by gene mutations. In addition, the up-regulated function of cell motility also helped the bacteria to develop resistance by escaping external stimuli. The results provided new evidence for understanding an important effect of nano-antibacterial materials on the development of bacterial resistance.
1 Introduction
Nanomaterials, especially for two-dimensional (2D) nanomaterials with layered nanostructures and unique surface interface interaction, have emerged as one of the potential effective ways to eliminate bacterial infection via physically slicing through membrane, phospholipid extraction or generating reactive oxide species.1–3Although some studies have suggested that nano-antibacterial materials can inactivate bacteria including pathogens,1,4,5 long-term exposure of some nano-materials with sub-inhibitory concentrations can cause bacteria to develop resistance.6–9 For example, chronic exposure to low concentrations of graphene oxide8 and nanostructured titanium dioxide9 increased the pathogenicity of bacteria through adaptive morphogenesis such as protease release, filamentation, thickening of the cell wall, biofilm formation, and the enhanced bacterial mobility, which indicated that bacteria may adapted to antimicrobial nanomaterials by repetitive exposures. After repetitive exposure to silver nanoparticles (AgNPs) by over six cultivation cycles, E. coli developed steady resistance to AgNPs, mainly due to the aggregation of the nanoparticles caused by the production of the adhesive flagellum protein flagellin.6 Obviously, chronic exposure to some nanomaterials may potentially trigger the resistant evolution in bacteria, and different nanomaterials exhibited specific resistant mechanisms. Therefore, for the guarantee of human health and biological safety, the risk assessment of these emerging nanomaterials is urgent to be conducted before their commercial applications.
Two-dimension black phosphorus (BP), as a new class of emerging 2D materials, has been applied in biomedical field, energy storage, optoelectronics, environmental remediation, flexible electronics, sensors, etc.10–12 In addition, 2D-BP has strong photothermal effect and surface mediated adsorption characteristics, making it show obvious advantages in antibacterial effect.13–15 For example, the hydrophilic BP nanosheets could effectively attach to bacteria, facilitating their photothermal inactivation.16 Given the application potential of 2D-BP in future, it is imperative to understand its healthy and ecological impacts. However, little is known about whether bacteria repeatedly exposed to 2D-BP can develop the resistance and the corresponding effect mechanism.
This study used wild-type E. coli to investigate the evolution of bacteria by repeated exposure to 2D-BP suspension ranging from sub-minimum inhibitory concentration (sub-MIC) to MIC by 17 cultivation cycles. The main objectives were to evaluate the resistant phenotypic change of bacteria repeatedly exposed to sub-MIC of BP suspension, and to further investigate the physiological and genetic changes responsible for bacterial resistance to 2D-BP. Finally, a better understanding of the biological effect of 2D-BP exposure was obtained to guide and regulate its application and environmental release limits.
2 Material and methods
2.1 Preparation and characterization of 2D BP nanosheets
The bulk BP crystals were purchased from a commercial supplier (99.998%, Hefei Zhongke Materials Co., Ltd) and were grounded in a N2 glove box. The 2D-BP nanosheets were prepared according to a liquid exfoliation method.17,18 In detail, 500 mg BP crystal powder was added to 100 mL distilled water. The mixture was treated in an ice bath with a probe sonicator (JY92-IIN, Scientz, China) and argon (Ar) bubbling for 6 h. Next, residual unexfoliated BP particles were removed by centrifugation at 1000 rpm for 10 min. The 2D-BP nanosheets were collected from supernatant by centrifugation at a 13![[thin space (1/6-em)]](https://www.rsc.org/images/entities/char_2009.gif) 000 rpm for 10 min, and further freeze-dried for the preparation of 2D-BP stock solution. The morphology and structure of 2D-BP were characterized by transmission electron microscopy (TEM; H-7650, Hitachi, Japan) and atomic force microscopy (AFM; Agilent 5100, Agilent Technologies, USA).
000 rpm for 10 min, and further freeze-dried for the preparation of 2D-BP stock solution. The morphology and structure of 2D-BP were characterized by transmission electron microscopy (TEM; H-7650, Hitachi, Japan) and atomic force microscopy (AFM; Agilent 5100, Agilent Technologies, USA).
2.2 Strains and exposure experiment
The wild-type sensitive E. coli K-12 MG 1655, which was obtained from the Institute of Microbiology Chinese Academy of Sciences, was streaked on a Luria–Bertani (LB) agar plates and allowed to grow for 14 h. One single colony was picked randomly and inoculated into LB broth at 200 rpm min−1 for 12 h incubation at 37 °C to obtain bacterial suspension, which was diluted to a concentration of ∼107 colonies per mL (CFU mL−1) by sterilized LB liquid medium for exposure experiments. The MIC (90% inhibition of growth) of 2D-BP for the sensitive bacterial stains was determined based on the inhibition curves of E. coli exposed to a series of 2D-BP nanosheets dispersions at different concentrations.19 The selective exposure concentrations of 2D-BP increased from the sub-MIC 1.9 mg L−1 to the MIC concentration 250 mg L−1 of the sensitive stain (the MIC was predetermined and showed in Fig. S1†) in geometric progression (1.9, 3.9, 7.8, 15.6, 31.3, 62.5, 125, and 250 mg L−1) considering the effect of potential environmental exposure concentrations and sub-MIC.5,20–22The selective exposure procedures referred the previous studies.6,21 The original bacterial stains were gradually exposed to the serial selection concentrations of 2D-BP nanosheets at 37 °C and 130 rpm min−1 for 24 h. After each 24 h cultivation period, 0.5 mL of LB broth containing surviving bacteria was taken from the previous selection group. The living bacteria were sub-cultured on LB agar plates at 37 °C for 24 h. The selected bacteria were used for inoculum preparation at a density of 107 CFU mL−1 in the next culture step. The selective procedures, from the 24 h exposure cultivation to the inoculum preparation for the next culture step, was considered to be one subculture step for the development of bacterial resistance. After each subculture cycle, the MICs of 2D-BP nanosheets towards living bacteria were determined using 96-well plates method.19 The bacterial exposure without 2D-BP nanosheets in these subculture cycles were also conducted in parallel as control. All treatments and control were performed in triplicate. Until the BP-resistant E. coli K-12 strains was obtained, the exposure was finalized as the final subculture cycle. Growth inhibitions of the sensitive bacteria and BP-resistant bacteria were compared by culturing bacteria on LB agar plate containing gradient concentrations of 2D-BP at 37 °C overnight. Meanwhile, the optical density (OD) values of the two bacteria were measured using a UV-vis spectrophotometer (Shimadzu, UV-2700) after 6, 12 and 24 h of culture. The survival status of bacteria exposed to 2D-BP was reflected by the change of OD.
2.3 Bacterial morphological characterization
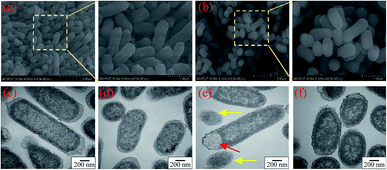
After exposure to 2D-BP nanosheets at the developed resistant concentration for 24 h, the suspensions of sensitive bacteria and BP-resistant bacteria were centrifuged at 1000 rpm for 10 min to remove most of the 2D BP nanosheets, respectively; the obtained bacterial cells were rinsed three times with the PBS solution. Then, all of bacteria were immobilized, dehydrated, dried, and sputter-coated with gold (20 s, 30 mA). Finally, the morphologies of bacterial cells were observed by scanning electron microscope (SEM; SU8020; Hitachi, Japan).The ultra-structures of sensitive bacteria and BP-resistant bacteria were visualized using TEM (H-7650; Hitachi, Japan). After exposure to 2D BP nanosheets, the sensitive and BP-resistant bacterial strains were collected by centrifugation, followed by double fixation, dehydration, infiltration, embedding, and ultrathin sectioning for TEM analysis.23 The detailed observation steps for the morphology and ultrastructure of bacterial cells are shown in the ESI-1.†
2.4 Lactate dehydrogenase (LDH) assay
Damage of cell membrane structure caused by apoptosis or cell necrosis leaded to the release of enzymes including LDH from the cytoplasm into the culture medium.15 LDH still has relatively stable enzyme activity in vitro. Thus, the cell membrane integrity was evaluated by detecting the activity of LDH released from cells with ruptured plasma membrane into culture medium. After sensitive bacteria and BP-resistant bacteria treated with 250 mg L−1 of 2D-BP nanosheets for 24 h at 37 °C, respectively, the activity of LDH was detected by a LDH cytotoxicity detection kit (Biyuntian Bio-tech Inc., China). Briefly, the bacterial cells were centrifuged at 10![[thin space (1/6-em)]](https://www.rsc.org/images/entities/char_2009.gif) 000 rpm for 10 min and 120 μL supernatant was mixed with the reagents following the kit instruction. The release amount of LDH was quantified by dual wavelength absorbance measurements at 490 nm and 600 nm. The LDH assay was detailed in the ESI-2.†
000 rpm for 10 min and 120 μL supernatant was mixed with the reagents following the kit instruction. The release amount of LDH was quantified by dual wavelength absorbance measurements at 490 nm and 600 nm. The LDH assay was detailed in the ESI-2.†
2.5 Whole-genome sequencing analysis
The genomic DNA of BP-resistant bacteria was extracted by the rapid bacterial genomic DNA isolation kit (Sangon, Shanghai, China) according to the manufacturer's instructions. The concentration and quality of DNA samples were tested by microvolume spectrophotometer (Thermo Fisher Nano Drop One, USA) and 1% agarose gel electrophoresis. Illumina sequencing library was constructed using DNA of qualified samples (≥50 ng μL−1, OD260/OD280 ≈ 1.8–2.0). The reference genome of E. coli K-12 MG1655 strain was obtained from National Center for Biotechnology Information (NCBI). The whole genome of BP-resistant bacteria after 2D-BP exposure was sequenced and analyzed based on Guangzhou Mega Biotechnology Co., Ltd. Firstly, the DNA samples were randomly interrupted to generate DNA fragments of the required collection length, and the sticky ends formed by the interruptions were repaired into flat ends. Then, base “A” was added at the 3′ end to make the DNA fragments connect with the special joint with “T” base at the 3′ end. Finally, PCR (Gene Amp 9700, ABI, USA) was used to amplify the DNA fragments with connectors at both ends, thus completing the construction of the entire library. The qualified library was constructed for cluster preparation and computer sequencing. Through the Burrows–Wheeler Alignment (BWA) software Sam Tools, the sequencing data and the reference genome were compared and analysed to obtain the sequencing coverage and genome variation.2.6 RNA extraction, genome-wide RNA sequencing and transcriptomic analysis
The total RNA of sensitive and BP-resistant bacteria was extracted using total RNA extractor (Sangon, Shanghai, China) and RNA purity was checked using a microvolume spectrophotometer. The bacterial rRNA was removed to analyse its transcriptome information, and the mRNA was randomly fragmented into small fragments of about 200 bp by fragmentation buffer. Under the effect of reverse transcriptase, the first-strand cDNA was synthesized by reverse transcription using random primers and mRNA as template. A second chain cDNA synthesis was performed using dUTP instead of dTTP dNTPs to make the second chain base contain A/U/C/G. Add end repair mix to fill the sticky end of the double-stranded cDNA structure into a flat end, digest the second chain of cDNA with UNG enzyme so that only the first chain cDNA was included in the library for PCR amplification. Transcriptional analysis of the samples was performed based on Illumina MiSeq platform (Illumina, San Diego, USA) from Majorbio Bio-Pharm Technology Co. Ltd. (Shanghai, China).Methods of RNA-Seq by Expectation-Maximization (RSEM) and Transcripts Per Million reads (TPM) were used to measure the RNA expression. The critical standards of differentially expressed genes (DEGs) between the sensitive bacteria E. coli K12 and BP-resistant bacteria were |fold change| > 1 and P value < 0.05. The metabolic pathways of DEGs were analysed by Kyoto Encyclopedia of Genes and Genomes (KEGG) database.
3 Results and discussion
3.1 BP characterization
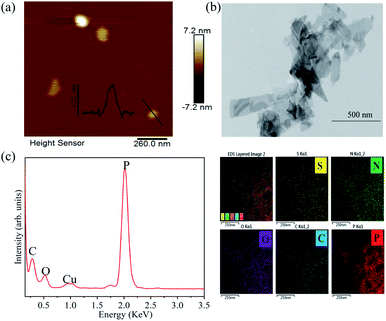
The exfoliated BP thickness was analysed using randomly selected nanosheets and the thickness was about 3.7 nm (Fig. 1a), which indicated that nanosheet structure was obtained. The TEM image shows that BP nanosheets appears 2D structure (Fig. 1b). The EDS elemental mapping shows that the prepared 2D BP nanosheets have a high content of P (Fig. 1c), confirming the high purity of 2D BP.3.2 Resistant phenotypic change of bacteria exposed to 2D-BP nanosheets
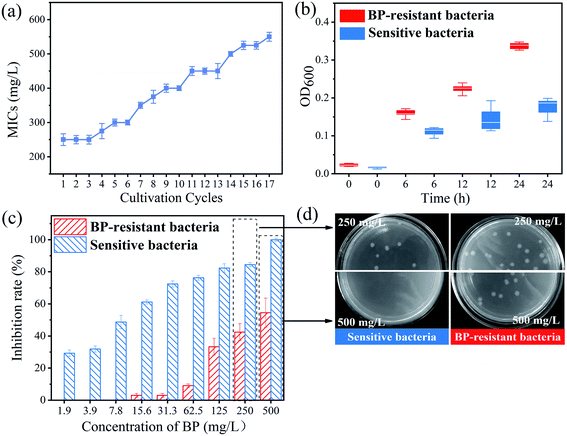
The MICs test was used to identify the phenotypic evidence of bacterial resistance to 2D-BP nanosheets. At the 14th subculture cycle, the MICs of 2D-BP against the selected bacteria was enhanced to 500 mg L−1 (Fig. 1a). In order to obtain stable 2D-BP resistance, the bacteria were sequentially exposed to 250 mg L−1 of BP nanosheets over three cultivation cycles, and a higher MICs than 500 mg L−1 (Fig. 1a) was obtained. Finally, the bacteria repeatedly exposed to 2D-BP nanosheets obtained stable 2D-BP resistance, which was defined as BP resistant bacteria. In order to confirm the resistance obtained by the BP-resistant bacteria, the survival comparisons of the sensitive and BP-resistant bacteria were conducted under exposure to 2D-BP nanosheets with the different concentrations. The OD values of the two bacteria exposed to 2D-BP nanosheets within 24 h were measured to record their growth. The OD values of the BP-resistant bacteria were significantly higher than those of the sensitive bacteria (Fig. 2b). In addition, the inhibition rates of BP-resistant bacteria obtained by plating on LB agar with BP nanosheets greatly reduced compared with the sensitive bacteria (Fig. 2c); meanwhile, the enumerations of the sensitive E. coli stains exposed to 250 mg L−1 and 500 mg L−1 BP were both lower than those of BP-resistant strains, which further also confirmed that the bacteria obtained resistance to BP exposure (Fig. 2d). These results indicated that the sensitive bacteria repeatedly exposed to BP nanosheets can develop certain resistance.3.3 Mechanisms of bacterial resistance to 2D-BP nanosheets
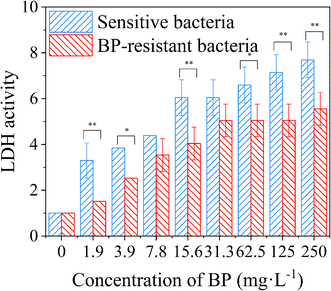
In order to further confirm the changes of cell membrane permeability, the LDH assay was conducted to quantify the content of extracellular LDH.15 Compared with the control group without 2D-BP nanosheets, the LDH activities of the sensitive and resistant bacteria showed significant upward trends with the increase of 2D-BP nanosheet dispersion concentrations (Fig. 4), which indicated that the permeability of bacterial cell membrane increased with the increase of 2D-BP nanosheet dispersion concentration (Student's T-test, *P < 0.05, **P < 0.01). Moreover, the LDH activities of the BP-resistant bacteria were almost lower than those of the sensitive bacteria at the same exposure concentration, further confirmed that the decreased permeability of cell membrane retarded apoptosis or cell necrosis and the resistance of the bacteria repeatedly exposed to BP was developed.
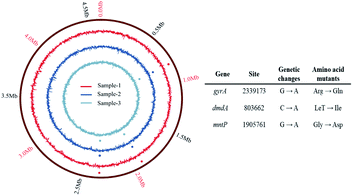
![[thin space (1/6-em)]](https://www.rsc.org/images/entities/char_2009.gif) 339
339![[thin space (1/6-em)]](https://www.rsc.org/images/entities/char_2009.gif) 173 causing an Arg → Gln missense mutation) in gyrA gene, (C → A in base 803
173 causing an Arg → Gln missense mutation) in gyrA gene, (C → A in base 803![[thin space (1/6-em)]](https://www.rsc.org/images/entities/char_2009.gif) 662 causing a Let → Ile missense mutation) in dmdA gene, and (G → A in base 1
662 causing a Let → Ile missense mutation) in dmdA gene, and (G → A in base 1![[thin space (1/6-em)]](https://www.rsc.org/images/entities/char_2009.gif) 905
905![[thin space (1/6-em)]](https://www.rsc.org/images/entities/char_2009.gif) 761 causing an Gly → Asp missense mutation) in mntP gene were identified in all the sequenced 2D-BP resistant bacteria.
761 causing an Gly → Asp missense mutation) in mntP gene were identified in all the sequenced 2D-BP resistant bacteria.
Previous finding proved that amino acid alternation in the gyrA subunits of P. aeruginosa PAO1 contributed to its resistance to quinolone antibiotics.30 Ciprofloxacin inhibited gyrA function by sitting in the active site of the enzyme, which indicated that this SNP was likely to be functional.31 The gyrA gene in DNA spin and topoisomerase played an important role in DNA replication, transcription, repair, and recombination.32 The mutation in gyrA identified in this study were most likely to be responsible for resistance to 2D-BP.
The dmdA is a catabolism-related gene of bacteria. Through dmdA enzyme mediated demethylation pathway, dimethylsulfoniopropionate (DMSP) can be degraded to methanethiol, coenzyme A, carbon dioxide, and acetaldehyde.33 Bacteria with the DMSP dmdA enzyme demethylate DMSP, which was considered to be quantitatively more important than lysis.7 Nearly all known DMSP-catabolizing bacteria belong to the phylum Proteobacteria with dmdA, and dmdA gene could be transferred horizontally in marine Gammaproteobacteria.34 However, few studies have reported that bacteria have mutations in dmdA genes. Thus, the effect of dmdA gene mutation on E. coli needs to be further explored in the future.
Another missense mutation in the resistant bacteria was mntP gene. The mntp gene is a part of MntR regulator in E. coli K-12 and encodes a manganese ion efflux pump protein Mntp.35 When the mntP gene of E. coli was deleted, the intracellular manganese ion increased by about two times.36 Manganese is an essential micronutrient of organic matter, which plays an important role in assisting enzymes such as manganese superoxide dismutase (MnSOD) to effectively avoid the damage of oxygen free radicals to cell.37,38 The mntP gene provides robust manganese resistance and affects resistance to reactive oxygen species (ROS).35 Thus, bacteria lacking manganese transport are more sensitive to ROS.39 The increase of intracellular manganese ion concentration could increase the resistance of cells to ionizing radiation.40 It has been reported that the change of Mntp protein in E. coli mutant strains may be related to the resistance of cells to oxidative stress and the improvement of dense phase carbon dioxide resistance.41 Thus, the mntP gene mutations might contribute to the development of the 2D-BP resistance in E. coli K-12.
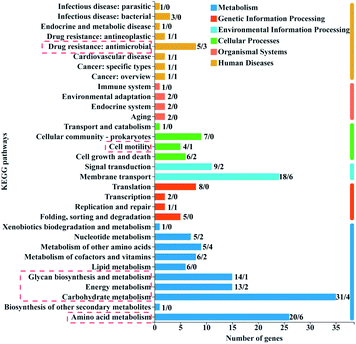 | ||
| Fig. 6 KEGG function annotation classification of DEGs. The number on top of each column represents the number of up-regulated genes/down-regulated genes. | ||
The number of up-regulated genes was significantly more than the number of down-regulated genes in the resistant bacteria (Fig. 6). The up-regulated gene clusters mainly annotated in the KEGG pathways related to metabolism, cell movement, and drug resistance (Fig. 6). The metabolism processes mainly included amino acid, carbohydrate, energy, and glycan biosynthesis metabolisms (Fig. 6), which are closely related to the maintenance of cell life activities.42 Carbohydrate metabolism played an important role in cell energy supply. Glycan biosynthesis metabolisms were the principal way of sugar metabolism to maintain energy and balance intracellular sugar and cell membrane integrity.43 These up-regulated metabolic genes might be an important compensation mechanism for the survival of resistant bacteria under 2D-BP exposure. Transcriptome analysis of E. coli exposed to silver nanoparticles also showed that the most upregulated KEGG pathways mainly belonged to metabolic and energy production process.44 Another study proved that the enhancement of genes expression related to intracellular metabolic bacteria coped with Cd stress.45
These major up-regulated genes related to metabolism, transcription, translation, and cellular processes are shown in Table S3.† Among these genes, rpoA and rpoC related to transcription were both up-regulated. It has been reported that bacterial drug resistance to rifampicin (RFP) was mainly attributed to the mutation of rpoC gene of RNA polymerase subunit. RFP inhibited transcription initiation and RNA extension by binding to RNA polymerase β subunit and played an antibacterial role.46 Two genes isrC and flu involved in biofilm formation in E. coli K-12 were also significantly upregulated, which further confirmed the important role in the outer and inner membrane barrier of bacteria to resist 2D-BP stress. This phenomenon was also observed in E. coli under long-term exposure to non-antibiotic pesticides and the enhanced expression of flu gene increased antibiotic resistance.47 In addition, four genes including mglB, aer, flgD, and flis associated with cell motility were significantly up-regulated. Similarly, the upregulation of genes related to chemotaxis and flagellar motility was observed in E. coli after daily exposure to nanostructured titanium dioxide.9 These changes may help bacteria escape or adapt to external stimuli.
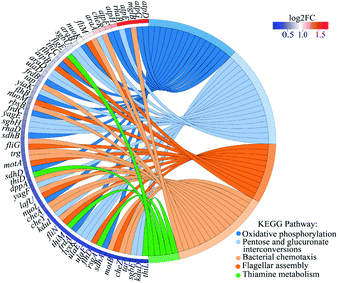
The up-regulated genes in the BP-resistant bacteria were enriched to different pathways by KEGG and the top five KEGG pathways were oxidative phosphorylation, pentose and glucuronate interconversions, bacterial chemotaxis, flagellar assembly, and thiamine metabolism (Fig. 7). The transcription levels of these genes atpD, atpG, and atpE were the highest in oxidative phosphorylation with the up-regulated fold of 3.59, 3.34, and 3.21, respectively (Fig. 7 and Table S4†). The three genes involved the coupling reaction between ADP and inorganic phosphorus to synthesize ATP. The increase of ATP synthase subunits under harsh conditions made more protons export from the cell to protect bacteria from external stimuli.48 Obviously, the increasing expression of these ATP synthesis related genes made E. coli K-12 exposed to 2D-BP develop a resistance. In addition, under external stimuli including manganese stress, dehydration stress, and high salinity, the expressions of atpD and atpG genes in bacteria were also positively regulated.43–45,49–51 The up-regulated mglB and rbsB genes related to the ABC operator were enriched to the bacterial chemotaxis pathway (Fig. 7 and Table S4†). ABC transporter was a way to get energy by transferring nutrients out or into cells or organelles.52 ABC transporters in certain pathogen such as S. aureus and Pseudomonas spp. can participate in antibiotic resistance.52 Chemotactic protein methyltransferase (cheR) gene was also enriched in the bacterial chemotaxis pathway, which referred to the mobile response of bacteria to external stimuli (Fig. 7 and Table S4†). The high hydrostatic pressure induced chemotaxis-related gene expression increasing.53 Furthermore, some flagella-related genes including fliM, figE, flhC, and flhB were also significantly enriched. These genes increased flagellin expression, resulting in the bacterial motility increasing. The up regulation of these genes mediated the mobility of E. coli K-12, making the bacteria elude 2D-BP stimuli and further develop resistance to the 2D-BP exposure.
The KEGG annotations of DEGs and the KEGG enrichment pathway showed that the genes which mainly involved in energy metabolism, cell motility, and membrane structure were up-regulated. The mutation genes dmdA and mntP of BP-resistant bacteria have been found to control catabolism and membrane structure. The gyrA gene related to DNA replication, transcription, repair, and recombination also played an important role on the development of an SOS response to DNA damage caused by 2D-BP exposure. The modifications of genetic function in membrane structure for the BP-resistant bacteria explained the changes in morphology and physiology referring to the reinforced barrier function of cell membrane. Obviously, the production of resistance to BP was mainly attributed to the changes in energy metabolism and membrane structure of bacteria caused by gene mutations. In addition, the changes of these genes associated with cell motility also induced the bacterial resistance to 2D-BP.
4 Conclusions
This study reported the resistant phenotypic, morphological, and genetic changes of wild type bacteria repeatedly exposed to 2D-BP nanosheets at sub-MIC levels. The results demonstrated that the bacteria exposed to BP nanosheets can develop a certain resistance, which was mainly attributed to the reinforced barrier function for the outer and inner cell membrane hindering 2D-BP from entering the cell. The development of bacterial resistance was associated with three inherited mutation genes (dmdA, mntP, and gyrA). The three genes were responsible for catabolism, membrane structure, and DNA replication. The up-regulated expressions of corresponding functional genes further indicated that the resistance of bacteria repeatedly exposed to 2D-BP nanosheets was mainly caused by gene mutations. In addition, the expression of genes related to cell mobility such as flagellar composition increased, which made bacteria to adapt to harsh environments. These findings suggest that safety modifications and improvement for BP nanomaterials are indispensable for the safety and environmentally friendly application, and further remind all-round consideration of biological safety and human health for some nano-antibacterial materials in usage.Author contributions
Huixiang Wang: methodology, formal analysis, data curation, visualization, writing original draft. Fang Fang: investigation, data curation, visualization. Chengxun Deng: methodology, validation. Chengzhu Zhu: supervision, formal analysis. Zhimin Yu: validation, writing – review & editing. Xiaowei Liu: supervision, methodology, writing – review & editing, funding acquisition.Conflicts of interest
There are no conflicts to declare.Acknowledgements
This research was financially supported by the Scientific Research Fund for Talents of Hefei University in 2021 [21-22RC30], National Natural Science Foundation of China [grant numbers 52070063] and the Natural Science Research Project of Higher Education in Anhui Province [grant numbers KJ2021A1005].Notes and references
- X. F. Zou, L. Zhang, Z. J. Wang and Y. Luo, J. Am. Chem. Soc., 2016, 138, 2064–2077 CrossRef CAS PubMed.
- J. L. Ma, K. X. Li and S. B. Gu, RSC Adv., 2022, 12, 4852–4864 RSC.
- Z. L. Shaw, S. Kuriakose, S. Cheeseman, M. D. Dickey, J. Genzer, A. J. Christofferson, R. J. Crawford, C. F. McConville, J. Chapman, V. K. Truong, A. Elbourne and S. Walia, Nat. Commun., 2021, 12(1), 1–19 CrossRef PubMed.
- M. T. Guo and X. B. Tian, J. Hazard. Mater., 2019, 380, 120877 CrossRef CAS PubMed.
- W. C. Yu, S. H. Zhan, Z. Q. Zhou and D. Yang, Chem. Eng. J., 2017, 313, 836–846 CrossRef CAS.
- A. Panacek, L. Kvitek, M. Smekalova, R. Vecerova, M. Kolar, M. Roderova, F. Dycka, M. Sebela, R. Prucek, O. Tomanec and R. Zboril, Nat. Nanotechnol., 2018, 13, 65–71 CrossRef CAS PubMed.
- Y. F. Zheng, J. Y. Wang, S. Zhou, Y. H. Zhang, J. Liu, C. X. Xue, B. T. William, X. X. Zhao, Z. Li, X. Y. Zhu, C. Sun, H. H. Zhang, T. Xiao, G. P. Yang, J. D. Todd and X. H. Zhang, Nat. Commun., 2020, 11, 4658 CrossRef CAS PubMed.
- Q. R. Zhang and C. D. Zhang, Environ. Sci. Technol., 2020, 54, 12412–12422 CrossRef CAS PubMed.
- Q. R. Zhang, T. Xia and C. D. Zhang, Environ. Sci. Technol., 2020, 54, 13186–13196 CrossRef CAS PubMed.
- W. S. Chen, J. Ouyang, X. Y. Yi, Y. Xu, C. C. Niu, W. Y. Zhang, L. Q. Wang, J. P. Sheng, L. Deng, Y. N. Liu and S. J. Guo, Adv. Mater., 2018, 30, 1703458 CrossRef PubMed.
- X. P. Han, J. P. Han, C. Liu and J. Sun, Adv. Funct. Mater., 2018, 28(45), 1803471 CrossRef.
- B. S. Li, C. Lai, G. M. Zeng, D. L. Huang, L. Qin, M. M. Zhang, M. Cheng, X. G. Liu, Y. Huan, C. Y. Zhou, F. L. Huang, S. Y. Liu and Y. K. Fu, Small, 2019, 15, 1804565 CrossRef PubMed.
- H. W. Liu, K. Hu, D. F. Yan, R. Chen, Y. Q. Zou, H. B. Liu and S. Y. Wang, Adv. Mater., 2018, 30, 1800295 CrossRef PubMed.
- Z. B. Li, L. Wu, H. Y. Wang, W. H. Zhou, H. X. Liu, H. D. Cui, P. H. Li, P. K. Chu and X. F. Yu, ACS Appl. Nano Mater., 2019, 2, 1202–1209 CrossRef CAS.
- Z. Q. Xiong, X. J. Zhang, S. Y. Zhang, L. Lei, W. Ma, D. Y. Li, W. D. Wang, Q. Zhao and B. S. Xing, Ecotoxicol. Environ. Saf., 2018, 161, 507–514 CrossRef CAS PubMed.
- Z. Y. Sun, Y. Q. Zhang, H. Yu, C. Yan, Y. C. Liu, S. Hong, H. C. Tao, A. W. Robertson, Z. Wang and A. A. H. Pádua, Nanoscale, 2018, 10, 1–29 RSC.
- J. Ouyang, R. Y. Liu, W. S. Chen, Z. J. Liu, Q. F. Xu, K. Zeng, L. Deng, L. F. Shen and Y. N. Liu, J. Mater. Chem. B, 2018, 6, 6302–6310 RSC.
- H. Wang, S. L. Jiang, W. Shao, X. D. Zhang, S. C. Chen, X. S. Sun, Q. Zhang, Y. Luo and Y. Xie, J. Am. Chem. Soc., 2018, 140, 3474–3480 CrossRef CAS PubMed.
- Clinical and Laboratory Standards Institute (CLSI), Performance Standards for Antimicrobial Susceptibility Testing; Institute Antimicrobial Susceptibility Testing Standards M02-A11 and M07-A9, Clinical and Laboratory Standards Institute, Wayne, PA, 2012 Search PubMed.
- E. Gullberg, S. Cao, O. G. Berg, C. Ilback, L. Sandegren, D. Hughes and D. I. Andersson, PLoS Pathog., 2011, 7, 1002158 CrossRef PubMed.
- D. Li, S. Y. Zeng, M. He and A. Z. Gu, Environ. Sci. Technol., 2016, 50, 3193–3201 CrossRef CAS PubMed.
- Y. Zhang, A. Z. Gu, S. S. Xie, X. Y. Li, T. Y. Cen, D. Li and J. M. Chen, Environ. Int., 2018, 121, 1162–1171 CrossRef CAS PubMed.
- H. Zhou, X. J. Wang, Y. Zhou, H. Z. Yao and F. Ahmad, Anal. Bioanal. Chem., 2014, 406, 3689–3695 CrossRef CAS PubMed.
- X. Z. Li, Y. S. Wang and Z. M. Yang, Chin. J. Antibiot., 1989, 14, 307–310 Search PubMed.
- B. Jia and Y. S. Qian, Chin. J. Antibiot., 2001, 26, 194–197 Search PubMed.
- H. Y. Zhang, Y. Xia, P. F. Wang, W. P. Lv and Y. L. Chen, World Latest Medicine Information, 2017, 34, 66–68 Search PubMed.
- C. D. Zhang, Y. T. Wang, J. J. Ma, Q. R. Zhang, F. Wang, X. H. Liu and T. Xia, Sci. Total Environ., 2020, 721, 137740 CrossRef CAS PubMed.
- Z. L. Shaw, S. Kuriakose, S. Cheeseman, E. L. H. Mayes, A. Murali, Z. Y. Oo, T. Ahmed, N. Tran, K. Boyce, J. Chapman, C. F. McConville, R. J. Crawford, P. D. Taylor, A. J. Christofferson, V. K. Truong, M. J. S. Spencer, A. Elbourne and S. Walia, ACS Appl. Mater. Interfaces, 2021, 13, 17340–17352 CrossRef CAS PubMed.
- Z. L. Shaw, S. Cheeseman, L. Z. Y. Huang, R. Penman, T. Ahmed, S. J. Bryant, G. Bryant, A. J. Christofferson, R. Orrell-Trigg, C. Dekiwadia, V. K. Truong, J. P. Vongsvivut, S. Walia and A. Elbourne, J. Mater. Chem. B, 2021 10.1039/d1tb02575a.
- L. Lv, T. Jiang, S. H. Zhang and X. Yu, Environ. Sci. Technol., 2014, 48, 8188–8195 CrossRef CAS PubMed.
- Q. C. Zhang, G. Lambert, D. Liao, H. Kim, K. Robin, C. K. Tung, N. Pourmand and R. H. Austin, Science, 2011, 333, 1764–1767 CrossRef CAS PubMed.
- M. Durcik, Z. Skok, J. Ilas, N. Zidar, A. Zega, P. E. Szili, G. Draskovits, T. Revesz, D. Kikelj, A. Nyerges, C. Pal and L. P. Masic, Pharm, 2020, 13, 6 Search PubMed.
- C. R. Reisch, M. J. Stoudemayer, V. A. Varaljay, I. J Amster, M. A. Moran and W. B. Whitman, Nature, 2011, 473, 208–211 CrossRef CAS PubMed.
- L. Hernandez, A. Vicens, L. E. Eguiarte, V. D. Anda and J. M. Gonzalez, PeerJ, 2020, 8, 8 CrossRef PubMed.
- R. Zeinert, E. Martinez, J. Schmits, K. Senn, B. Usman, V. Anantharaman, L. Aravind and L. S. Water, J. Biol. Chem., 2018, 293, 5715–5730 CrossRef CAS PubMed.
- L. S. Waters, M. Sandoval and G. Storz, J. Bacteriol., 2011, 193, 5887–5897 CrossRef PubMed.
- C. R. Fisher, E. E. Wyckoff, E. D. Peng and S. M. Payne, J. Bacteriol., 2016, 198, 2810–2817 CrossRef CAS PubMed.
- A. F. Miller, K. Padmakumar and D. L. Sorkin, J. Inorg. Biochem., 2003, 93, 71–83 CrossRef CAS PubMed.
- G. Kaur, S. Sengupta, V. Kumar, A. kumari, A. Ghosh, P. Parrack and D. Dutta, J. Bacteriol., 2014, 96, 2587–2597 CrossRef PubMed.
- J. K. Fredrickson, S. M. W. Li, E. K. Gaidamakova, V. Y. Matrosova, M. Zhai, H. M. Sulloway, J. C. Scholten, M. G. Brown, D. L. Balkwill and M. J. Daly, ISME J., 2008, 2, 393–403 CrossRef CAS PubMed.
- Y. Yang, X. Li, H. W. Rao, F. He, L. Chen and D. Q. Zhang, J. Chin. Inst. Food Sci. Technol., 2016, 16, 195–202 Search PubMed.
- A. C. Singer, T. Bell, C. A. Heywood, J. A. C. Smith and I. P. Thompson, Environ. Pollut., 2007, 147, 74–82 CrossRef CAS PubMed.
- Y. Xiong, Q. Y. Lei, S. Zhao and K. L. Guan, Quant. Biol., 2011, 76, 285–289 CrossRef CAS PubMed.
- Z. B. Li, L. Wu, H. Y. Wang, W. H. Zhou, H. X. Liu, H. D. Cui, P. H. Li, P. K Chu and X. F. Yu, ACS Appl. Nano Mater., 2019, 2, 1202–1209 CrossRef CAS.
- U. Kozhamkulov, A. Akhmetova, S. Rakhimova, E. Belova, A. Alenova, V. Bismilda, L. Chingissova, S. Ismailov, E. Ramanculov and K. Momynaliev, Jpn. J. Infect. Dis., 2011, 64, 253–255 CrossRef CAS PubMed.
- H. M. Wang, P. X. Wu, J. Liu, S. S. Yang, B. Ruan, S. Rehman, L. T. Liu and N. W. Zhu, Chemosphere, 2019, 240, 124851 CrossRef PubMed.
- Y. Xing, S. Q. Wu and Y. J. Men, Environ. Sci. Technol., 2020, 54, 8770–8778 CrossRef CAS PubMed.
- M. J. Chen, H. Y. Tang and M. L. Chiang, Food Microbiol., 2017, 66, 20–27 CrossRef CAS PubMed.
- R. K. Duary, V. K. Batish and S. Grover, Res. Microbiol., 2010, 161, 399–405 CrossRef CAS PubMed.
- Y. Sunda, T. Yoshikawa, Y. Okuda, M. Tsunemoto, S. Tanak, K. Ileda, H. Miyasaka, M. Watanabe, K. Sasaki, K. Harada, T. Bamba and K. Hirata, J. Biosci. Bioeng., 2009, 7, 352–354 Search PubMed.
- H. Long, X. Niu, S. H. Huang, X. Q. Ran and J. F. Wang, Ind. Microbiol., 2002, 50, 27–33 Search PubMed.
- D. C. Rees, E. Johnson and O. Lewinson, Nat. Rev. Mol. Cell Biol., 2009, 10, 218–227 CrossRef CAS PubMed.
- J. P. Bowman, C. R. Bittencourt and T. Ross, Microbiol, 2008, 154, 462–475 CrossRef CAS PubMed.
Footnote |
| † Electronic supplementary information (ESI) available. See https://doi.org/10.1039/d2ra01263d |
| This journal is © The Royal Society of Chemistry 2022 |

