 Open Access Article
Electrochemical paraquat sensor based on lead oxide nanoparticles†
Pranlekha Traiwatcharanona,
Wilai Siriwatcharapiboonb,
Oratai Jongprateepc and
Chatchawal Wongchoosuk *a
*a
aDepartment of Physics, Faculty of Science, Kasetsart University, Bangkok 10900, Thailand. E-mail: chatchawal.w@ku.ac.th; Fax: +662-942-8029; Tel: +662-562-5555
bDepartment of Chemistry and Center of Excellence for Innovation in Chemistry, Faculty of Science, Kasetsart University, Bangkok, 10900, Thailand
cDepartment of Materials Engineering, Faculty of Engineering, Kasetsart University, Bangkok 10900, Thailand
First published on 30th May 2022
Abstract
1,1-Dimethyl-4,4-bipyridinium dichloride known as paraquat is a popular well-known herbicide that is widely used in agriculture around the world. However, paraquat is a highly toxic chemical causing damage to vital organs including the respiratory system, liver, heart, and kidneys and death. Therefore, detection of paraquat is still necessary to protect life and the environment. In this work, an electrochemical sensor based on lead oxide nanoparticles (PbO-NPs) modified on a screen-printed silver working electrode (SPE) has been fabricated for paraquat detection at room temperature. The PbO-NPs have been synthesized by using a sparking method via two Pb metal wires. The electrochemical paraquat sensors have been prepared by a simple drop-casting of PbO-NPs solution on the surface of the SPE. The PbO-NPs/SPE sensor exhibits a linear response in the range from 1 mM to 5 mM with good reproducibility and high sensitivity (204.85 μA mM−1 cm−2) for paraquat detection at room temperature. The PbO-NPs/SPE sensor shows high selectivity to paraquat over other popular herbicides such as glyphosate, glufosinate-ammonium and butachlor-propanil. The application of the PbO-NPs/SPE sensor is also demonstrated via the monitoring of paraquat contamination in juice and milk.
1. Introduction
Paraquat (1,1-dimethyl-4,4-bipyridinium dichloride) is one of the well-known herbicides that have been widely used in the world for more than 50 years.1 Over 130 countries worldwide have applied paraquat in agriculture to inhibit grass and weed growth due to its quick-acting, non-selective contact with green plant tissue and it being easily dissolved in water at room temperature.2 However, paraquat is highly toxic and has long-term affected the environment such as through spreading and being residual in the air, soil, water, plants and animals. The mechanism of toxicity of paraquat occurs via the single electron redox cycling in biological systems. The redox cycling of paraquat can generate activated oxygen such as superoxide anion, superoxide radical and hydrogen peroxide which are relevant to the development of toxicity.3,4 Although, many countries have banned paraquat, it slowly degrades in the environment with a half-life of more than 10 years.5,6 Moreover, paraquat causes serious damage to human health and is related to Parkinson's disease.7,8Conventional methods for paraquat detection are based on spectroscopic techniques such as gas chromatography-mass spectrometry (GC-MS)9 high performance liquid chromatography (HPLC)10 surface-enhanced Raman scattering (SERS) spectroscopy11 surface-assisted laser desorption/ionization time-of-flight mass spectrometry (SALDI-TOF MS)12 and so on. Although, these methods offer very high accuracy to identify quantity of paraquat in samples, they are very expensive, complicated procedures, long time-consuming and unavailable under on-site field analysis. Alternative methods based on bio/electrochemical sensors have received much attention in recent years.13–15 For examples, Sant'Anna et al.16 fabricated an electrochemical sensor based on nanocomposite of activated biochar and reduced graphene oxide to detect paraquat in food samples such as coconut water, wastewater, honey, lettuce and lemon. Kavazoi et al.17 synthesized tetrasulfonated phthalocyanine for paraquat sensing. Ali et al.18 developed a colorimetric sensor based on imidacloprid stabilized silver nanoparticle that showed high sensitive and low limit of detection toward paraquat. Deroco et al.19 demonstrated a paper-based silver electrode prepared by the inkjet-printing method in the determination of paraquat. Souza et al.20 used beeswax incorporating carbon black nanoparticles to determine paraquat in Apis mellifera honey. Jiang et al.21 showed the excellent photoelectrochemical performance for paraquat detection based on ITO/Au/Cu2O electrode. Although, several materials have successfully used for paraquat sensing, new materials with low-cost and simple preparation methods are still need to enable the electrochemical paraquat sensor into commercialization.
Lead oxide has been served for electrode coating due to its superior reaction sites and intrinsic chemical properties.22 There are many oxide forms including PbO, Pb2O3, Pb3O4, and PbO2 which can be applied in γ-ray shielding,23 photoconductor,24 memristor application,25 radiation attenuation application,26 energy-storage application,27 and lithium ion battery.28 The lead oxide nanoparticles (PbO-NPs) have been synthesized by several methods such as sol–gel, chemical precipitation, chemical bath deposition, spray paralysis, hydrothermal, and laser ablation.29 However, most methods require high-temperatures operation, high-vacuum systems, high energy, multistep processes, long operation times leading to expensive and harmful to the environment. A new sparking method30 prepared nanoparticles with high porousity under atmospheric pressure with inexpensive, simple and rapid may be considered as an alternative and effective method for PbO-NPs synthesis.
In this work, the PbO-NPs as the sensing material for paraquat detection were synthesized by a sparking method at room temperature. In addition, we have developed the electrochemical sensor based on the PbO-NPs modified screen-printed silver electrode (SPE). The determination of paraquat was carried out using cyclic voltammetry (CV) technique under optimal conditions.
2. Experimental details
2.1 Synthesis of lead oxide nanoparticles
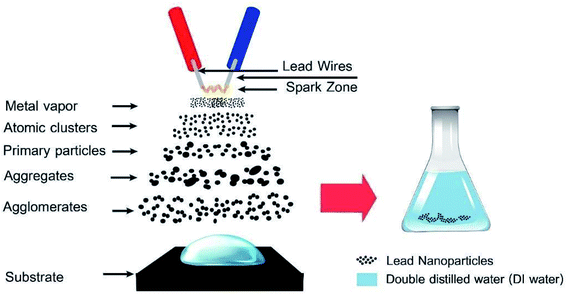
The PbO-NPs were synthesized by sparking method as shown in Fig. 1 with the four pairs of pure lead wires (purity 99.0%, diameter = 0.5 mm) used as sparking tips. The four pairs sparking tips were placed horizontally about 2 mm above the center of the glass substrate. The spacing of sparking wires were set at 1 mm. The sparking method was controlled by a constant voltage of 7.60 V and current of 3.65 A. Firstly, the glass substrate was cleaned by acetone, distilled water and dried. Next, the lead wires were sparked into 1 ml of deionized water on glass substrate for 45 min at room temperature. The PbO-NPs suspension was ultra-sonicated for 20 min and kept at a room temperature for further use.2.2 Fabrication of the PbO-NPs modified SPE sensor
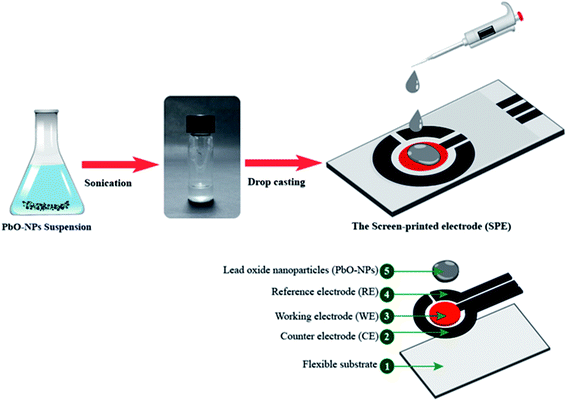
The screen-printed electrodes (SPEs) were purchased from Quasense. It consists of three main parts as follows: a silver (Ag) working electrode, a carbon (C) counter electrode and a silver/silver chloride (Ag/AgCl) reference electrode. Fig. 2 shows the procedure for preparing the PbO-NPs modified SPE sensor. The 5 μL PbO-NPs suspension was dropped cast on the surface of SPE (7.065 mm2 area) for three times. The modified SPE was then dried in air at room temperature and ready for using in paraquat detection. It should be noted that a standard carbon working electrode can be also used for coating PbO-NPs to detect paraquat. However, the silver working electrode gave a higher current over carbon working electrode at the same concentration of paraquat. Thus, silver working electrode has been selected for this study.2.3 Characterization of PbO-NPs
The morphology of PbO-NPs was characterized by a high-magnification and high-resolution transmission electron microscopy (TEM and HR-TEM, JEOL model: JEM-3100 (HR)) and field-emission scanning electron microscopy (FE-SEM: SU5000, Hitachi). The size distribution of nanoparticles was measured from TEM images using Image J. The crystal phase and crystallinity of PbO-NPs were evaluated by X-ray diffraction (XRD, model: Bruker D8 Advance) with Cu Kα radiation (Bruker, λ = 1.5406 Å, 2θ = 20–80°). The element composition and chemical state in PbO-NPs were analyzed by X-ray photoelectron spectrometry (XPS, model: Axis Ultra DLD, Kratos analytical, Manchester UK).2.4 Electrochemical measurement
The sensing performance of the PbO-NPs SPEs sensor was investigated by cyclic voltammetry (CV) with a Sensit Smart potentiostat (EmStat Pico module) from PalmSens BV and it was controlled by a PSTrace software. The cyclic voltammetric characterizations were performed in the potential range between 0 V to −1.4 V and scan rate of 100 mV s−1. The PbO-NPs SPEs sensor was equilibrated in 0.1 M Tris solution (electrolytic solution) by performing cyclic voltammetry until the current and potential signal constant. All electrochemical measurements were repeated for three times (four independent fabricated PbO-NPs SPEs sensors). The volume of paraquat and other herbicides for any tests was 100 μL.3. Results and discussion
3.1 Characterization of PbO-NPs
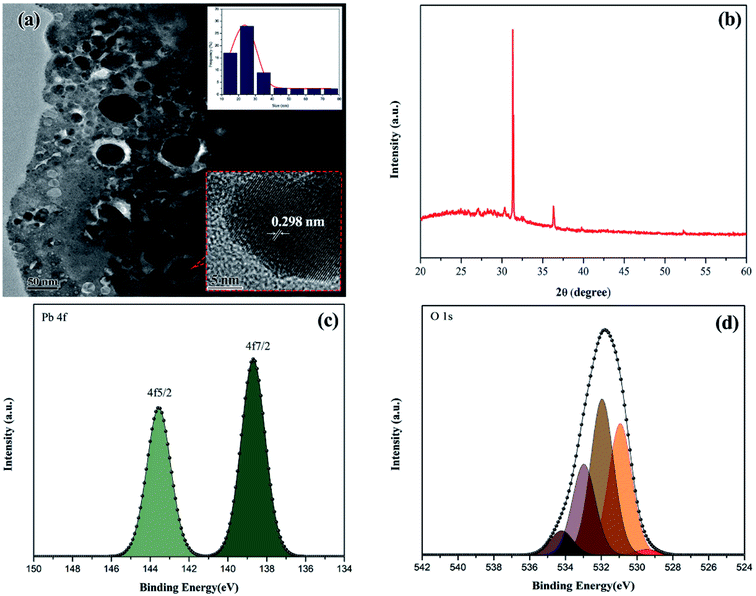
The sparking PbO-NPs sensing film exhibits the dense structure and nearly spherical shape with various sizes ranging from 10 to 80 nm as shown in Fig. 3a. The average particle size is 22.95 ± 5.46 nm. The d-spacing of the lattice fringes is ∼0.298 nm closing to the (101) diffraction plane of the PbO31 as displayed in Fig. 3b. The XRD peaks reveal three strong peaks at 2θ = 31.15°, 35.83° and 51.96° corresponding to the (101), (002) and (220) planes of PbO (JCPDS card, no. 01-085-1288), respectively, as shown in Fig. 3b. It can confirm a pure phase of synthesized orthorhombic lead oxide (β-PbO) via simple sparking method. It's well known that α-PbO transforms to β-PbO at approximately 490 °C (ref. 32) resulting to more stable β-PbO at high temperature. During sparking process, high energy was applied to Pb atoms to form PbO nanoparticles at high temperature. Thus, β-PbO is more contribution than α-PbO phase. The average crystallite sizes of the PbO crystallites can be determined using Debye–Scherrer formula as given in eqn (1). The average crystallite size is found to be 30.78 nm that is smaller than that of the PbO nanoparticle samples prepared by other methods.33,34 This small size may provide high surface area to interact with paraquat molecules.
 | (1) |
The chemical states and nature bonding of the synthesized PbO-NPs were evaluated by XPS as shown in Fig. 3c and d. The core level of Pb displays the doublet in tetravalent oxidation state of lead due to the spin orbit splitting into 4f5/2 and 4f7/2. The de-convoluted Pb 4f shows the two peaks binding energies at 143.5 eV and 138.5 eV as shown in Fig. 3c which correspond to the core levels of Pb2+ and Pb, respectively. The higher peak intensity of Pb–O bonds presented the more content of the PbO formation with an energy separation of 4.9 eV.35–39 In Fig. 3d, the de-convoluted O 1s state shows the signal peak that can be fitted from five peaks by Gaussian–Lorentzian curves. The de-convoluted peaks can be divided into five types of oxygen species with the binding energies at 529.9 eV, 530.9 eV, 531.9 eV, 532.9 eV and 534.2 eV. The peak located at 529.9 eV corresponds to oxygen atoms (O2−) in the lead oxide lattice (O–Pb bond). The lattice O2− peak located at 530.9 eV relates to the OH− group from the PbO–OH. The peak located at 531.9 eV corresponds to adsorption or chemisorption of atomic oxygen (Oads) which also related to the presence of water molecules. The peak at 532.9 eV attributes to the OH(ads) onto the surface of Pb–O.40 Based on XPS results, it can confirm purity and formation PbO-NPs. However, OH functional groups can be found at the surfaces of PbO-NPs which may help to increase the interactions for paraquat molecules adsorption.
The surface morphology of Ag working electrode after coating of PbO-NPs was characterized by using FE-SEM and EDS analysis as displayed in Fig. 4. Due to small size of PbO-NPs, the PbO-NPs are well distributed on the Ag working electrode. Some agglomeration of PbO-NPs cluster can be also found on the Ag working electrode because of room-temperature evaporation of PbO-NPs solution. Based on EDS spectrum, it can confirm high quality and quantity of PbO-NPs modified on the Ag working electrode by simply drop-casting method. No observed color change on the working electrode was found after coating of PbO-NPs as shown in Fig. S1 in ESI.† Strong attractive forces between PbO-NPs and Ag working electrode without using any binder or adhesive membrane may be contributed from chemisorption that usually found in Ag sensing material.
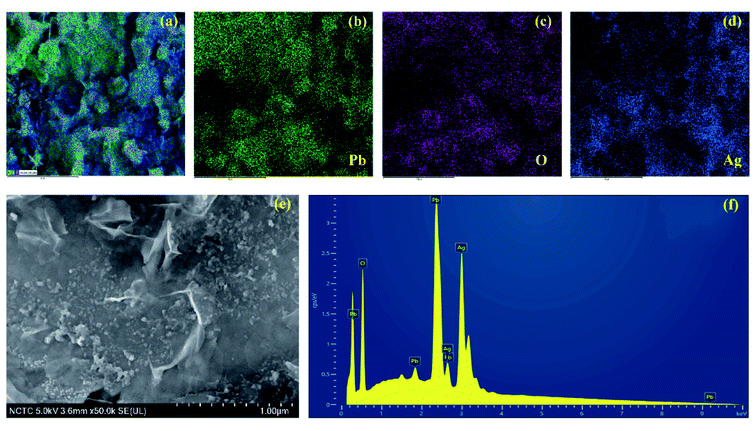 | ||
| Fig. 4 (a)–(d) EDS mapping, (e) FE-SEM image and (f) EDX spectrum of Ag working electrode after coating of PbO-NPs. | ||
3.2 Electrochemical behaviors of the PbO-NPs sensor
The electrochemical behaviors of PbO-NPs sensor for paraquat detection were investigated via cycle voltammetry. The electrochemical response of the PbO-NPs sensor in the presence of paraquat shows the strong four-peak response (two cathodic peaks and two anodic peaks) as displayed in Fig. 5a. The peak potential separation (ΔE = Epc − Epa) were 0.130 V (P1 − P4) and 0.289 V (P2 − P3), respectively, for potential scan rate of 100 mV s−1. It indicates a quasi-reversible system of redox reaction process. The two anodic reaction equations can be followed as PQ → PQ+ + e− and PQ+ → PQ2+ + e−. The cathodic peak potential at −0.85 V (P1) is the first reduction process involved one electron in the reaction resulting in the formation of the radical cation PQ*+ (PQ2+ + 1e− → PQ*+). The second cathodic peak potential at −1.25 V (P2) is the second reduction process in which PQ*+ is further reduced via one electron process to form neutral molecules (PQ0). The influences of the pH values on P1 and P2 are displayed in Fig. 5b and c, respectively. The peak P1 current shows a maximum value at pH 7 and decreases with rising pH. The positive shift in reduction peak can be observed with decreasing of pH suggesting in reaction with proton-transfer process in the reduction of PQ. At low or high pH values, they decrease in the peak current due to the reaction of disproportionation and degree of protonation41,42 that reduce amount of oxide on the PbO surface resulting to a decrease in peak current corresponding to previous works.43,44 In case of P2, the peak currents are quite stable in range of pH 7–10 due to the most contribution of first reduction process. By considering the response currents and behavior of the sensor, the pH 7.0 has been selected as the optimum pH value for the supporting electrolyte. The first reduction peak has been chosen to determine the optimal conditions and calibration curve for paraquat determination.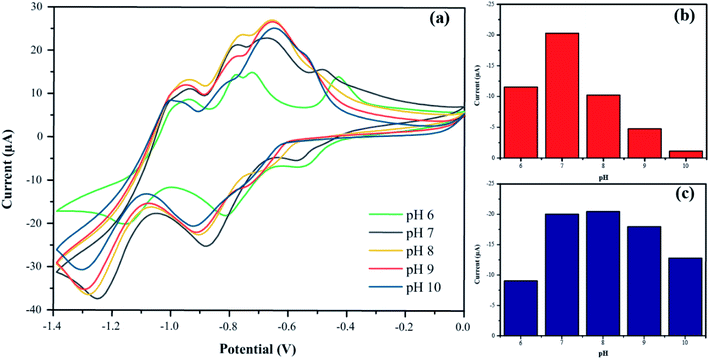 | ||
| Fig. 5 (a) Cyclic voltammetry responses of PbO-NPs sensor at the different pH values in the presence of 1 mM paraquat. Their current responses of (b) P1 at −0.8 V and (c) P2 at −1.1 V. | ||
To understand the dynamic performance of paraquat onto the PbO-NPs sensor, the influence of scan rate was studied from 100 mV s−1 to 500 mV s−1 in the Tris buffer (0.1 M, pH 7) containing paraquat (1 mM) as shown in Fig. 6a. It can be observed that peak current increases with increasing scan rates according to typical diffusion-controlled reaction. Meanwhile, the peak potentials shift to more negative potentials with increasing scan rate due to over reduction by the PbO-NPs. The peak currents are plotted as a function of square root of scan rate as shown in Fig. 6b. A good linear relationship can be obtained in the range of 100–500 mV s−1. This indicates that the process is fully controlled by the diffusion of the electroactive species on the Pb–O NPs.45 The results of the peaks current can be explained by the Randles–Sevcik's equation as given in eqn (2). The linear regression equation was  for P1 (R2 = 0.998). In addition, the value of Aeff is calculated from the slope of fitted line based on eqn (3) as 6.53 × 10⁻³ cm2 for P1.
 | (2) |
 | (3) |
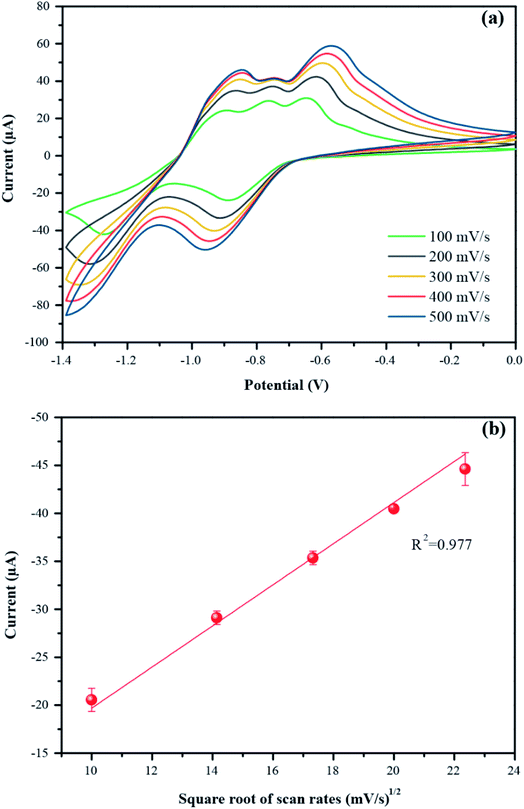 | ||
| Fig. 6 (a) Cyclic voltammetry responses of PbO-NPs sensor at the scan rates in the presence of 1 mM paraquat and (b) their cathodic peak currents versus scan rates. | ||
For the paraquat in 0.1 M Tris buffer, m is to slope, n = 1, C0 = 1 × 10⁻⁶ mol cm−3 and D = 2.7 × 10⁻⁶ cm2 s−1.
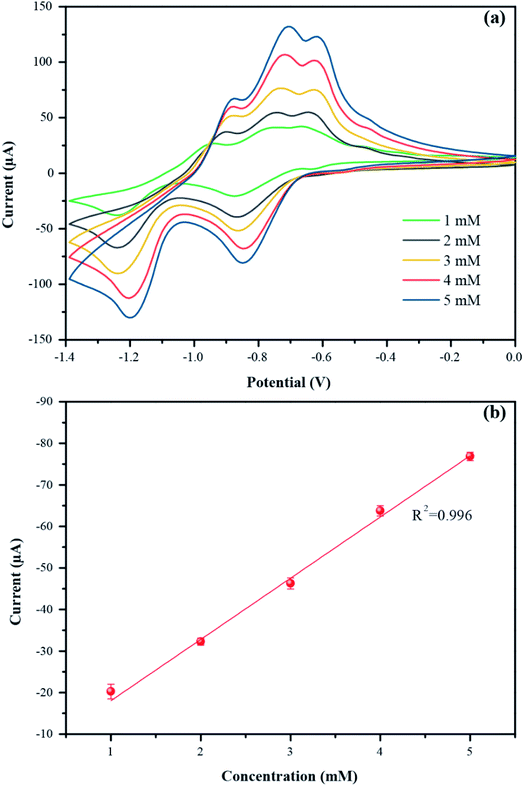
The optimum conditions (pH 7, 100 mV s−1) were selected for studying the electrochemical performance of PbO-NPs sensor in determination of paraquat at different concentrations ranging from 1 mM to 5 mM as shown in Fig. 7a. The cathodic peak currents increase linearly as increasing of paraquat concentrations. The linear regression equation can be well fitted as IP1 (μA) = 14.74C (mM) + 3.32 with correlation coefficients R2 of 0.996 as shown in Fig. 7b. The sensitivity is calculated to be 208.63 μA mM−1 cm−2 based on eqn (4).46,47 The limit of detection (LOD) is 1.1 mM as follows eqn (5). The PbO-NPs SPE sensor reveals high sensitivity and low LOD. High sensitivity of PbO-NPs SPE sensor to paraquat may be attributed from good electrostatic interactions. In fact, the paraquat molecules are quaternary ammonium compounds that can be ionized to di-positively charged leads to enhancement of electrostatic interactions between negatively charged PbO-NPs/SPE and positively charged paraquat ions.48
 | (4) |
 | (5) |
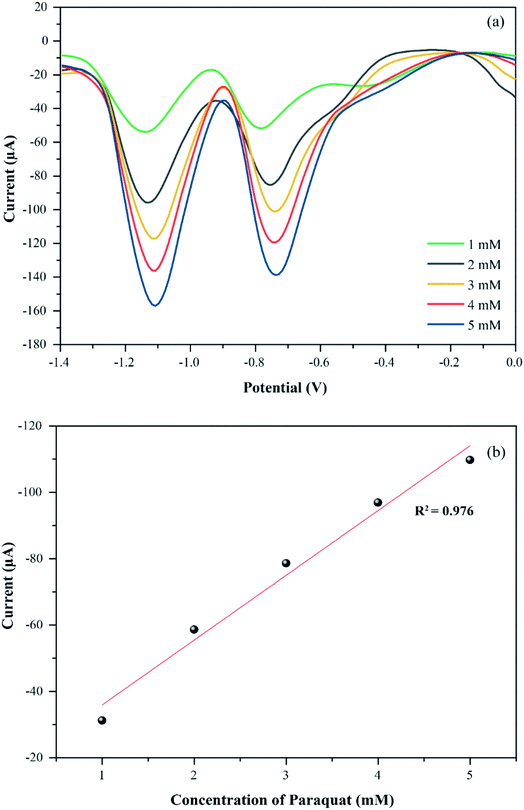
To verify the accuracy of CVs technique for quantitative analysis of paraquat, the differential pulse voltammetry (DPV) was used to compare the electrochemical performance of the PbO-NPs SPE sensors to various paraquat concentrations as shown in Fig. 8. The DPV results exhibit the similar behaviors on cathodic peak currents and voltage according to CVs measurements. The DPV current peaks increase linearly with increasing paraquat concentration (IP1 (μA) = 19.53C (mM) + 16.41, R2 = 0.976). The sensitivity based on DPV is 276.63 μA mM−1 cm−2 that is higher than CVs technique because DPV is more sensitive than CV. Therefore, the CVs are good enough and suitable technique for the quantitative detection of paraquat in this work.
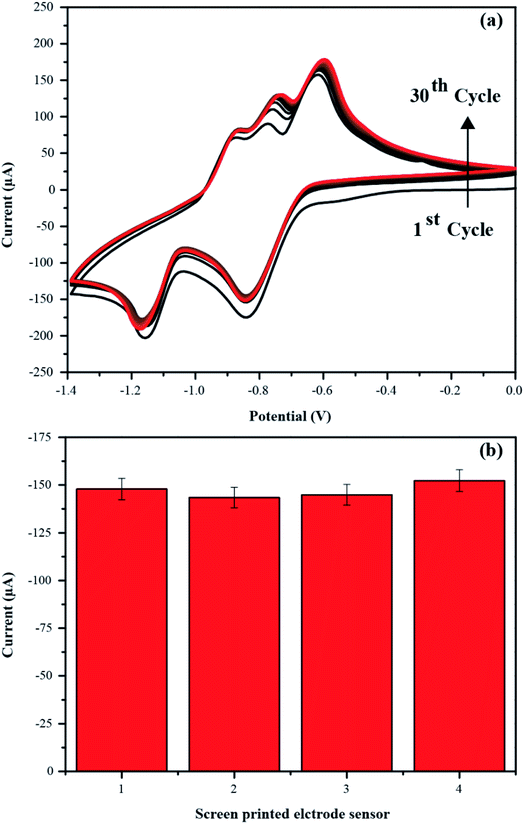
To evaluate the reproducibility and repeatability, the four independent PbO-NPs sensors were fabricated and tested with 10 mM paraquat under the optimal electrochemical condition. The CVs of PbO-NPs sensors were carried out for 30 cycles as shown in the Fig. 9a. It can be seen that the cathodic peaks current increases a bit with increasing the number of scans due to the charge accumulation on sensing film. No any large shift in voltages and current were found. The average standard deviation (SD) values of 4 times measurements were approximately 4.56% for peak 1 as shown in the Fig. 9b. The CVs of four independent fabricated PbO-NPs sensors are displayed in Fig. S2 in the ESI.† Thus, it suggests the high stability and reproducibility of the sensor.
3.3 Chronoamperometric measurement of PbO-NPs sensor
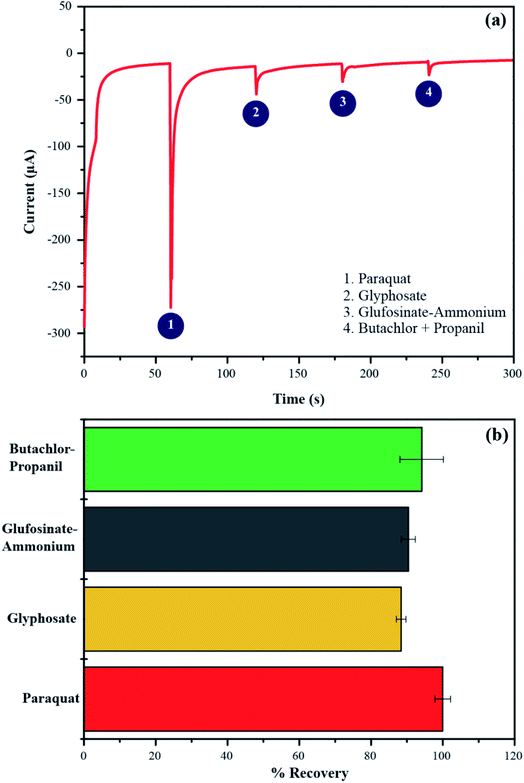
To investigate the selectivity of PbO-NPs sensor, the chronoamperometry (CA) method was used for studying the relationship between response of reduction current and time at fixed potential. The paraquat is a well-known herbicide. Thus, the other popular herbicides such as glyphosate, glufosinate-ammonium and butachlor-propanil have been selected for interference effects in this study. The PbO-NPs sensor was applied with a potential of −0.8 V for 240 s by addition of each interfering solution of 100 μL (10 mM) at every 60 s. The recovery percentage can be calculated as following eqn (6).
 | (6) |
A real-time dynamic chronoamperometric plot is displayed in Fig. 10a. It reveals that the PbO-NPs sensor exhibits high selectivity to paraquat over other popular herbicides. The measurements were performed using three PbO-NPs sensors. The average percentage of recovery is calculated to be 89–95% as shown in Fig. 10b. The sources of the error bars are SD from the currents of CA with three repeated measurements (four independent PbO/SPE sensors). It should be noted that the peak current of 10 mM paraquat as shown in Fig. 10a is higher than the peak current as shown in Fig. 9. The different currents come from different measurement methods between CV and CA technique. The CV experiment applies multiple potential cycles while the CA uses a fixed square-wave potential to apply the working electrode that may have some current fluctuation leading to difference currents between the two methods. In addition, the measurement of current response in the CA method was applied with a steady potential (−0.8 V) and times (every 60 s). The accumulation of charges between a conductive surface of electrode and electrolyte in double-layer can be formed and increased a current response over CV measurement. However, it's not make any effects on selectivity tests. The currents obtained from interactions of different herbicides can be compared with the similar method.
To further evaluate the sensitivity and selectivity of PbO-NPs SPE sensor, the CVs responses to glyphosate, glufosinate-ammonium and butachlor-propanil are shown in Fig. S3 in the ESI.† Due to its superior reaction sites of PbO and strong electrostatic interactions between negatively charged PbO-NPs/SPE and positively charged paraquat ions, the PbO-NPs SPE sensor exhibits high sensitivity and selectivity to paraquat at a potential of −0.8 V. However, the PbO-NPs SPE sensor is also sensitive to glyphosate, glufosinate-ammonium and butachlor-propanil at different applied potentials with different electrochemical behaviors. Therefore, the selectivity of electrochemical sensors can be considered with a fixed applied potential matching with chemical reduction/oxidation between sensing materials and targeted chemical species.
3.4 Paraquat sensing mechanism
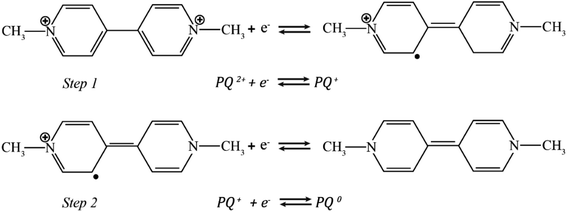
The electrochemical response occurs from interactions between paraquat and the PbO-NPs on a SPE. The concept of the sensing mechanism is described by charge transfer. The structure model of the metal oxide electrode in aqueous solution is generally divided into two distinct regions: a compact layer and a diffuse layer. The compact layer includes an inner Helmholtz layer (IHP) and an outer Helmholtz layer (OHP).49,50 Therefore, when the aqueous solution contains paraquat molecules and water molecules under the electrostatic force, the hydrogen, or hydroxyl ions (the water dissociation), the positively charged paraquat are absorbed onto the negatively charged surface of the PbO-NPs resulting in charge transfer at the IHP of the compact layer. The interaction of the PbO-NPs and paraquat occurs through the π–π stacking of aromatic ring forming charge transfer complexes. The negatively charged surface of the PbO-NPs will help to promote and attract the accumulation of paraquat leading to high sensitivity and selectivity of sensor.In addition, the paraquat detection can be monitored by the two-reduction process which transfers one electron in each step. Therefore, the possible mechanism of paraquat detection may be described in the equation of Fig. 11 as follows51–53
Step 1: the first reduction state involves to the formation of the radical paraquat cation (PQ˙2+)
Step 2: the second reduction state involves to the transformation of PQ+ into neutral molecules PQ0.
3.5 Detection of paraquat contamination in samples
Practical application of the PbO-NPs sensor for paraquat determination was estimated in samples such as milk and instant mixed vegetable-fruit juice. The 200 μL of paraquat solution was added into the 200 μL of each sample (10 mM paraquat concentration). The mixture was stirred for 1 min. The 100 μL of mixture was dropped on PbO-NPs SPE sensor and examined by using CV analysis under optimized conditions (pH 7, 100 mV s−1). The summarized data of recovery percentage and the relative standard deviation obtained is presented in Table 1. The PbO-NPs sensor can determine the paraquat concentration in mixed vegetable-fruit juice and milk with % recovery of 101.10% and 80.90%, respectively, referring well identity the paraquat contamination in juice. In case of milk, it consists of fat, proteins, lactose, etc. that can strongly affect on interaction between PbO-NPs surface and paraquat molecules resulting to underestimate paraquat concentration. This PbO-NPs sensor may prefer to be used in samples with low fat, proteins and lactose.
 | (7) |
| Sample | Added concentration (mM) | Found concentration (mM) | Recovery (%) | RSD (%) |
|---|---|---|---|---|
| Juice | 10 | 10.11 | 101.10 | 5.95 |
| Milk | 10 | 8.09 | 80.90 | 4.33 |
4. Conclusion
In summary, the electrochemical sensor for the paraquat detection has been successfully developed by modifying with the PbO-NPs onto a screen-printed Ag working electrode surface. The PbO-NPs were synthesized via sparking method that offers a simple, rapid and low-cost method for producing nanoparticles under room temperature and normal pressure. The synthesized nanoparticles are spherical shape with the average size of 22.95 ± 5.46 nm. The electrochemical behaviors have been investigated using the cyclic voltammetry. Under the optimal experimental conditions (scan rate of 100 mV s−1, 0.1 M Tris buffer (pH 7)), the PbO-NPs/SPE sensors demonstrate the redox reaction of PQ2+ by showing two cathodic peak currents around −0.8 V and −1.1 V. The PbO-NPs/SPE sensor exhibits very good linear response with concentrations in range from 1 mM to 5 mM (R2 = 0.996) with high sensitivity of 204.8 μA mM−1 cm−2. The LOD of the PbO-NPs/SPE sensor is 1.1 mM (0.28 μg L−1) that is lower that maximum permissible limit for total pesticides in drinking water (0.5 μg L−1), for surface waters (1–3 μg L−1)54 and for paraquat residues in drinking water that varies from 1–30 μg L−1 in different countries.55 Moreover, the PbO-NPs sensor shows high selective to paraquat over other popular herbicides such as glyphosate, glufosinate-ammonium and butachlor-propanil. The developed sensors can be integrated into a smartphone for on-site field testing. Based on the presented methods and results, it is hope that this work can be an alternative way to develop the electrochemical paraquat sensor for commercialization in future.Conflicts of interest
There are no conflicts to declare.Acknowledgements
This work was financially supported by Agricultural Research Development Agency (Public Organization) and Kasetsart University Research and Development Institute (FF(KU) 25.64). P. T. acknowledges the Graduate Program Scholarship from the Graduate School, Kasetsart University.References
- R. H. Bromilow, Paraquat and sustainable agriculture, Pest Manage. Sci., 2004, 60, 340–349 CrossRef CAS PubMed.
- Z. Zhao, F. Zhang and Z. Zhang, A facile fluorescent “turn-off” method for sensing paraquat based on pyranine-paraquat interaction, Spectrochim. Acta, Part A, 2018, 199, 96–101 CrossRef CAS PubMed.
- J. S. Bus and J. E. Gibson, Paraquat: model for oxidant-initiated toxicity, Environ. Health Perspect., 1984, 55, 37–46 CrossRef CAS PubMed.
- Z. E. Suntres, Role of antioxidants in paraquat toxicity, Toxicology, 2002, 180, 65–77 CrossRef CAS PubMed.
- M. A. Constenla, D. Riley, S. H. Kennedy, C. E. Rojas, L. E. Mora and J. E. B. Stevens, Paraquat behavior in Costa Rican soils and residues in coffee, J. Agric. Food Chem., 1990, 38, 1985–1988 CrossRef CAS.
- Y. Huang, H. Zhan, P. Bhatt and S. Chen, Paraquat Degradation From Contaminated Environments: Current Achievements and Perspectives, Front. Microbiol., 2019, 10, 1754 CrossRef PubMed.
- M. Asaduzzaman, M. R. Chando, N. Ahmed, K. M. Rezwanul Islam, M. M. J. Alam and S. Roy, Paraquat-induced acute kidney and liver injury: case report of a survivor from Bangladesh, Clinical Case Reports, 2021, 9, e05020 CrossRef PubMed.
- F. Amin, A. Memarzia, H. K. Rad, H. R. Kazerani and M. H. Boskabady, RETRACTED ARTICLE: Carvacrol and PPARγ agonist, pioglitazone, affects inhaled paraquat-induced lung injury in rats, Sci. Rep., 2021, 11, 8129 CrossRef CAS PubMed.
- N. Lamei, M. Ezoddin, N. R. Kakavandi, K. Abdi and M. Ghazi-khansari, Ultrasound-Assisted Switchable Solvent in Determination of Quaternary Ammonium Herbicide Paraquat in Biological, Environmental Water, and Apple Juice Samples Using Chemical Reduction Process Coupled to GC-MS Detection, Chromatographia, 2018, 81, 923–930 CrossRef CAS.
- S. Ou, Y. Wang, X.-B. Chen, J. Chen and L. Chen, Determination of Paraquat in Environmental Water by Ionic Liquid-Based Liquid Phase Extraction with Direct Injection for HPLC, J. Anal. Chem., 2018, 73, 862–868 CrossRef.
- C. Zhu, D. Liu, M. Yan, G. Xu, H. Zhai, J. Luo, G. Wang, D. Jiang and Y. Yuan, Three-dimensional surface-enhanced Raman scattering substrates constructed by integrating template-assisted electrodeposition and post-growth of silver nanoparticles, J. Colloid Interface Sci., 2022, 608, 2111–2119 CrossRef CAS PubMed.
- W. Tan, X. Xu, Y. Lv, W. Lei, K. Hu, F. Ye and S. Zhao, Sulfonic acid functionalized hierarchical porous covalent organic frameworks as a SALDI-TOF MS matrix for effective extraction and detection of paraquat and diquat, J. Colloid Interface Sci., 2021, 603, 172–181 CrossRef CAS PubMed.
- F. Laghrib, M. Bakasse, S. Lahrich and M. A. El Mhammedi, Electrochemical sensors for improved detection of paraquat in food samples: a review, Mater. Sci. Eng., C, 2020, 107, 110349 CrossRef CAS PubMed.
- H. Du, Y. Xie and J. Wang, Nanomaterial-sensors for herbicides detection using electrochemical techniques and prospect applications, TrAC, Trends Anal. Chem., 2021, 135, 116178 CrossRef CAS.
- T. Seesaard, N. Goel, M. Kumar and C. Wongchoosuk, Advances in gas sensors and electronic nose technologies for agricultural cycle applications, Comput. Electron. Agric., 2022, 193, 106673 CrossRef.
- M. V. S. Sant'Anna, J. O. S. Silva, A. Gevaerd, L. S. Lima, M. D. S. Monteiro, I. S. C. Carregosa, A. Wisniewski, L. H. Marcolino-Junior, M. F. Bergamini and E. M. Sussuchi, Selective carbonaceous-based (nano)composite sensors for electrochemical determination of paraquat in food samples, Food Chem., 2022, 373, 131521 CrossRef PubMed.
- H. S. Kavazoi, C. S. Martin and P. Alessio, Comparative study of tetrasulfonated phthalocyanine modified screen-printed electrodes in paraquat, Synth. Met., 2022, 284, 116988 CrossRef CAS.
- S. Ali, M. R. Shah, S. Hussain, S. Khan, A. Latif, M. Ahmad and M. Ali, A Facile Approach Based on Functionalized Silver Nanoparticles as a Chemosensor for the Detection of Paraquat, J. Cluster Sci., 2022, 33, 413–420 CrossRef CAS.
- P. B. Deroco, D. Wachholz Junior and L. T. Kubota, Silver Inkjet-Printed Electrode on Paper for Electrochemical Sensing of Paraquat, Chemosensors, 2021, 9, 61 CrossRef CAS.
- D. C. Souza, L. O. Orzari, P. R. Oliveira, C. Kalinke, J. A. Bonacin, O. Malaspina, R. C. F. Nocelli and B. C. Janegitz, Electrochemical Sensor Based on Beeswax and Carbon Black Thin Biofilms for Determination of Paraquat in Apis mellifera Honey, Food Anal. Methods, 2021, 14, 606–615 CrossRef.
- Y. Jiang, Q. Li, J. Yao, X. Guo, Y. Ying, X. Liu, Y. Wen, H. Yang and Y. Wu, Advanced photoelectrochemical detection of paraquat based on plasmonic metal modified photocathode material, Appl. Surf. Sci., 2021, 151903 Search PubMed.
- Q. Zhou, X. Zhou, R. Zheng, Z. Liu and J. Wang, Application of lead oxide electrodes in wastewater treatment: a review, Sci. Total Environ., 2022, 806, 150088 CrossRef CAS PubMed.
- M. E. Mahmoud, A. M. El-Khatib, A. M. Halbas and R. M. El-Sharkawy, Ceramic tiles doped with lead oxide nanoparticles: their fabrication, physical, mechanical characteristics and γ-ray shielding performance, Radiat. Phys. Chem., 2021, 189, 109780 CrossRef CAS.
- O. Grynko, T. Thibault, E. Pineau and A. Reznik, The X-ray Sensitivity of an Amorphous Lead Oxide Photoconductor, Sensors, 2021, 21 Search PubMed.
- V. K. Perla, S. K. Ghosh and K. Mallick, Carbon Nitride Supported Lead Oxide Nanoparticles for Memristor Application: Charge-Transport Mechanism for Resistive Switching, J. Phys. Chem. C, 2021, 125, 1054–1059 CrossRef CAS.
- S. M. Ahmed, R. Y. Mohammed, A. F. Abdulrahman, F. K. Ahmed and S. M. Hamad, Synthesis and characterization of lead oxide nanostructures for radiation attenuation application, Mater. Sci. Semicond. Process., 2021, 130, 105830 CrossRef CAS.
- F. A. Ibrahim and M. M. El-Desoky, Synthesis, structure and dielectric properties of zirconium and titanium oxide-doped lead oxide nano-crystalline films fabricated by sol–gel techniques for energy-storage application, J. Mater. Sci.: Mater. Electron., 2021, 32, 19754–19763 CrossRef CAS.
- A. Guo, E. Chen, B. R. Wygant, A. Heller and C. B. Mullins, Lead Oxide Microparticles Coated by Ethylenediamine-Cross-Linked Graphene Oxide for Lithium Ion Battery Anodes, ACS Appl. Energy Mater., 2019, 2, 3017–3020 CrossRef CAS.
- E. Nazaripour, F. Mousazadeh, M. Doosti Moghadam, K. Najafi, F. Borhani, M. Sarani, M. Ghasemi, A. Rahdar, S. Iravani and M. Khatami, Biosynthesis of lead oxide and cerium oxide nanoparticles and their cytotoxic activities against colon cancer cell line, Inorg. Chem. Commun., 2021, 131, 108800 CrossRef CAS.
- Y. Seekaew, A. Wisitsoraat, D. Phokharatkul and C. Wongchoosuk, Room temperature toluene gas sensor based on TiO2 nanoparticles decorated 3D graphene-carbon nanotube nanostructures, Sens. Actuators, B, 2019, 279, 69–78 CrossRef CAS.
- J. Shi, P. Guo, Y. Liu, J. Su and L. Guo, PbO-sensitized ZnO nanorod arrays for enhanced visible-light-driven photoelectrochemical performance, J. Mater. Res., 2016, 31, 1622–1630 CrossRef CAS.
- A. Miri, M. Sarani, A. Hashemzadeh, Z. Mardani and M. Darroudi, Biosynthesis and cytotoxic activity of lead oxide nanoparticles, Green Chem. Lett. Rev., 2018, 11, 567–572 CrossRef CAS.
- K. Hari Prasad, S. Vinoth, P. Jena, M. Venkateswarlu and N. Satyanarayana, Structural characterization and impedance studies of PbO nanofibers synthesized by electrospinning technique, Mater. Chem. Phys., 2017, 194, 188–197 CrossRef CAS.
- S. Yazdani Darki, M. Eslami-Kalantari, H. Zare and Z. Shahedi, Effects of PVP surfactant and different alkalis on the properties of PbO nanostructures, Mater. Chem. Phys., 2021, 262, 124305 CrossRef CAS.
- V. Batra, C. V. Ramana and S. Kotru, Annealing-induced changes in chemical bonding and surface characteristics of chemical solution deposited Pb0. 95La0. 05Zr0. 54Ti0. 46O3 thin films, Appl. Surf. Sci., 2016, 379, 191–198 CrossRef CAS.
- C.-j. Yang, L.-x. Zhao, X. Zhang, D.-c. Zhai and Y. Gu, Insight into Oxidation of Lead Powder during Electrodeposition, Prot. Met. Phys. Chem. Surf., 2020, 56, 302–310 CrossRef.
- B. K. Urhan, T. Öznülüer, Ü. Demir and H. Ö. Doğan, One-pot electrochemical synthesis of lead oxide-electrochemically reduced graphene oxide nanostructures and their electrocatalytic applications, IEEE Sens. J., 2019, 19, 4781–4788 CAS.
- M. Khanuja, S. Kala, B. R. Mehta, H. Sharma, S. M. Shivaprasad, B. Balamurgan, A. Maisels and F. E. Kruis, XPS and AFM studies of monodispersed Pb/PbO core–shell nanostructures, J. Nanosci. Nanotechnol., 2007, 7, 2096–2100 CrossRef CAS PubMed.
- A. Mekki, XPS study of lead vanadate glasses, Arabian J. Sci. Eng., 2003, 28, 73–86 CAS.
- B. Guo, B. Liu, A. A. Volinsky, M. Fincan, J. Du and S. Zhang, Immobilization mechanism of Pb in fly ash-based geopolymer, Constr. Build. Mater., 2017, 134, 123–130 CrossRef CAS.
- W. B. S. Machini, C. S. Martin, M. T. Martinez, S. R. Teixeira, H. M. Gomes and M. F. S. Teixeira, Development of an electrochemical sensor based on nanostructured hausmannite-type manganese oxide for detection of sodium ions, Sens. Actuators, B, 2013, 181, 674–680 CrossRef CAS.
- P. L. Runnels, J. D. Joseph, M. J. Logman and R. M. Wightman, Effect of pH and surface functionalities on the cyclic voltammetric responses of carbon-fiber microelectrodes, Anal. Chem., 1999, 71, 2782–2789 CrossRef CAS PubMed.
- R. Wang, K. Wu and C. Wu, Highly sensitive electrochemical sensor for toxic ractopamine based on the enhancement effect of acetylene black nanoparticles, Anal. Methods, 2015, 7, 8069–8077 RSC.
- P. Traiwatcharanon, W. Siriwatcharapiboon and C. Wongchoosuk, Electrochemical Sodium Ion Sensor Based on Silver Nanoparticles/Graphene Oxide Nanocomposite for Food Application, Chemosensors, 2020, 8, 58 CrossRef CAS.
- J. I. Gowda and S. T. Nandibewoor, Electrochemical behavior of paclitaxel and its determination at glassy carbon electrode, Asian J. Pharm. Sci., 2014, 9, 42–49 CrossRef.
- A. Pop, F. Manea, A. Flueras and J. Schoonman, Simultaneous Voltammetric Detection of Carbaryl and Paraquat Pesticides on Graphene-Modified Boron-Doped Diamond Electrode, Sensors, 2017, 17, 2033 CrossRef PubMed.
- V. S. Manikandan, B. Sidhureddy, A. R. Thiruppathi and A. Chen, Sensitive Electrochemical Detection of Caffeic Acid in Wine Based on Fluorine-Doped Graphene Oxide, Sensors, 2019, 19, 1604 CrossRef CAS PubMed.
- F. Cui, L. Chu and X. Zhang, Nanocomposite of graphene based sensor for paraquat: synergetic effect of nano-gold and ionic liquids on electrocatalysis, Anal. Methods, 2012, 4, 3974–3980 RSC.
- S. Ali, M. R. Shah, S. Hussain, S. Khan, A. Latif, M. Ahmad and M. Ali, A Facile Approach Based on Functionalized Silver Nanoparticles as a Chemosensor for the Detection of Paraquat, J. Cluster Sci., 2021, 1–8 Search PubMed.
- C. Zhang, X. Liang, Y. Lu, H. Li and X. Xu, Performance of CuAl-LDH/Gr Nanocomposite-Based Electrochemical Sensor with Regard to Trace Glyphosate Detection in Water, Sensors, 2020, 20, 4146 CrossRef CAS PubMed.
- M. Sayyahmanesh, S. Asgari, A. S. E. Meibodi and T. M. Ahooyi, Voltammetric Determination of Paraquat Using Graphite Pencil Electrode Modified with Doped Polypyrrole, 2016, arXiv preprint arXiv: 1604.07853 Search PubMed.
- P. B. Deroco, D. Wachholz Junior and L. T. Kubota, Silver Inkjet-Printed Electrode on Paper for Electrochemical Sensing of Paraquat, Chemosensors, 2021, 9, 61 CrossRef CAS.
- H. L. Tcheumi, V. N. Tassontio, I. K. Tonle and E. Ngameni, Surface functionalization of smectite-type clay by facile polymerization of β-cyclodextrin using citric acid cross linker: application as sensing material for the electrochemical determination of paraquat, Appl. Clay Sci., 2019, 173, 97–106 CrossRef CAS.
- M. Akhtar, S. M. Hasany, M. I. Bhanger and S. Iqbal, Low cost sorbents for the removal of methyl parathion pesticide from aqueous solutions, Chemosphere, 2007, 66, 1829–1838 CrossRef CAS PubMed.
- D. J. Hamilton, Á. Ambrus, R. M. Dieterle, A. S. Felsot, C. A. Harris, P. T. Holland, A. Katayama, N. Kurihara, J. Linders, J. Unsworth and S. S. Wong, Regulatory limits for pesticide residues in water (IUPAC Technical Report), Pure Appl. Chem., 2003, 75, 1123–1155 CAS.
Footnote |
| † Electronic supplementary information (ESI) available. See https://doi.org/10.1039/d2ra02034c |
| This journal is © The Royal Society of Chemistry 2022 |

