 Open Access Article
Diluted magnetic semiconductor properties in TM doped ZnO nanoparticles
Iqra Jabbara,
Yasir Zamana,
Khaled Althubeitib,
Sattam Al Otaibic,
M. Zahid Ishaquea,
Nasir Rahmand,
Mohammad Sohaild,
Alamzeb Khane,
Asad Ullahf,
Tommaso Del Rossog,
Quaid Zaman *h,
Rajwali Khan
 *di and
Aurangzeb Khanj
aDepartment of Physics, University of Sargodha, Sargodha, 40100, Pakistan
bDepartment of Chemistry, College of Science, Taif University, P. O. Box 11099, Taif 21944, Saudi Arabia
cDepartment of Electrical Engineering, Collage of Engineering, Taif University, P. O. Box 11099, Taif 21944, Saudi Arabia
dDepartment of Physics, University of Lakki Marwat, KPK, Pakistan. E-mail: rajwali@ulm.edu.pk; rajwalipak@zju.edu.cn
eDepartment of Pediatrics, Yale School of Medicine Yale University, New Haven, CT 06511, USA
fDepartment of Mathematics, University of Lakki Marwat, KPK, Pakistan
gDepartment of Physics, Pontifícia Universidade Católica do Rio de Janeiro, Rua Marques de São Vicente, 22451-900, Rio de Janeiro, Brazil
hDepartment of Physics, University of Buner, KPK 17290, Pakistan
iCollege of Physics and Optoelectronics Shenzhen University, Shenzhen, China
jDepartment of Physics, Abdul Wali Khan University, Mardan, KPK, Pakistan
First published on 5th May 2022
Abstract
The hydrothermal method was used to create dilute magnetic semiconductor nanoparticles of Zn1−xCoxO (x = 0, 0.01, 0.05, 0.09). The effect of cobalt doping on the microstructure, morphological and optical properties of Zn1−xCoxO was also studied and the Co doping to host ZnO was confirmed from XRD and EDX analysis. The structural analysis showed that doping of cobalt into ZnO decreased the crystallinity, but the preferred orientation didn't change. SEM analysis revealed that the cobalt dopant did not have a strong influence on the shape of the synthesized nanoparticles. No defect-related absorption peaks were observed in the UV-Vis spectra. The crystallinity of the doped samples was improved by high growth temperature and long growth time. Ferromagnetic behavior above room temperature was detected in co-doped ZnO nanoparticles. The ferromagnetic behavior increased with increasing Co (up to x = 0.05) doping. The ferromagnetic behavior declined when the Co content was further increased. Related research shows that doped ZnO nanoparticles have better dielectric, electrical conductivity, and magnetic properties than pure ZnO. This high ferromagnetism is usually a response reported for dilute magnetic semiconductors. These semiconductor nanoparticles were further used to designed spintronic based applications.
1. Introduction
Metal–semiconductor oxide nanoparticles (NPs) are of great importance due to their novel electrical and magnetic responses.1 ZnO is a II–VI semiconductor material having a large exciton binding energy of 60 meV and a wide bandgap (3.37 eV),2 which is used in gas sensors,3 photocatalysis,4 and many other fields like spintronics due to its room temperature ferromagnetism (RTFM).5–8 The doping of transition metal ions like cobalt ions into the metal oxide can modify its electronic structure and hence its physical and chemical properties. This category of materials is called dilute magnetic semiconductors (DMSs).1 Among all the transition metal ions cobalt (Co) has a high solubility in ZnO. Also, its ionic radius is the same as that of the zinc (Zn) ion, which is favourable for successful doping at the Zn2+ position.9 ZnO can be grown into different shapes depending upon the growth conditions, for example, spherical and dumbbell,10 rod-like,11,12 nanonails,13 hollow nanospheres,14 pyramid and lath-like rods,15 flowers,16 and nanowires.17 Shape and size both are important to make DMSs suitable for industrial applications. Because doping can change the shape of nanostructures from bottom to top, but it is difficult to control the shape.18 The doping concentration, heating time, and growth temperature influence shape, size, structural and optical properties. Thamir A. A. Hassan, Ali Qassim (2016) found the change in shape from lettuce leaf to nanotubes to nanosticks when the growth duration was changed from 24 hours to 48 hours to 72 hours.19 While F. A. Taher and E. Abdeltwab (2018) showed the formation of the flower-like structure of Co-doped ZnO from a single nanorod when the growth time was changed for 3–18 hours.20 Z. Yu et al. (2010) observed an increase in the diameter of nanorods with an increase in Nickle doping ions.21 Amita et al. (2019) observed a decrease in bandgap from 3.4 eV to 3.28 eV by doping of Co.22 While M. Fang, Z.W. Liu (2016) observed a blue shift in bandgap with doping, doped samples had peaks at 565, 611, and 660 nm related to d–d transitions.23 Santhoshkumar et al. (2016) found a peak at 606 cm−1 related to ZnO stretching vibrations in FTIR spectra.24 The shift in IR peak from 414 cm−1 to 446 cm−1 related to Zn–O bond stretching vibration upon doping of cobalt is also reported.25 M Thuy Doan et al. (2014) prepared ZnO with different concentrations of Co dopant. Strong XRD peak intensities and narrow width showed the extremely pure nature of crystallites. Upon doping, a higher concentration of Cobalt Co3O4 phase appeared.26 S. Shi et al. (2013) produced Co-doped ZnO nanorods and observed that higher concentrations of dopant lead to the segregation of Co3O4 phase described by Raman spectra.1 N. Nishiumi and coworkers (2019) found a diffraction peak for Co(OH)2 for a higher doping level.27 But S. Narasimman successfully doped the Cobalt with cobalt concentration 5 at% to 20 at%, and XRD pattern showed that there did not exist any impurity-related peak.21 It was reported that high growth temperature promoted the doping of transition metal Cr3+ ions to ZnO lattice.28 B. Wang et al. (2009) reported that Co doping had induced some defects and oxygen vacancy as observed by an increase in luminescence intensity in the visible region in PL spectra.2 The control of defects, along with the control in shape and size, is essential for the application of ZnO as defects can alter the properties. DMS can be synthesized by different techniques like chemical precipitation,29 sol–gel,30 chemical bath deposition,31 but the hydrothermal method is very simple and cost-effective to obtain nanostructures on a large scale. Advantages of this hydrothermal synthesis are that it lowers the activation energy that is required for the formation of the final product phase; it enhances the chemical reactivity of the reactants; hence reactions can proceed at low temperatures. The low process temperature avoids the problems that can create in high process temperature.The research on the ZnO nanostructures by the different parameters like with the change in Co doping concentration, growth time, and temperature is still under discussion. Therefore, we have focused on Co doping in ZnO for diluted magnetic semiconductor response. The best parameters at which homogenous size, shape, and defects-free doped ZnO nanoparticles are obtained.
2. Experimental method
The ZnO and Co–ZnO nanoparticles were prepared by using the hydrothermal method. Initially, the Zn(NO3)2·6H2O, KOH, Ethanol, CoCl2·6H2O were purchased from Sigma Aldrich with purity >99%. The required amount of distilled water was used as a solvent for the preparation of all solutions. In the typical preparation, the first 1 M solution of Zn (NO3)2·6H2O was prepared in 50 ml of distilled water. The required amount of cobalt dopant was added in 50 ml of distilled water. Then this solution was added dropwise in the zinc precursor solution. The PH of the solution was adjusted between 9 to 10 by adding a base (KOH solution). The color of the mixture solution was turned to light blue by the addition of KOH. The solution was stirred for half an hour at 60 °C. The solution mixture was poured into a Teflon-lined autoclave, heated at 180 °C for 6 hours, and then cooled down to room temperature (300 K) naturally. The green precipitates were collected by centrifugation, washed with ethanol, and then dried at 80 °C in the oven. To estimate the effect of different growth times on Zn1−xCoxO with x = 0.09 were synthesized at time 2 hours, at 650 °C.The X-ray diffusion (XRD) using Cu Kα radiation (λ = 1.5406 Å) was fixed to scan the X-ray pattern for the measurement of structural properties. Further, their lattice parameters and volumes were calculated by using the High Score Plus software. The m of the particles were observed by a field emission scanning electron microscope (FE-SEM). Transmission electron microscopy was used to identify the particles. The UV-Vis spectrometer was used to analyze the optical spectra of absorption. The Agilent Impedance analyzers and LCR meter in the frequency range 40 Hz to 5 MHz were used to measure the dielectric properties and electrical conductivity. The magnetic response and their related parameters were calculated by Superconducting Quantum Interface Device (SQUID) Quantum Design.
3. Results and discussions
3.1 Structural properties
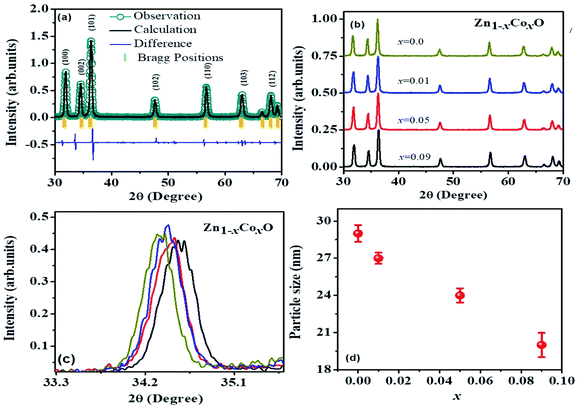
The XRD patterns at 300 K for the pure and ZnO doped with Co samples (Fig. 1(b)) acknowledged its structure wurtzite-type, and their corresponding Rietveld refinement from Fig. 1(a), (the goodness-of-fit χ2 = 2.571 and weighted profile factor RWP = 9.51%), displayed the lattice parameters of a = 3.2395 Å, c = 5.2048 Å with the unit cell volume of V = 47.0400 Å3 for ZnO. Fig. 1(b) represents the XRD pattern of Co-doped ZnO with Co = 0.0, 0.01, 0.05, and 0.09. The peaks observed at 2θ = 31.78°, 34.44°, 36.22°, 47.56°, 56.62°, 62.89°, 66.17°,67.97°,69.10° for pure ZnO correspond to planes (100), (002), (101), (102), (110), (103), (200), (112), (201) respectively. All the diffraction peaks correspond to the hexagonal wurtzite structure of ZnO with reference data #96-901-1663 with preferred orientation along (101) plane. Intensity, positions, and width of XRD peaks are changed with doping of cobalt. With the increase in doping, the concentration of cobalt peak intensities decreases, which is evidence of the substitution of Co2+ ions into Zn2+ lattice sites.32 This substitution causes the strain and lattice disorder in the host ZnO crystal structure.33 At a small concentration and higher doping concentrations (x = 0.05 & 0.09) peaks are shifted towards the lower angles side as shown in Fig. 1(c).34 Shifting of the peaks represents the contraction and expansion of the crystal lattice. Crystallite size is calculated by Debye–Scherrer formula
 | (1) |
 | (2) |
 | (3) |
Lattice parameters of a sample depend upon the defects, external strain, the concentration of dopant, difference between the ionic radii of host and doping ions,38,39 and the interaction (electrostatic i.e. repulsive or attractive) between the ions present in the crystalline lattice.39 As the Co concentration increases, lattice parameter ‘a’ first decreases and then increases with an increase in cobalt concentration. These variations in lattice parameters were also observed by different research groups.1,40 The decrease in lattice parameters for x = 0.01 confirmed the substitution of Co2+ ions at tetrahedral Zn2+ lattice sites. High spin Co2+ substituted at the tetrahedral site has an ionic size smaller (0.58 Å) than the Zn2+ (0.60 Å). When Co concentration increases at x = 0.05, and 0.09 lattice constants increase, this can be due to two reasons: (i) if Co2+ ions are present at interstitial positions (ii) incorporation of Co3+ ions with lattice defects. Cobalt ions at interstitial sites have increased coordination numbers resulting in a large ionic radius. High spin and low spin cobalt ions have large ionic radius 0.745 Å and 0.65 Å, respectively in octahedral coordination. So, these can be the reasons for lattice expansion.34 There is a relationship between c/a and u parameter if ‘c/a’ decreases, then ‘u’ increases, so the distances remain nearly constant among the four tetrahedral because of long-range polar interactions.41 An ideal wurtzite structure has c/a = 1.633, while our undoped and Co-doped samples have c/a ratio between 1.601–1.606; this variation in ratio can be due to oxygen vacancies or/and zinc vacancies42 or most probably due to strain. Lattice parameters are changed with cobalt doping, so a change in bond length can be expected.43
For ZnO hexagonal structure, Zn–O bond length is calculated by using an equation41
 | (4) |
 | (5) |
The decrease in bond length for the sample with x = 0.09 is due to a decrease in lattice parameters.43 This change in bond length causes the lattice strain.44 Micro strain ‘ε’ is calculated using by an equation
 | (6) |
| Zn1−xCoxO sample | (2θ) | D (nm) | ‘a’ (Å) | ‘c’ (Å) | c/a | L (Å) | Micro strain (exp (−3)) (no unit) |
|---|---|---|---|---|---|---|---|
| x = 0.00 | 36.27 | 30.43 | 3.239 | 5.204 | 1.606 | 1.973 | 1.1 |
| x = 0.01 | 36.37 | 29.32 | 3.237 | 5.189 | 1.603 | 1.970 | 1.2 |
| x = 0.05 | 36.22 | 28.55 | 3.251 | 5.211 | 1.602 | 1.978 | 1.09 |
| x = 0.09 | 36.22 | 33.26 | 3.253 | 5.211 | 1.601 | 1.979 | 1.05 |
It is noted that with an increase in concentration, microstrain first increases and then decreases. This might be due to the shifting of trapped atoms to the equilibrium position from the non-equilibrium position. The bond length of synthesized samples depends upon the number of factors like distribution of dopant and host ions and vacancies present in the crystal structure.41 Lattice shrinkage and expansion are evidence of doping in the crystal.45
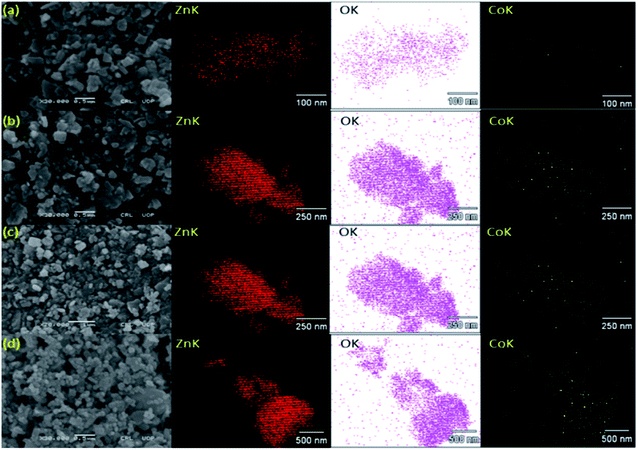
The right side panel of Fig. 2(a)–(e) shows the morphology of synthesized ZnO nanoparticles is not only controlled by Co dopant but also the reducing agent KOH.46 When we use KOH then K+ and Zn+ ions compete with each other. The K+ ions hinder the zinc ions from absorbing on 0001−/+ planes, so instead of absorption of Zn+ on (0001) planes, Zn ions are also absorbed on other six non-polar planes resulting in the formation of particles with a larger diameter and shorter length.47 It is also reported that the size of the cation in the base influences the shape and size of nanoparticles. If the ionic radius of the cation is smaller, then the precipitation rate of ZnO formation will be slow. But the radius of K+ is large; also we have used water as a solvent, so both solvent and KOH have a high precipitation rate resulting in the rapid formation of a large number of nuclei, and then growth occurs depending upon the concentration of the present precursor.48
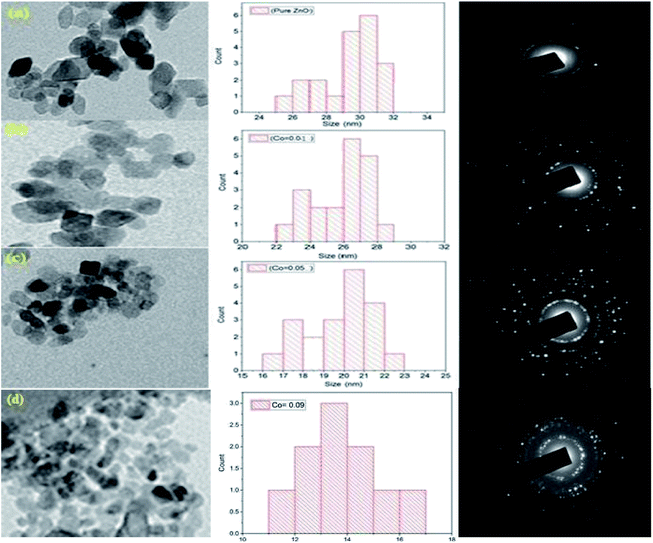
The EDX Spectra was measured from the average scanned region of pure ZnO and Co-doped ZnO nanoparticles respectively, as shown in Fig. 2(a)–(e). The detailed information (generated from EDX) element composition (weight percentage) is also shown in Fig. 2. It can be clearly seen that Zn and O are the only basic elements in ZnO samples. In addition, Zn and Co peaks are noticed in Co–ZnO samples. In addition, it is found that the weight percentage of Co–ZnO is close to the nominal content, which is used for calculation and nanoparticles synthesis. The EDX elemental analysis and color mapping of undoped ZnO and Co-doped ZnO samples demonstrate only elements of Zn and O were present in the ZnO nanoparticles. The elemental composition ratio of Zn and O is shown in Fig. 2. The transmission electron microscopy of pure and Co–ZnO is displayed in Fig. 3 (a)–(c). The pure ZnO is a dominant cubic shape and has an average grain size of 30.73 nm. A clear change in shape is observed for sample x = 0.01; at this very small concentration of Co quasi-spherical nanoparticles are seen having an average particle size of 27.76 nm.1 At x = 0.05, nearly spherical particles are observed, having an average particle size of 19.39 nm. Bappatiyal Pal (2014) also observed a spherical shape for concentration x = 0.05 of cobalt in ZnO.46 On further increase in Co concentration at x = 0.09 spherical particles having average particle size 12.10 nm. A strong change in shape is not observed, indicating that cobalt dopant is morphologically inactive. Rongliang He. Bin Tang and his co-workers (2013) found no change in morphology with Co doping till 5%.47 Two factors occur during the synthesis of nanoparticles by hydrothermal method, which determines the size of the particles, i.e., number of nucleation sites and growth rate of crystal.14 Primary nucleation occurs in a very short time and the growth of nanocrystals as a result of diffusion, agglomeration, and precipitation. As the particle size increases by increasing the concentration of dopant precursor, we can say that the growth rate has increased by increasing concentration. The Ammer Azam also observed this increasing trend in nanoparticles, size et al. (2013), who synthesized the Co-doped ZnO nanorods.48 There exist polar planes ± (101−1), ± (11−01) and ± (011−1) along with ± (0001) in ZnO structure.49 The growth velocities along different planes are given as V (0001) > V (011−1−) > V (011−0) > V (011−1) > V (0001−).50 So ZnO has anisotropic crystal growth; hence it can be grown into different shapes. But in our case, we have used a very high molar concentration of Zn precursor so hydroxylation rate is very high due to high molar contents of Zn2+ ions while dehydration of Zn(OH)2 can be delayed, and the preferred growth along with the c-axis changes to other preferred growth directions like (011−0) and (101−0).51
Fig. 3 shows the TEM images and size distribution of Pure ZnO and Co-doped ZnO. It can be seen from Fig. 3(a)–(c) that all the nanoparticles are almost cubic. Fig. 3(a) and (c) show that ZnO's particle size distribution ranges from 30.39 to 17.29 nm with an average particle size of 10.29 ± 1.71 nm. Fig. 3 (b) shows that the particle size distribution of Co–ZnO with Co (0.01) ranges from 22.58 nm to 19.32 nm with an average particle size of 19.46 ± 1.19 nm. Similarly, in Fig. 3 (c), the particle size distribution of Co–ZnO is 16.87 to 14.53 nm, and the average particle size is 14.81 ± 1.12 nm. Fig. 3 (d) shows that the particle size distribution of Co–ZnO with Co (0.01) ranges from 10.58 nm to 15.32 nm with an average particle size of 12.47 ± 1.09 nm. A reduction in particle size is seen with increasing Co concentration. This is because Co2+ is an alternative to Zn2+ and the ion radius of Co2+ is lower (0.06 nm) than Zn2+ (0.05 nm). As a result of the small size of Co in the lattice, the particle size decreases with the increase in the number of Co2+ ions.
The specific area electron diffraction (SAED) of pure ZnO and Co–ZnO is shown in Fig. 3 (a)–(c) right panels. The estimated values of inter planer distances (d) are 30.435, 29.6116, 2.4654, 2.1976, 1.8765, 1.675 and 1.3987 Å corresponding to (hkl) planes (100), (002), (101), (102), (110), (103), and (200), respectively. All these (hkl) planes are part of the ZnO with a hexagonal structure (space group P63mc). The TEM and XRD data correlate well and rule out the production of secondary phases and oxides.
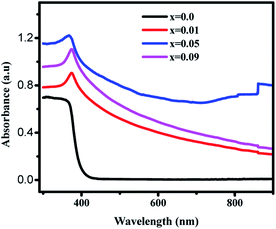
| (αhv)2 = A(hv − Eg) | (7) |
4. Conclusions
We successfully synthesized Zn1−xCoxO (x = 0.00, 0.01, 0.05, 0.09) by hydrothermal method with a variation of three different parameters i.e., doping concentration, growth time, and growth temperature. To substitute the cobalt to zinc sites, there should be a balance between the concentration of dopant, growth time, and temperature. Structural analysis shows that successful substitution occurs to tetrahedral sites of ZnO for very small concentration of dopant. But when the doping concentrations are high, cobalt does not substitute but instead moves to interstitial sites. Successful doping for higher concentration was done at a large growth time, which does not occur at a small growth time. SEM analysis showed that cobalt is morphologically inactive but has a large influence on the size of nanoparticles. With the doping of cobalt, the bandgap decreases because of sp–d exchange interaction among the band electrons and localized ‘d’ electrons of cobalt ions. With the rise of temperature band gap first decreases and then increases maybe because of Burstein–Moss effect. Blue shifting of the bandgap with a decreased temperature is assigned to both the quantum confinement effect and Burstein–Moss effect. So, the best parameters for substitutional doping of cobalt, well-defined shape, and uniform size distribution of nanoparticles are a very small concentration of dopant, i.e., x = 0.01, small growth time, i.e., 6 hours. The ferromagnetic behavior at 300 K was reported in Co–ZnO samples. They are increasing the Co content x to 0.05 results in an increase in ferromagnetic behavior, followed by a drop in ferromagnetic activity. Comparison research reveals that Co-doped ZnO nanoparticles have better dielectric, magnetic, and electrical conductivity than greater Co-doped ZnO, allowing them to be employed as ultrahigh dielectric materials, high-frequency devices, and spintronics.Funding
This work was financially supported by Taif University with a Project number (TURSP-2020/228), Taif University, Taif, Saudi Arabia.Author contributions
Iqra Jabbar, Yasir Zaman, Khaled Althubeiti, Sattam Al Otaibi M. Zahid Ishaque, Nasir Rahman, Mohammad Sohail, Alamzeb khan, Rajwali Khan handled the text of this paper and the formatting of this paper. Dr. Asad Ullah, Tommaso Del Rosso, Quaid Zaman, Rajwali Khan, Auranzeb khan prepared the concept for the paper and did the experimental work for the paper. All authors have read and agreed to the published version of the manuscript. Finally this whole paper submission is handling by Dr Rajwali Khan and Quaid Zaman.Conflicts of interest
The authors declare that they have no known competing financial interests or personal relationships that could have influenced the work reported in this paper.Acknowledgements
The authors appreciated Taif University Researchers Supporting Project number TURSP-2020/228, Taif University, Taif, Saudi Arabia.References
- S. Shi, Y. Yang, J. Xu, L. Li, X. Zhang, G.-H. Hu and Z.-M. Dang, J. Alloys Compd., 2013, 576, 59–65 CrossRef CAS.
- B. Wang, C. Xia, J. Iqbal, N. Tang, Z. Sun, Y. Lv and L. Wu, Solid State Sci., 2009, 11, 1419–1422 CrossRef CAS.
- B. Baruwati, D. K. Kumar and S. V. Manorama, Sensor. Actuator. B Chem., 2006, 119, 676–682 CrossRef CAS.
- A. Hosseinian, Z. Sheybanifard and A. R. Mahjoub, Inorg. Nano-Metal Chem., 2017, 47, 302–307 CrossRef CAS.
- R. Khan, K. Althubeiti, Zulfiqar, A. M. Afzal, N. Rahman, S. Fashu, W. Zhang, A. Khan and R. Zheng, J. Mater. Sci. Mater. Electron., 2021, 32, 24394–24400 CrossRef CAS.
- R. Khan, Zulfiqar, C. I. Levartoski de Araujo, T. Khan, Muneeb-Ur-Rahman, Zia-Ur-Rehman, A. Khan, B. Ullah and S. Fashu, J. Mater. Sci. Mater. Electron., 2018, 29, 9785–9795 CrossRef CAS.
- A. Azam, A. S. Ahmed, M. S. Ansari, M. Shafeeq M and A. H. Naqvi, J. Alloys Compd., 2010, 506, 237–242 CrossRef CAS.
- R. Khan, Zulfiqar, S. Fashu, Z. U. Rehman, A. Khan and M. U. Rahman, J. Mater. Sci. Mater. Electron., 2017, 29, 32–37 CrossRef.
- H. Pan, Y. Zhang, Y. Hu and H. Xie, Optik, 2020, 208, 164560 CrossRef CAS.
- N. Rajkumar, M. Prabhu and K. Ramachandran, Int. J. Nanosci., 2011, 10, 87–92 CrossRef CAS.
- M. Ghosh and A. K. Raychaudhuri, Nanotechnology, 2008, 19, 445704 CrossRef PubMed.
- L. M. Hang, Z. J. Zhang and Z. Y. Zhang, Adv. Mater. Res., 2014, 934, 71–74 CAS.
- X. Huang, L. Shao, G.-W. She, M. Wang, S. Chen and X.-M. Meng, CrystEngComm, 2012, 14, 8330 RSC.
- C. Zhu, B. Lu, Q. Su, E. Xie and W. Lan, Nanoscale, 2012, 4, 3060 RSC.
- H. Wang, J. Xie, K. Yan and M. Duan, J. Mater. Sci. Technol., 2011, 27, 153–158 CrossRef CAS.
- D. E. Motaung, G. H. Mhlongo, S. S. Nkosi, G. F. Malgas, B. W. Mwakikunga, E. Coetsee, H. C. Swart, H. M. I. Abdallah, T. Moyo and S. S. Ray, ACS Appl. Mater. Interfaces, 2014, 6, 8981–8995 CrossRef CAS PubMed.
- L. E. Greene, B. D. Yuhas, M. Law, D. Zitoun and P. Yang, Inorg. Chem., 2006, 45, 7535–7543 CrossRef CAS PubMed.
- M. Gerigk, P. Ehrenreich, M. R. Wagner, I. Wimmer, J. S. Reparaz, C. M. Sotomayor Torres, L. Schmidt-Mende and S. Polarz, Nanoscale, 2015, 7, 16969–16982 RSC.
- S. Baruah and J. Dutta, Sci. Technol. Adv. Mater., 2009, 10, 013001 CrossRef PubMed.
- F. A. Taher and E. Abdeltwab, CrystEngComm, 2018, 20, 5844–5856 RSC.
- Z. Yu, S. Ge, Y. Zuo, G. Wang and F. Zhang, Appl. Surf. Sci., 2010, 256, 5813–5817 CrossRef CAS.
- D. Amita and P. S. Rana, AIP Conf. Proc., 2019, 2115, 030109 CrossRef.
- M. Fang and Z. W. Liu, Mater. Sci. Semicond. Process., 2017, 57, 233–238 CrossRef CAS.
- A. Santhoshkumar, H. P. Kavitha and R. Suresh, Karbala Int. J. Mod. Sci., 2016, 2, 196–202 CrossRef.
- S. Narasimman, L. Balakrishnan and Z. C. Alex, RSC Adv., 2018, 8, 18243–18251 RSC.
- M. Thuy Doan, X. Vinh Ho, T. Nguyen and V. N. Nguyen, Adv. Nat. Sci. Nanosci. Nanotechnol., 2014, 5, 025011 CrossRef.
- N. Nishiumi, H. Sun, H. Shiroishi, Y. Matsushima, P. Stadler and T. Yoshida, ECS Trans., 2018, 88, 369–380 CrossRef CAS.
- S. Wang, M. Zhong, C. Liu, Y. Li, M. Zhu, H. Jin and Y. Hu, J. Chem., 2013, 2013, 1–7 Search PubMed.
- A. J. Ahmed, Int. Res. J. Pharm., 2018, 9, 16–24 CrossRef CAS.
- A. A. Azab, S. A. Esmail and M. K. Abdelamksoud, Silicon, 2019, 11, 165–174 CrossRef CAS.
- A. Kaphle, E. Echeverria, D. N. Mcllroy, K. Roberts and P. Hari, J. Nanosci. Nanotechnol., 2019, 19, 3893–3904 CrossRef CAS PubMed.
- V. Gandhi, R. Ganesan, H. H. Abdulrahman Syedahamed and M. Thaiyan, J. Phys. Chem. C, 2014, 118, 9715–9725 CrossRef CAS.
- J. El Ghoul, M. Kraini, O. M. Lemine and L. El Mir, J. Mater. Sci. Mater. Electron., 2015, 26, 2614–2621 CrossRef CAS.
- J. Hays, K. M. Reddy, N. Y. Graces, M. H. Engelhard, V. Shutthanandan, M. Luo, C. Xu, N. C. Giles, C. Wang, S. Thevuthasan and A. Punnoose, J. Phys. Condens. Matter, 2007, 19, 266203 CrossRef CAS PubMed.
- Ş. Ş. Türkyılmaz, N. Güy and M. Özacar, J. Photochem. Photobiol. A Chem., 2017, 341, 39–50 CrossRef.
- Y. Zong, Y. Sun, S. Meng, Y. Wang, H. Xing, X. Li and X. Zheng, RSC Adv., 2019, 9, 23012–23020 RSC.
- A. Ramachandra, A. N. Mallika, K. Sowri and K. Venugopal, Int. J. Mining, Metall. Mech. Eng., 2015, 3(2), 2320–4060 Search PubMed.
- G. H. Mhlongo, K. Shingange, Z. P. Tshabalala, B. P. Dhonge, F. A. Mahmoud, B. W. Mwakikunga and D. E. Motaung, Appl. Surf. Sci., 2016, 390, 804–815 CrossRef CAS.
- J. Wojnarowicz, T. Chudoba, S. Gierlotka, K. Sobczak and W. Lojkowski, Crystals, 2018, 8, 179 CrossRef.
- L. W. Yang, X. L. Wu, T. Qiu, G. G. Siu and P. K. Chu, J. Appl. Phys., 2006, 99, 074303 CrossRef.
- M. M. Hassan, W. Khan, A. Azam and A. H. Naqvi, J. Lumin., 2014, 145, 160–166 CrossRef CAS.
- J. J. Beltrán, C. A. Barrero and A. Punnoose, Phys. Chem. Chem. Phys., 2015, 17, 15284–15296 RSC.
- I. Y. Habib, A. A. Tajuddin, H. A. Noor, C. M. Lim, A. H. Mahadi and N. T. R. N. Kumara, Sci. Rep., 2019, 9, 9207 CrossRef CAS PubMed.
- M. M. Obeid, H. R. Jappor, K. Al-Marzoki, I. A. Al-Hydary, S. J. Edrees and M. M. Shukur, RSC Adv., 2019, 9, 33207–33221 RSC.
- T. Tsuzuki, R. He, A. Dodd and M. Saunders, Nanomaterials, 2019, 9, 481 CrossRef CAS PubMed.
- B. Pal, S. Dhara, P. K. Giri and D. Sarkar, J. Alloys Compd., 2014, 615, 378–385 CrossRef CAS.
- R. He, B. Tang, C. Ton-That, M. Phillips and T. Tsuzuki, J. Nanoparticle Res., 2013, 15, 2030 CrossRef.
- A. Azam, F. Ahmed, S. S. Habib, Z. H. Khan and N. A. Salah, Met. Mater. Int., 2013, 19, 845–850 CrossRef CAS.
- K. Nejati, Z. Rezvani and R. Pakizevand, Int. Nano Lett., 2011, 1(2), 75–81 CAS.
- P. K. Samanta and A. K. Bandyopadhyay, Appl. Nanosci., 2012, 2, 111–117 CrossRef CAS.
- A. Kaphle, T. Reed, A. Apblett and P. Hari, J. Nanomater., 2019, 2019, 1–13 CrossRef.
- K. Edalati, A. Shakiba, J. Vahdati-Khaki and S. M. Zebarjad, Mater. Res. Bull., 2016, 74, 374–379 CrossRef CAS.
- Ö. Ece, Hydrothermal synthesis and structural characterization of open-framework metal phosphates templated with organic diamines, Izmir Institute of Technology, Turkey, 2012 Search PubMed.
- X. Xu and C. Cao, J. Alloys Compd., 2010, 501, 265–268 CrossRef CAS.
- A. Mesaros, C. D. Ghitulica, M. Popa, R. Mereu, A. Popa, T. Petrisor, M. Gabor, A. I. Cadis and B. S. Vasile, Ceram. Int., 2014, 40, 2835–2846 CrossRef CAS.
- T. Al-Harbi, J. Alloys Compd., 2011, 509, 387–390 CrossRef CAS.
- A. K. Rana, J. Aneesg, Y. Kumar, M. S. Arjunan, K. V. Adarsh, S. Sen and P. M. Shirage, Appl. Phys. Lett., 2015, 107, 231907 CrossRef.
- K. Pradeev raj, K. Sadaiyandi, A. Kennedy, S. Sagadevan, Z. Z. Chowdhury, M. R. Bin Johan, F. A. Aziz, R. F. Rafique, R. Thamiz Selvi and R. Rathina bala, Nanoscale Res. Lett., 2018, 13, 229 CrossRef CAS PubMed.
- J. Estrada-Urbina, A. Cruz-Alonso, M. Santander-González, A. Méndez-Albores and A. Vázquez-Durán, Nanomaterials, 2018, 8, 247 CrossRef CAS PubMed.
| This journal is © The Royal Society of Chemistry 2022 |

