
 Open Access Article
 This Open Access Article is licensed under a
 Creative Commons Attribution 3.0 Unported Licence
Denaturation of proteins: electrostatic effects vs. hydration
Matthias Ballauff
Institut für Chemie und Biochemie, Freie Universität Berlin, Takustraße 3, 14195 Berlin, Germany. E-mail: matthias.ballauff@fu-berlin.de
First published on 31st March 2022
Abstract
The unfolding transition of proteins in aqueous solution containing various salts or uncharged solutes is a classical subject of biophysics. In many cases, this transition is a well-defined two-stage equilibrium process which can be described by a free energy of transition ΔGu and a transition temperature Tm. For a long time, it has been known that solutes can change Tm profoundly. Here we present a phenomenological model that describes the change of Tm with the solute concentration cs in terms of two effects: (i) the change of the number of correlated counterions Δnci and (ii) the change of hydration expressed through the parameter Δw and its dependence on temperature expressed through the parameter dΔcp/dcs. Proteins always carry charges and Δnci describes the uptake or release of counterions during the transition. Likewise, the parameter Δw measures the uptake or release of water during the transition. The transition takes place in a reservoir with a given salt concentration cs that defines also the activity of water. The parameter Δnci is a measure for the gain or loss of free energy because of the release or uptake of ions and is related to purely entropic effects that scale with ln![[thin space (1/6-em)]](https://www.rsc.org/images/entities/char_2009.gif) cs. Δw describes the effect on ΔGu through the loss or uptake of water molecules and contains enthalpic as well as entropic effects that scale with cs. It is related to the enthalpy of transition ΔHu through a Maxwell relation: the dependence of ΔHu on cs is proportional to the dependence of Δw on temperature. While ionic effects embodied in Δnci are independent of the kind of salt, the hydration effects described through Δw are directly related to Hofmeister effects of the various salt ions. A comparison with literature data underscores the general validity of the model.
cs. Δw describes the effect on ΔGu through the loss or uptake of water molecules and contains enthalpic as well as entropic effects that scale with cs. It is related to the enthalpy of transition ΔHu through a Maxwell relation: the dependence of ΔHu on cs is proportional to the dependence of Δw on temperature. While ionic effects embodied in Δnci are independent of the kind of salt, the hydration effects described through Δw are directly related to Hofmeister effects of the various salt ions. A comparison with literature data underscores the general validity of the model.
Introduction
The denaturation of proteins by a globule to coil transition is a classical subject of biophysics.1 The thermal denaturation in which the protein goes from natural folded state to a random coil in aqueous solution occurs with raising temperature. Cold denaturation,2 which has been known for a long time, is the transition to denatured state taking place with decreasing temperature. It is well-established that for many proteins chain denaturation is a two state transition3–6 in which the globular and the denatured form of the protein are well-defined thermodynamic states in equilibrium with each other. Hence, an equilibrium constant Ku can be defined between the globular and denatured state which allows us to treat the denaturation as a fully thermodynamic problem relating the melting temperature Tm to the transition enthalpy ΔHu and the transition entropy ΔSu.7A fundamental problem in the field is the change Tm of a given protein with solutes in the aqueous phase. Up to now, there have been an enormous number of experimental studies that started out in the sixties of the last century.8 There are many investigations that study the change of Tm in the presence of various salts and non-charged solutes which can stabilize or destabilize the globular state.4,6,7,9–20 This effect is of obvious biological importance and can be traced back to hydration effects embodied in the Hofmeister series.21–24 The collapse transition of poly(n-isopropylacrylamide) (PNIPAM) in aqueous solution is another well-studied and fundamental problem where a coiled polymer undergoes a transition from the coiled to the globular state with raising temperature. Here too there is a large number of fundamental and detailed studies on this transition in solutions of various ions.23,25–30 Taken together the folding/unfolding transition of proteins and polymers in general is problem of fundamental importance.
Early studies of protein denaturation clearly revealed the central role of charge–charge interaction.1 The unfolding of the globular protein exposes charged groups to water and this interaction leads to an important contribution to the free energy of unfolding that scales with the logarithm of the salt concentration in solution.1 This term is due to the release or uptake of ions during unfolding and play an important role both for unfolding of proteins as well as for denaturing of DNA in presence of various salts (see the discussion in ref. 31). A similar process takes place when polyelectrolytes form a complex with a protein (counterion release force; see the discussions in ref. 1 and 32–34 and further citations given there). Here a wealth of experimental data demonstrates that this effect is purely entropic and therefore independent of temperature.32,35–37
The unfolding of proteins also exposes hydrophobic amino acids to water. As mentioned above, hydration therefore plays an important role which has been the subject of exhaustive investigations by Record and coworkers in the frame of the solute partitioning model (SPM).22,31,38–40 This model treats the partitioning of the solute ions or solutes between the hydrate and the bulk water. Kosmotropic ions are depleted from the hydrate water whereas chaotropic ions are enriched in this phase. Moreover, these investigations have clearly revealed that effects due to the partitioning of solutes scale linearly with salt concentration which is in full agreement with the analysis by Schellman using Kirkwood–Buff integrals.4,5 Thus, for many kosmotropic salts in the Hofmeister series, a linear relation between the free energy and salt concentration is found (“m-value”; see the discussion in ref. 29). In many cases the m-value is found to be independent of temperature. Based on these considerations, Chen and Schellman developed a phenomenological model that is based on a m-values that do not depend on temperature6,41 (“linear model”; cf. ref. 18). A fact overlooked in later expositions of this theory is the linear dependence of the specific heat Δcp on salt concentration. Chen and Schellman could demonstrate that this dependence is a direct consequence of the assumption of a constant m-value.6 The notion of a m-value independent of temperature, however, is a stringent condition that may not be fulfilled for a given system.42 Hence, a general model should avoid this prerequisite.
Surveying the literature on denaturation of proteins, it becomes clear that exchange of water and counterions during unfolding present two important factors that determines the stability of proteins in aqueous solution to a large extend. Both are modified by the added solute. Hence, a quantitative treatment of the effect of ions and water is a necessary prerequisite for a quantitative evaluation of data related to the unfolding of proteins in presence of various solutes. In a recent paper we have presented a unified approach for the free energy of complex formation between proteins and polyelectrolytes that comprises both effects.34 Temperature T and salt concentration cs were identified as the decisive variables and a closed expression for the free energy ΔGb(T,cs) of complex formation could be derived. In this model counterion release was characterized by Δnci denoting the net number of released ions during binding whereas hydration was described in terms of the parameter Δw defined already in early expositions of the problem1,43,44 and used frequently to describe the effect of hydration on complex formation.44–49 Central for the development of this model is the fact that mixed derivatives of the binding enthalpy ΔHb(T,cs) with regard to T and cs must be the same. Hence, this Maxwell-relation leads to prediction that the dependence of ΔHb(T,cs) on cs gives directly the dependence of Δw on temperature. The model thus derived is capable of describing the weak dependence of ΔGb(T,cs) on temperature which in turn leads to a strong compensation of enthalpy and entropy.34 Moreover, the values obtained for Δnci and Δw obtained by the present model for the denaturation of a given protein can directly be compared to data deriving from studies of complex formation of polyelectrolytes with proteins.33,46,47,50,51
Based on this model we here present a phenomenological approach to unfolding transitions of proteins that are partially charged. A closed expression for the free energy of unfolding will be presented that contains both the effect of electrostatics as well as of hydration. The consequences of the model for data evaluation will be discussed and exemplified using recent experimental data.16,18 The entire discussion presented here aims at a systematic analysis of experimental data obtained on polymeric unfolding transitions of various systems in aqueous phase.
Theory
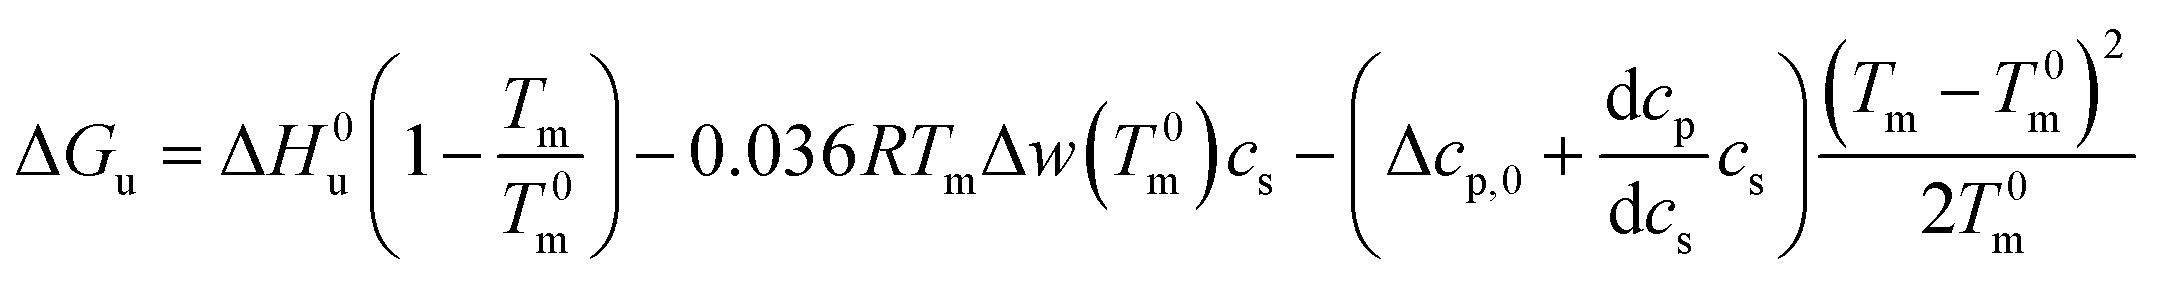
We consider the transition of a single chain of a polypeptide from a folded to an unfolded state in sufficiently dilute solution. In each stage of this transition the unfolded state is in equilibrium with the still folded part of the chain. This two-state mechanism is well-established for a great number of systems (see the discussion of this point in ref. 1, 16 and 18). Experimentally, the unfolding transition can be monitored e.g. by measurements of the circular dichroism leading to a fraction α of unfolded protein. The equilibrium constant Ku for the process of unfolding is related to α by
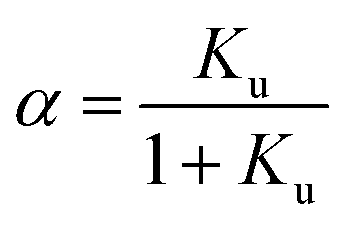 | (1) |
|
ΔGu = −RTlnKu
| (2) |
The basic thermodynamic analysis ΔGu was already discussed a long time ago by Record, Anderson, and Lohman.1 In general, the change of the equilibrium constant Ku with the activity a± of an added salt is given by
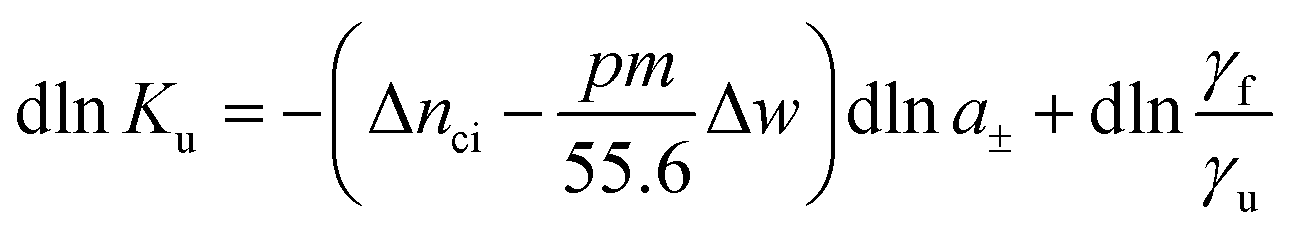 | (3) |
 | (4) |
Hence, the salt concentration cs is the variable on which the subsequent thermodynamic analysis is based. With the standard thermodynamic relation (∂lnKb/∂T)cs = ΔHb/RT2 we obtain the differential of lnKu for monovalent ions
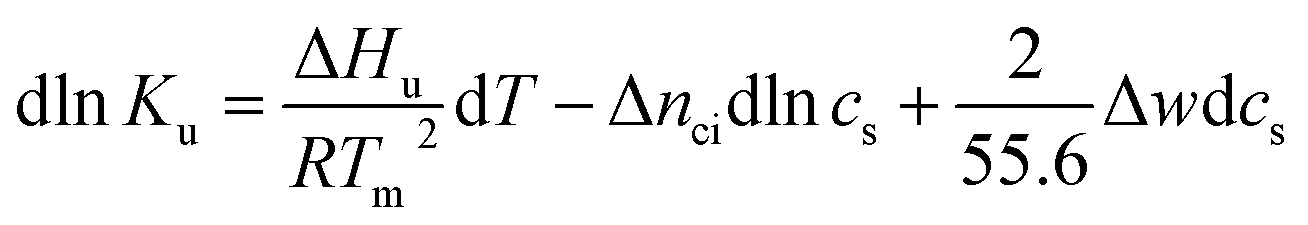 | (5) |
There is abundant experimental evidence that the parameter Δnci is independent of temperature.32,34,35,37,52–54 It is therefore safe to disregard the dependence of this parameter on Tm. With this assumption and
 | (6) |
 | (7) |
This relation demonstrates that the salt dependence of transition enthalpy is directly related to the dependence of the parameter Δw on temperature. As already lined out previously,34 this relation can now be used to calculate Δw as the function of temperature. In general, the transition enthalpy ΔHu as the function of the melting temperature Tm and cs can be rendered as34
 | (8) |
 | (9) |
Integration leads to34
 | (10) |
As already discussed previously,34 Δw can be interpreted in terms of the solute partitioning model as follows. Both the polyelectrolyte as well as the protein are hydrated in aqueous solution. During the unfolding a certain number Δnw of water molecules of both reactants is taken up or released. Furthermore, it is assumed that there is a partitioning of the ions between the bulk solution and the hydration water on the surface of the protein described by the partition coefficient Kp,+ = (mloc+/mbulk+) for the cations where mloc+ denotes the molality of the cations in the hydrated shell whereas mbulk+ is the respective quantity in bulk. The partition coefficient Kp,− of the anions is defined in the same way. With these definitions, Δw can be rendered by34
 | (11) |
Evidently, the quantity Δw measures the effect of water release on the free energy of unfolding and should not be confused with the total number Δnw taken up or released during unfolding. For an equal distribution of the ions between the hydrate and the bulk phase, this contribution will vanish.
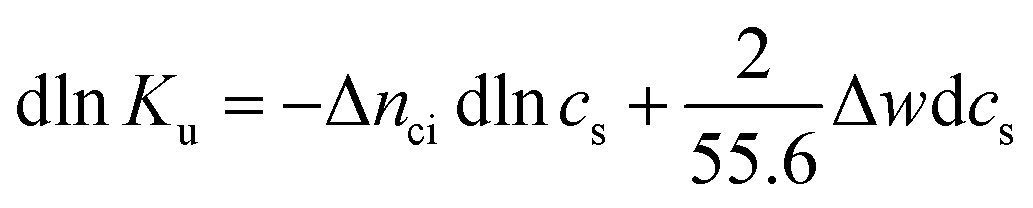
In the following, we first consider uncharged systems, that is, Δnci = 0. Integration of eqn (6) at constant temperature then leads to
|
lnKu = lnK0u + 0.036Δwcs
| (12) |
| ΔGu = ΔG0u − 0.036RTmΔwcs | (13) |
 | (14) |
In many cases the difference Tm − T0m does not exceed 10 degrees so that the last term in eqn (14) can be expanded to yield (see the derivation of eqn (11) of ref. 55)
 | (15) |
Eqn (14) may be used to calculate the m-value defined as the derivative of the free energy with regard to solute concentration at constant temperature
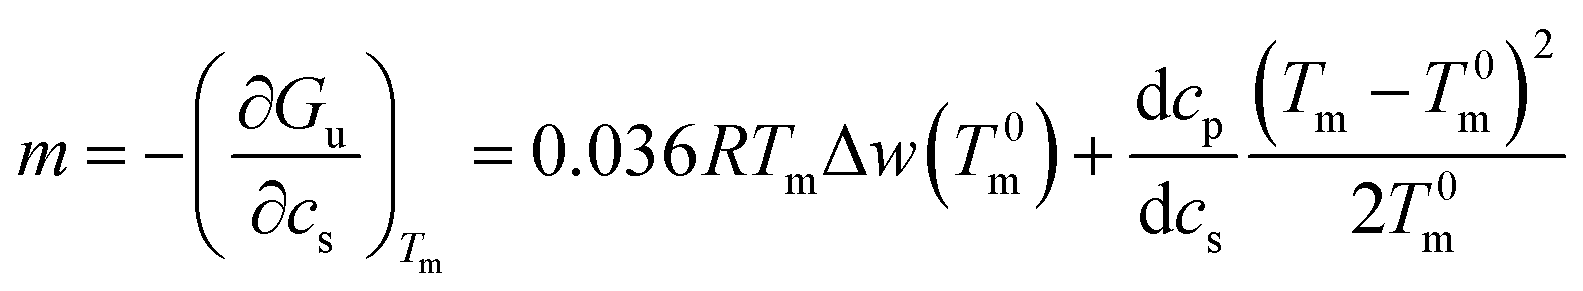 | (16) |
This expression shows that m is given by a constant plus a term that depends quadratically on Tm − T0m. For small temperature differences the second term will be small and the m-value is a constant in good approximation. However, it should be noted that m is in general a quantity that depends explicitly on temperature.
Eqn (14) and (15) contain only the dependence of the free energy on cs. The quantity ΔG0u for salt- or solute-free solutions can be derived following the prescription of Chen and Schellman:6 the specific heat Δcp,0 measured in solute-free systems can be regarded as a constant throughout the rather small temperature range under consideration here. Thus, for solute-free systems we obtain
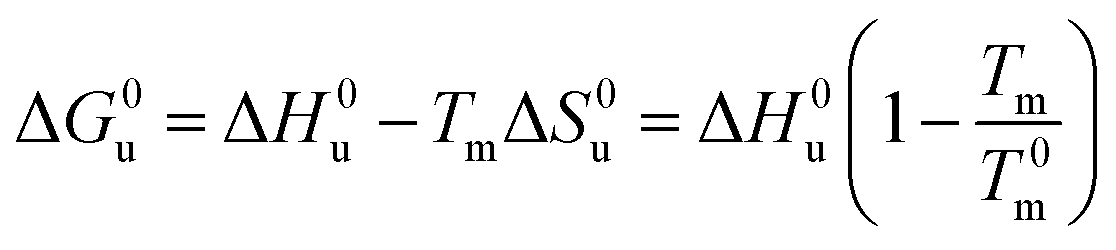 | (17) |
| ΔH0u(Tm) + Δcp,0(Tm − T0m) | (18) |
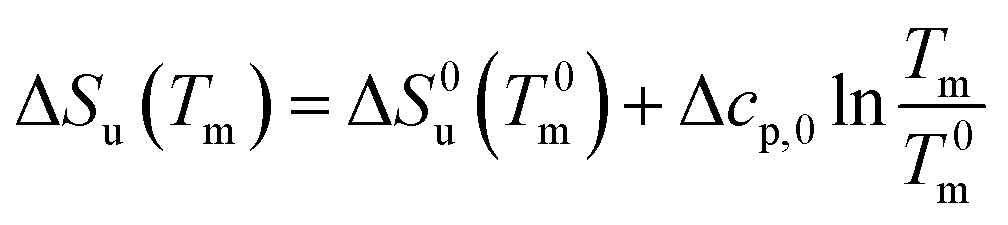 | (19) |
 | (20) |
Combination with eqn (14) then leads to
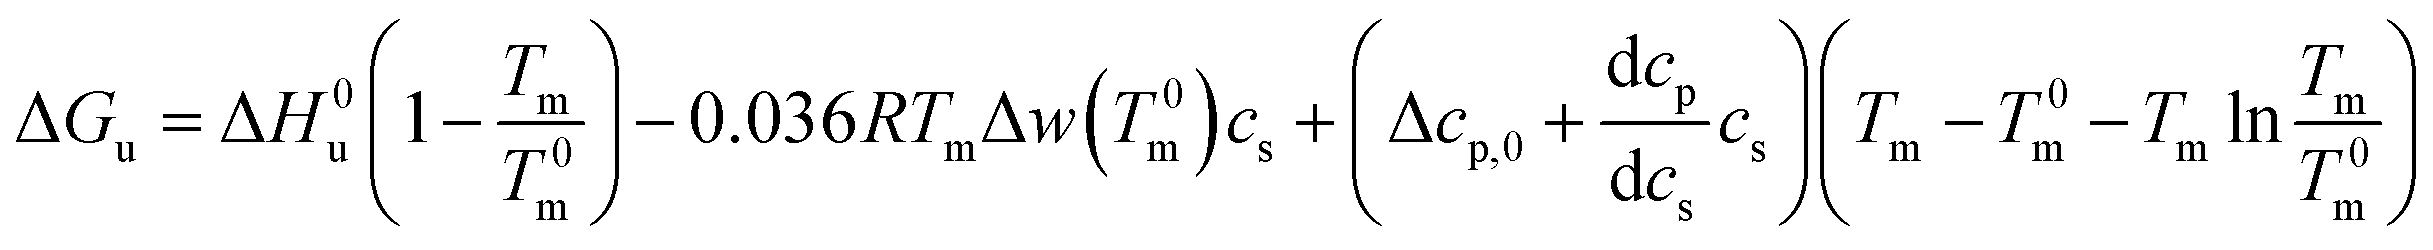 | (21) |
For Tm − T0m ≤ 10 K this expression can be approximated by
 | (22) |
Eqn (21) and (22) are the final result for the free energy of unfolding for uncharged systems.
For partially charged proteins eqn (5) shows that a term scaling with lncs must be added to eqn (21).1 Here it must be kept in mind that there is always a small but finite salt concentration cs,0 so that the integration of eqn (5) must start at this concentration. Keeping in mind that Δnci does not depend on temperature we immediately obtain from eqn (22)
 | (23) |
In many cases the concentration c0s is small and can be disregarded in eqn (23) except for the last term, of course. Eqn (23) also shows that for small concentrations c0s the free energy of unfolding may contain an appreciable contribution originating from the release or uptake of ions during denaturation. Hence, ΔGu will be dominated by the last term for small cs. The respective transition enthalpy is given by eqn (8) where cs is replaced by cs − cs,0. The transition entropy follows as
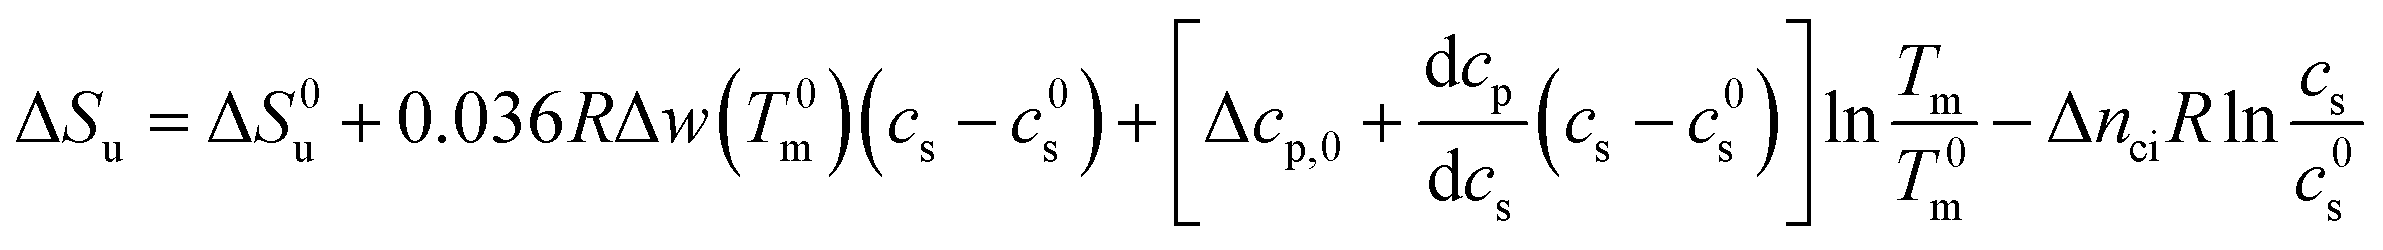 | (24) |
In many cases it is only possible to deduct the change of the free energy of unfolding with increasing solute concentration. Thus, we require the quantity ΔΔGu which gives the change of ΔGu with cs calculated for the transition temperature T0m in solute-free solution:
 | (25) |
It is interesting to compare eqn (21) and (23) to phenomenological approach of Chen and Schellman6 (cf. also ref. 41). The generalized van't Hoff equation used by these authors is based on eqn (17)–(19). Moreover, the dependence of the free energy of unfolding is assumed to be linear in cs as derived above in eqn (13):
| ΔGu(cs) = ΔG0u − RTmΔβ23cs | (26) |
Thus, the coefficient Δβ23 is identical to 0.036Δw in eqn (13). In the linear model of Chen and Schellman,6 this linear dependence has be deduced from experiments whereas the above considerations leading to eqn (13) demonstrate that this relation is a direct consequence of eqn (1). Based on these premises Chen and Schellman formulate lnKu as follows in the present notation as:6
 | (27) |
The experimental data are described in terms of 3 adjustable parameters: (i) Δw(T0m) which is closely related to the classical m-value through eqn (15); (ii) the specific heat Δcp,0 in absence of solutes; and (iii) the parameter dcp/dcs describing the dependence of Δcp on cs. This parameter has been introduced by Chen and Schellman as well (the parameter  in eqn (8) and (9) of ref. 6) but not used further. Its application to complex formation of polyelectrolytes with proteins has been discussed recently.34 The first two parameters are directly measurable and have an obvious physical meaning. The newly introduced parameter dcp/dcs describes the dependence of hydration effects on temperature.
A comprehensive phenomenological analysis of the denaturation temperature for uncharged polymers was presented some time ago by Heyda and Dzubiella.29 Here, the hydration effects are described in terms of the preferential interaction parameter ΔΓ23. If this parameter does not depend on cs, it follows directly that

 is defined as the preferential interaction parameter independent of cs. The analysis of the changes effected by kosmotropic salts showed indeed that this equation provides a very good approximation of the experimental data obtained for the collapse transition of PNIPAM-chains in aqueous solution.26,29 Thus, these data could be compared directly to the prediction of the SPM with moderate success (cf. Table 3 of ref. 29). Moreover, Heyda and Dzubiella could estimate the entropic limit of the preferential interaction parameter
  resulting for a total exclusion of the kosmotropic ions from the surface of the unfolded protein. In this case
  ≅ −ΔV with ΔV being the change of the volume inaccessible for kosmotropic ions upon unfolding the protein. This parameter can be estimated from the change of the solvent accessible surface area (SASA) effected by unfolding and a length parameter l (∼ 0.1 nm) describing the thickness of the layer inaccessible for the ions. The estimate of the m-value derived from this calculation compares favorably with the measured values (cf. Table 3 of ref. 29). In this limit, the m-value (see eqn (16)) becomes independent of temperature and the Kp,± as defined through eqn (11) are much smaller than unity. If, on the other hand, the Kp,± are approximately unity, the m-value will be small but exhibit a considerable dependence on temperature (cf. eqn (11)). In this situation the dependence of the free energy of unfolding should depend quadratically on ΔTm which has been found previously for the complex formation of polyelectrolytes with proteins.34 It should be kept in mind, that these considerations disregard the counterion release term in eqn (23). The m-value observed for charged systems where Δnci ≠ 0, will differ considerably and the predictions of the SPM are related only to the parameter Δw as defined through eqn (10).
In principle, eqn (23) and eqn (26) define stability curves as defined by Becktel and Schellman3 inasmuch as they describe the free energy ΔGu as the function of temperature and salt concentration. If Δcp,0 may be regarded as constant throughout a temperature range of sufficient width, the present approach could be used to construct ΔGu(T,cs) for all pertinent temperatures ranging from cold to thermal denaturation. Given the fact, however, that Δcp,0 depends on temperature,7 such stability curves should be regarded with caution.
Results and discussion
Basic predictions of the model
The basis of the present model is eqn (5) which is general except for the neglect of the activity coefficients of the solute. Previous discussions, however, have shown that this approximation is inconsequential and will only change slightly the resulting parameters.4,33,34 Eqn (5) or its integrated from has been used very often to analyze the release of water upon complex formation of highly charged macromolecules as e.g. DNA with various proteins.33,46,47,50,51 It is thus interesting to compare its magnitude for complex formation with values deriving from protein unfolding. Evidently, the parameter Δw introduced by this equation does not give the number of released water molecules defined as Δnw but measures the thermodynamic effect of this release (see the discussion of eqn (11) above).34A next prerequisite is the independence of Δnci on temperature. As already mentioned above, this fact is well-borne out of a large bulk of experimental data and can safely be assumed here as well (see e.g. the discussion by Privalov et al.32 and in ref. 34, 37 and 52–54). This fact allows us to use the Maxwell-relation eqn (7) for the next step in which the salt dependence of the unfolding enthalpy ΔHu is related to the dependence of the parameterΔw on temperature given through eqn (9). Hence, if ΔHu turns out to depend on the concentration cs of the solute, it necessarily follows that Δw is not a constant but depends on temperature. This fact is one of the central points inasmuch it shows that in this case the m-value given here by eqn (16) contains a term depending quadratically on the difference Tm − T0m.
The above model hence makes the following predictions that can compared directly to experiments:
(1) In a first step of the analysis of experimental data, dependence of ΔHu on salt concentration cs can be checked. Eqn (8) demonstrates that this quantity is a function of temperature and salt concentration cs. Moreover, the dependence of ΔHu on salt concentration cs gives the dependence of the quantity Δw on temperature as shown by the Maxwell-relation in eqn (7) which in turn leads to the dependence of the m-value on temperature eqn (16). Evidently, if ΔHu is found to depend on salt concentration, there must be a finite dependence of m on temperature as well (eqn (16)). If, on the other hand, the dependence of ΔHu on salt concentration cs is small, the parameter dcp/dcs ≅ 0 and the terms in eqn (23) and (25) depend only on Tm, that is, the quadratic term can be dismissed. Hence, the evaluation of experimental data can begin by a critical check of ΔHu(T,cs).
(2) The term scaling with lncs will profoundly change the dependence of the free energy on salt concentration and this dependence will be most marked for small cs (cf. eqn (6)). The dependence of Tm on cs will therefore be non-linear at small cs if Δnci assumes a finite value. Since the effect embodied in this parameter is of entirely entropic origin, the non-linear dependence on cs thus effected should be independent of the nature of the added salt of same valency, that is, Tm should be a universal function of cs for small cs. Hofmeister effects are expected to come into play only for higher salt concentrations where ΔΔGu scales linearly with cs. Hence, Tm is expected to be independent on the nature of the salt ions if the salt concentration is small. The observation of this effect, however, requires a small cs,0 and precise measurements at concentrations only slightly larger than cs,0. Evidently, the ionic effect embodied in Δnci and the change of Tm by hydration may cancel each other. Thus, if Δnci < 0 as well as Δw < 0, eqn (23) demonstrates that can lead to ΔTm = 0 for a finite salt concentration. This problem has already been discussed by Chudoba et al.30 and is seen directly in the study of the unfolding of RNase A.16 Similar observations have also been made for thermophilic proteins.56,57 The present theory allows us to model this effect in terms of the parameters Δnci and Δw.
(3) If the term quadratic in eqn (23) and (25) can be disregarded, that is, for small ΔT, the combination of both expressions shows that in this case
 | (28) |
Evaluation of data
Thus, the evaluation of the experimental data should proceed in the following steps: The unfolding is usually determined by microcalorimetric studies in which the heat change during this process is measured precisely. These measurements yield the heat of transition ΔHu(cs) at different concentrations of the solute cs and the melting temperature Tm at the respective salt concentration cs (see e.g. the discussion in ref. 15 and 18). In the following, the comprehensive set of data of Francisco et al.18 on the unfolding of ribonuclease A in presence of sodium salts will be used to exemplify the steps of evaluation. Here, the unfolding of RNase A has been observed at a pH of 4 in 10 mM acetate buffer. Therefore, the concentration cs,0 = 0.01 M in the subsequent analysis.As outlined above, the analysis may start by the check of the dependence of ΔHu on cs (see Table 1 of ref. 18). Fig. 1a displays ΔHu(cs) for a typical kosmotropic salt as NaCl as well as for NaSCN which provides a good example for a chaotropic system. The enthalpy of denaturation in presence of NaCl hardly depends on salt concentration whereas a marked dependence is found for NaSCN. This test splits up the experimental data sets into two classes:
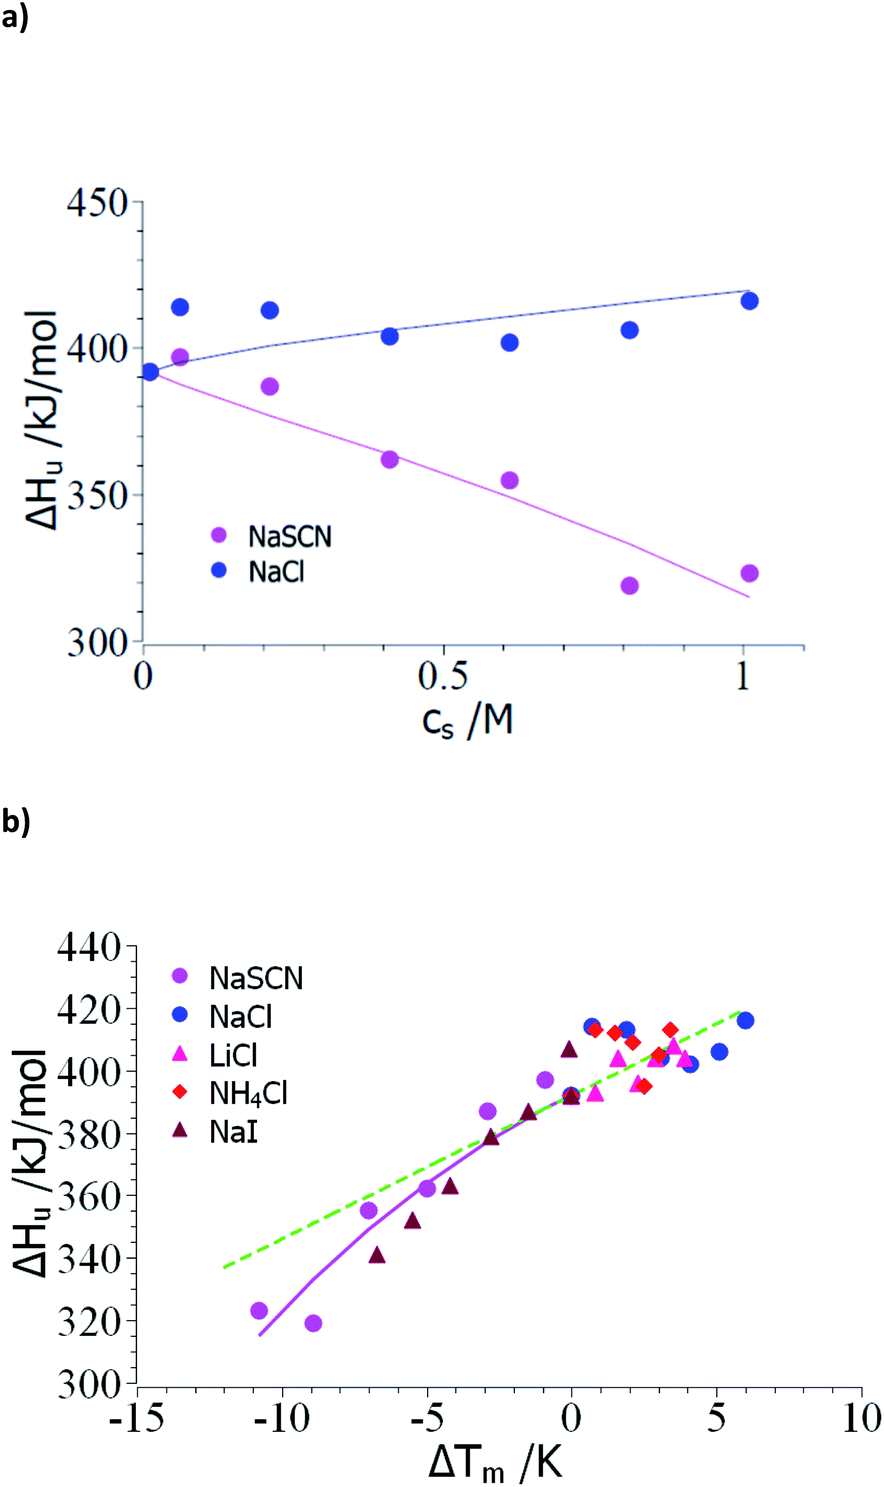 | ||
| Fig. 1 Evaluation of the measured transition enthalpy ΔHu by eqn (8). (a) ΔHu as the function of salt concentration cs. The marks show the experimental data for the unfolding of ribonuclease in presence of the salts indicated in the graph. These data have been taken from Table 1 of Francisco et al.18 (b) ΔHu as the function of ΔTm = Tm − T0m. The solid lines indicate the fit of eqn (8) whereas the green dashed line indicates the transition enthalpy calculated by eqn (8) with the average value Δcp,0 ≅ 4.6 kJ (K−1 mol−1) and dΔcp/dcs = 0. See text for further explanation. | ||
(1) Small ΔTm; kosmotropic ions: the small dependence of ΔHu on cs suggests that the coefficient dΔcp/dcs in eqn (15), (23) and (25) can be safely neglected and the only relevant parameters are Δnci and Δw(T0m). Moreover, the changes ΔT = Tm − T0m are rather small so the term quadratic in ΔT in eqn (23) can hardly be determined. However, this does not imply that this term is zero for kosmotropic salts in general.
(2) Large ΔT; chaotropic ions: for NaSCN there is a marked dependence of ΔHu(cs) on salt concentration which immediately demonstrates that dΔcp/dcs assumes a finite value and the m-value (eqn (16)) in turn depends on temperature. Moreover, the observed ΔT is much larger than in case of the kosmotropic ions. Hence, fits must take into account all terms in eqn (25).
Case (1): small ΔTm; kosmotropic ions: Fig. 1b gathers all data of the enthalpy ΔHu as the function of the difference Tm − T0m. The error of these numbers is of appreciable magnitude and only allows us to obtain an estimate for Δcp,0 for which an evaluation for the data of all kosmotropic ions (NaCl, NH4Cl, LiCl) gives an estimate Δcp,0 ≅ 4.6 kJ (K−1 mol−1) which compares well literature (see ref. 7 and 58). Hence, the subsequent evaluation is based on dΔcp/dcs = 0.
Fig. 2 displays a comparison of the experimental transition temperatures Tm as the function of salt concentration obtained by numerical solution of eqn (23) for ΔGu = 0. Here the data Tm(cs) obtained for a given salt are fitted to eqn (23) with neglect of the term quadratic in ΔT using the MathLab routine cftool (MATLAB (2021b). Natick, Massachusetts: The MathWorks Inc.). All calculations have been done using the value of the transition enthalpy in salt-free systems ΔH0u = 392 kJ mol−1 and the transition temperature T0m = 326.8 K given by Francisco et al.18 As mentioned above, the buffer added to all solutions leads to a cs,0 = 0.01 M.18 The solid lines in Fig. 2 display the respective fits whereas Table 1 gathers the respective fit parameters. A single value of parameter Δnci turned out to describe ΔGu for all systems under consideration here in agreement with the above general considerations. This fact has already been observed by Francisco et al.18 and the presence analysis compares well with eqn (21) of ref. 18 inasmuch Tm can be described by the combination of a linear and a logarithmic term (see eqn (23)). Pegram et al. also found that a single parameter was sufficient to describe the dependence of the unfolding of DNA as well as for the DNA-binding domain of the lac repressor at small salt concentrations.31 Hence, an important prediction of the present model is fully corroborated by the experimental data and the parameter Δw(T0m) can be compared to data obtained for complex formation of polyelectrolytes with proteins.
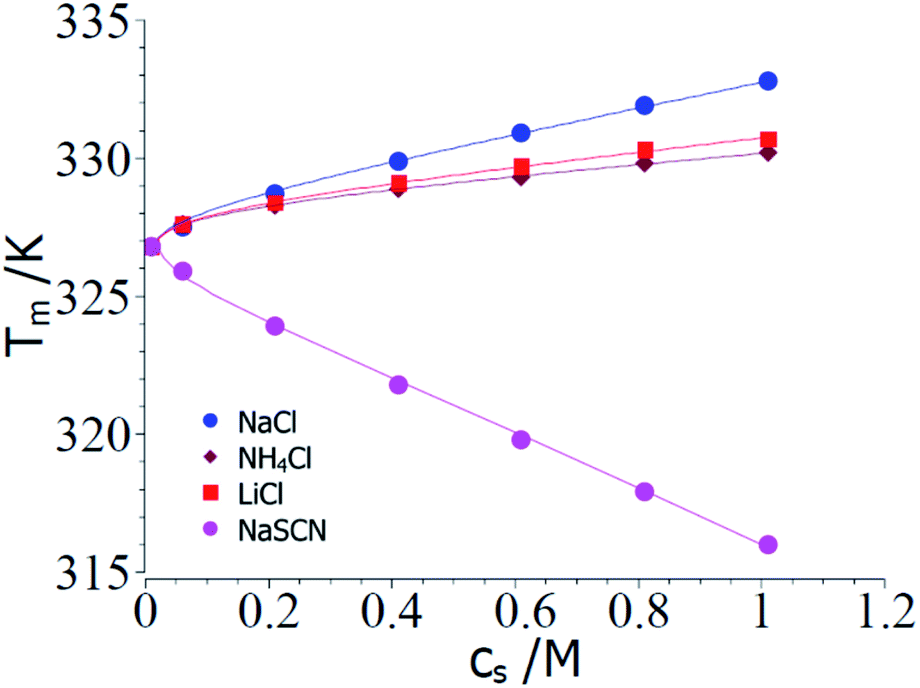 | ||
| Fig. 2 Comparison of theory and experimental data taken from the denaturation of RNase A for the 3 kosmotropic salt NaCl, NH4Cl, LiCl and for the chaotropic salt NaSCN.18 The points show the transition temperatures taken in presence of different salts as indicated in the graph (see Table 1 of ref. 18). The solid lines mark the calculated transition temperatures Tm calculated from the fit parameters Δnci and Δw(T0m) (cf. Table 1). See text for further explanation. | ||
| System | Δnci | Δw(T0m) | dΔcp/dcs |
|---|---|---|---|
| a Δnci: number of ions released or taken up during unfolding (eqn (3) and (4)); Δw: effect of water release or uptake (eqn (3) and (4)); dΔcp/dcs: parameter describing the dependence of Δw on temperature (eqn (8) and (10)). | |||
| NaCl | 0.17 | −50.4 | 0 |
| LiCl | 0.17 | −26.2 | 0 |
| NH4Cl | 0.17 | −19.4 | 0 |
| NaSCN | −0.17 | 103 | 2.5 |
The parameter Δnci is positive for all kosmotropic salt analyzed herein. This finding points to the fact that a small but finite number of ions attached closely to the surface of the protein is released during the unfolding transition. With increasing cs these ions are released into a reservoir with increasing activity which requires additional free energy during the unfolding transition. Hence, this effect stabilizes the folded state and leads to a higher transition temperature.
The parameter Δw(T0m) is negative which means that the water molecules needed for the hydration of the unfolded protein must have a higher activity as the bulk water since addition of these salts increases the magnitude of ΔGu. Hence, free energy is needed to transport water from a state of lower activity in bulk to a state of higher activity in the hydrate shell upon unfolding of the protein. This effect is due to a partial depletion of these kosmotropic ions from the hydrate shell of the protein and leads to a stabilization of the folded state. The magnitude of Δw(T0m) found here is in the same range as found previously for complex formation of proteins with DNA.47
It should be noted that the present analysis not only treats ΔGu but also ΔHu at the same time. Thus, the independence of the m-value of temperature follows here from an analysis of the latter quantity. Only this analysis allows us to disregard the term in eqn (25) that depends quadratically on ΔT2.
Case (2): large ΔT; chaotropic ions: in the following, the evaluation of the respective parameters will be shown using the data for NaSCN (Table 1 of ref. 18). Fig. 1b shows experimental ΔHu(cs) as the function of ΔTm whereas the solid lines displays the fit of these data according to eqn (8). This fit can be stabilized by using the experimental value ΔHu(cs = 0) = 392 kJ mol−1 and the specific heat Δcp,0 = 4.6 kJ (K−1 mol−1) estimated from the analysis of the kosmotropic systems shown in Fig. 1a. For NaSCN we obtain for the parameter dΔcp/dcs a value of ca. 2.5 kJ (K−1 mol−1 M−1). Evidently, the small range of data and the finite accuracy of the data allows for an estimate of these quantities only. However, since these parameters present only corrections in eqn (25) and (23) and not leading terms, this error is inconsequential for the purpose at hand.
In the next step, the parameters Δcp,0 = 4.6 kJ (K−1 mol−1) and dΔcp/dcs = 2.5 kJ (K−1 mol−1 M−1) are introduced into eqn (23) and the values of Δnci and Δw(T0m) are derived from a numerical solution of this equation for ΔGu = 0. Input parameters are the measured Tm measured for different NaSCN-concentrations marked by points in Fig. 2. Table 1 again gathers the data obtained from this fit whereas the solid lines in Fig. 2 displays Tm calculated with the parameters Δcp,0 = 4.6 kJ (K−1 mol−1), dΔcp/dcs = 2.5 kJ (K−1 mol−1 M−1) and the values of Δnci and Δw(T0m). Again, a full description of the experimental transition temperatures is achieved. For the chaotropic salt NaSCN the parameter Δw(T0m) assumes a positive value which is directly related to the fact that SCN−-ions are adsorbed on the unfolded protein chain thus lowering the activity of the hydrate water molecules. Hence, free energy is gained when hydrating the unfolded chain by bulk water having a higher activity. The parameter Δnci now has assumed a negative value. This finding points to a much stronger interaction of such chaotropic ions with the unfolded protein chains. Thus, Fang and Furo could show that chaotropic ions can associate to PNIPAM chains with a Langmuir-type association behavior while NaCl is only weakly adsorbed.59 This effect measured through careful measurements of the electrophoretic mobility was found strongest for SCN−-ions. Hence, adsorption of chaotropic ions can diminish or even reverse the effective charge of unfolded proteins. However, further investigations of Tm at very low ion concentrations are needed to clarify this problem.
As mentioned above, the combination of a negative Δnci with a negative Δw value should lead to a non-monotonic dependence of Tm on salt concentration. This effect is seen in a careful study of the unfolding of RNase A in NaCl solutions by Senske et al.16 These data have been taken using a 50 mM citrate buffer at pH = 5 and are hence not directly comparable to the data of Francisco et al.18 discussed above. Fig. 3 displays the data obtained for solutions with varying concentration of NaCl. Since the range of temperature is rather small, the term quadratic in ΔT in eqn (23) can be disregarded. The fit of the data is shown by the solid line in Fig. 3 and leads to Δnci = −0.60 and Δw = −31.7. At small salt concentrations, the logarithmic term in eqn (23) dominates the transition temperature. In this regime, it stabilizes the unfolded state which takes up ions from solution more easily at higher salt concentration. At higher salt concentration, the term linear in salt concentration in eqn (23) takes over and the unfolded state is now destabilized leading to a higher Tm again.
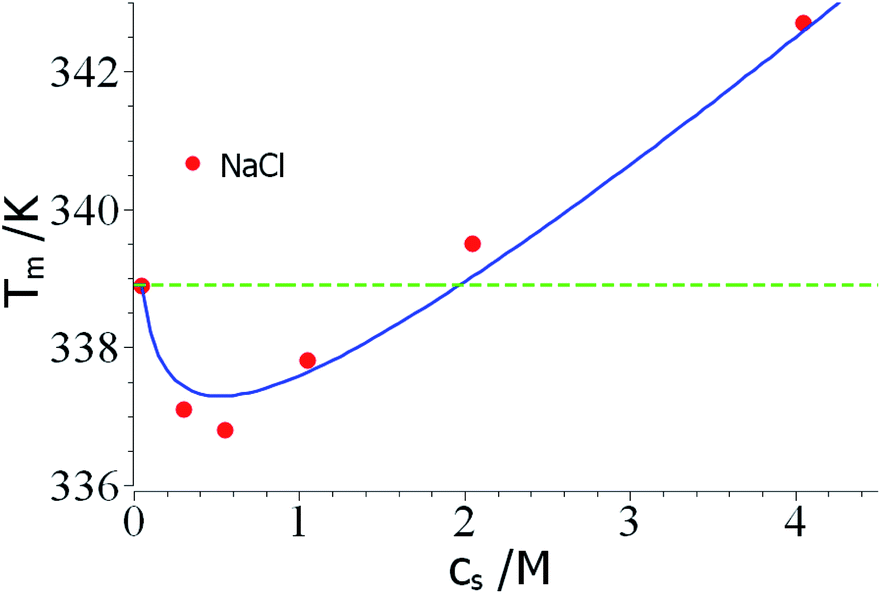 | ||
| Fig. 3 Reversal of Tm through a competition of counterion release and preferential hydration. The data marked by red points have been measured by Senske et al. for the unfolding of RNase A at pH = 5 in presence of an increasing concentration of NaCl.16 The solid line marks the fit by theory with the parameters Δnci = −0.60 and Δw = −31.7 (eqn (23), the term quadratic in ΔT has been neglected). The green dashed line marks the temperature T0m. See text for further explanation. | ||
Conclusions
A phenomenological model describing the unfolding transition of proteins has been presented. Within this model, the change of Tm with the solute concentration cs is captured by two effects: (i) the change of the number of correlated counterions Δnci during the unfolding transition, and (ii) the change of hydration expressed through the parameter Δw. The latter parameter is not directly the number of water molecules released or taken up during transition but described the change of the free energy by the release or uptake of water (see the discussion of eqn (11)). The model can be cast in terms of the closed expression eqn (23) giving the free energy of unfolding in terms of the salt/solute concentration cs. The enthalpy ΔHu can directly be related to the parameter Δw by the Maxwell-relation eqn (7) leading to eqn (8) in which a new parameter dΔcp/dcs describes the direct dependence of ΔHu on salt concentration. The model allows us to discuss the classical m-value in terms of these parameters (eqn (16)) and predicts that m is depending on temperature if the parameter dΔcp/dcs assumes a finite value. A first comparison with experimental data taken from literature shows the general validity of the model.Conflicts of interest
There are no conflicts to declare.Acknowledgements
Funding by the Deutsche Forschungsgemeinschaft (DFG, German Research Foundation) – 434130070, International Training and Research College 2662 “Charging into the Future”, is gratefully acknowledged.References
- M. T. Record Jr, C. F. Anderson and T. M. Lohman, Q. Rev. Biophys., 1978, 11, 103–178 CrossRef CAS PubMed.
- P. L. Privalov, Biophys. J., 1990, 57, A26 Search PubMed.
- W. J. Becktel and J. A. Schellman, Biopolymers, 1987, 26, 1859–1877 CrossRef CAS PubMed.
- J. A. Schellman, Annu. Rev. Biophys. Bioeng., 1987, 16, 115–137 CrossRef CAS PubMed.
- J. A. Schellman, Q. Rev. Biophys., 2005, 38, 351–361 CrossRef CAS PubMed.
- B. L. Chen and J. A. Schellman, Biochemistry, 1989, 28, 685–691 CrossRef CAS PubMed.
- G. I. Makhatadze and P. L. Privalov, Adv. Protein Chem., 1995, 47, 307–425 CrossRef CAS PubMed.
- P. Von Hippel and T. Schleich, Acc. Chem. Res., 1969, 2, 257–265 CrossRef CAS.
- B. L. Chen, W. A. Baase and J. A. Schellman, Biochemistry, 1989, 28, 691–699 CrossRef CAS PubMed.
- G. I. Makhatadze, G. M. Clore, A. M. Gronenborn and P. L. Privalov, Biochemistry, 1994, 33, 9327–9332 CrossRef CAS PubMed.
- G. I. Makhatadze and P. L. Privalov, Biophys. J., 1993, 64, A177 Search PubMed.
- G. I. Makhatadze and P. L. Privalov, J. Mol. Biol., 1992, 226, 491–505 CrossRef CAS PubMed.
- P. L. Privalov, J. Solution Chem., 2015, 44, 1141–1161 CrossRef CAS.
- P. L. Privalov, Pure Appl. Chem., 2007, 79, 1445–1462 CrossRef CAS.
- M. Senske, D. C. Aruxandei, M. Havenith, H. Weingartner, C. Herrmann and S. Ebbinghaus, Biophys. J., 2016, 110, 212a CrossRef.
- M. Senske, D. Constantinescu-Aruxandei, M. Havenith, C. Herrmann, H. Weingartner and S. Ebbinghaus, Phys. Chem. Chem. Phys., 2016, 18, 29698–29708 RSC.
- M. Erlkamp, J. Marion, N. Martinez, C. Czeslik, J. Peters and R. Winter, J. Phys. Chem. B, 2015, 119, 4842–4848 CrossRef CAS PubMed.
- O. A. Francisco, C. J. Clark, H. M. Glor and M. Khajehpour, RSC Adv., 2019, 9, 3416–3428 RSC.
- K. T. Naidu, D. K. Rao and N. P. Prabhu, J. Phys. Chem. B, 2020, 124, 10077–10088 CrossRef CAS PubMed.
- K. Lindorff-Larsen and K. Teilum, Protein Eng., Des. Sel., 2021, 34, 1–13 CrossRef CAS PubMed.
- H. I. Okur, J. Hladilkova, K. B. Rembert, Y. Cho, J. Heyda, J. Dzubiella, P. S. Cremer and P. Jungwirth, J. Phys. Chem. B, 2017, 121, 1997–2014 CrossRef CAS PubMed.
- M. T. Record, E. Guinn, L. Pegram and M. Capp, Faraday Discuss., 2013, 160, 9–44 RSC.
- Y. J. Zhang and P. S. Cremer, Annu. Rev. Phys. Chem., 2010, 61, 63–83 CrossRef CAS PubMed.
- X. Tadeo, B. Lopez-Mendez, D. Castano, T. Trigueros and O. Millet, Biophys. J., 2009, 97, 2595–2603 CrossRef CAS PubMed.
- S. Furyk, Y. J. Zhang, D. Ortiz-Acosta, P. S. Cremer and D. E. Bergbreiter, J. Polym. Sci., Part A: Polym. Chem., 2006, 44, 1492–1501 CrossRef CAS.
- Y. Zhang, S. Furyk, L. B. Sagle, Y. Cho, D. E. Bergbreiter and P. S. Cremer, J. Phys. Chem. C, 2007, 111, 8916–8924 CrossRef CAS PubMed.
- Y. J. Zhang, S. Furyk, D. E. Bergbreiter and P. S. Cremer, J. Am. Chem. Soc., 2005, 127, 14505–14510 CrossRef CAS PubMed.
- E. E. Bruce, P. T. Bui, M. R. Cao, P. S. Cremer and N. F. A. van der Vegt, J. Phys. Chem. B, 2021, 125, 680–688 CrossRef CAS PubMed.
- J. Heyda and J. Dzubiella, J. Phys. Chem. B, 2014, 118, 10979–10988 CrossRef CAS PubMed.
- R. Chudoba, J. Heyda and J. Dzubiella, Soft Matter, 2018, 14, 9631–9642 RSC.
- L. M. Pegram, T. Wendorff, R. Erdmann, I. Shkel, D. Bellissimo, D. J. Felitsky and M. T. Record, Proc. Natl. Acad. Sci. U. S. A., 2010, 107, 7716–7721 CrossRef CAS PubMed.
- P. L. Privalov, A. I. Dragan and C. Crane-Robinson, Nucleic Acids Res., 2011, 39, 2483–2491 CrossRef CAS PubMed.
- X. Xu, S. Angioletti-Uberti, Y. Lu, J. Dzubiella and M. Ballauff, Langmuir, 2019, 35, 5373–5391 CrossRef CAS PubMed.
- J. J. Walkowiak and M. Ballauff, Adv. Sci., 2021, 8, 2100661 CrossRef CAS PubMed.
- A. I. Dragan, C. M. Read and C. Crane-Robinson, Eur. Biophys. J., 2017, 46, 301–308 CrossRef CAS PubMed.
- Q. Ran, X. Xu, P. Dey, S. Yu, Y. Lu, J. Dzubiella, R. Haag and M. Ballauff, J. Chem. Phys., 2018, 149, 163324 CrossRef PubMed.
- J. J. Walkowiak, M. Ballauff, R. Zimmermann, U. Freudenberg and C. Werner, Biomacromolecules, 2020, 21, 4615–4625 CrossRef CAS PubMed.
- E. S. Courtenay, M. W. Capp, R. M. Saecker and M. T. Record, Proteins, 2000, 72–85 CrossRef CAS.
- M. W. Capp, L. M. Pegram, R. M. Saecker, M. Kratz, D. Riccardi, T. Wendorff, J. G. Cannon and M. T. Record, Biochemistry, 2009, 48, 10372–10379 CrossRef CAS PubMed.
- L. Pegram and M. T. Record, Biophys. J., 2009, 96, 602a CrossRef.
- J. A. Schellman, Biopolymers, 1978, 17, 1305–1322 CrossRef CAS.
- A. Amsdr, N. D. Noudeh, L. T. Liu and T. V. Chalikian, J. Chem. Phys., 2019, 150, 215103 CrossRef PubMed.
- C. Tanford, J. Mol. Biol., 1969, 39, 539–544 CrossRef CAS PubMed.
- J. H. Ha, M. W. Capp, M. D. Hohenwalter, M. Baskerville and M. T. Record, J. Mol. Biol., 1992, 228, 252–264 CrossRef CAS PubMed.
- D. P. Mascotti and T. M. Lohman, Biochemistry, 1993, 32, 10568–10579 CrossRef CAS PubMed.
- S. Bergqvist, R. OBrien and J. E. Ladbury, Biochemistry, 2001, 40, 2419–2425 CrossRef CAS PubMed.
- S. Bergqvist, M. A. Williams, R. OBrien and J. E. Ladbury, Structure, 2002, 10, 629–637 CrossRef CAS PubMed.
- S. Bergqvist, M. A. Williams, R. OBrien and J. E. Ladbury, Biochem. Soc. Trans., 2003, 31, 677–680 CrossRef CAS PubMed.
- D. J. Deredge, J. T. Baker, K. Datta and V. J. LiCata, J. Mol. Biol., 2010, 401, 223–238 CrossRef CAS PubMed.
- D. P. Mascotti and T. M. Lohman, Biochemistry, 1995, 34, 2908–2915 CrossRef CAS PubMed.
- S. Bergqvist, M. A. Williams, R. OBrien and J. E. Ladbury, J. Mol. Biol., 2004, 336, 829–842 CrossRef CAS PubMed.
- X. Xu, Q. Ran, P. Dey, R. Nikam, R. Haag, M. Ballauff and J. Dzubiella, Biomacromolecules, 2018, 19, 409–416 CrossRef CAS PubMed.
- Q. Ran, X. Xu, J. Dzubiella, R. Haag and M. Ballauff, ACS Omega, 2018, 3, 9086–9095 CrossRef CAS PubMed.
- X. Xu and M. Ballauff, J. Phys. Chem. B, 2019, 123, 8222–8231 CrossRef CAS PubMed.
- J. Bukala, P. Yavvari, J. Walkowiak, M. Ballauff and M. Weinhart, Biomolecules, 2021, 11, 1377 CrossRef CAS PubMed.
- B. N. Dominy, D. Perl, F. X. Schmid and C. L. Brooks, J. Mol. Biol., 2002, 319, 541–554 CrossRef CAS PubMed.
- D. Perl and F. X. Schmid, ChemBioChem, 2002, 3, 39–44 CrossRef CAS PubMed.
- C. N. Pace, G. R. Grimsley, S. T. Thomas and G. I. Makhatadze, Protein Sci., 1999, 8, 1500–1504 CrossRef CAS PubMed.
- Y. Fang and I. Furo, J. Phys. Chem. B, 2021, 125, 3710–3716 CrossRef CAS PubMed.
| This journal is © The Royal Society of Chemistry 2022 |