
 Open Access Article
 This Open Access Article is licensed under a Creative Commons Attribution-Non Commercial 3.0 Unported Licence
A study on the viscosity reduction mechanism of high-filled silicone potting adhesive by the formation of Al2O3 clusters
Jing Wang,
Haihong Ma ,
Fengmei Ren,
Zhengfa Zhou* and
Weibing Xu
,
Fengmei Ren,
Zhengfa Zhou* and
Weibing Xu
School of Chemistry and Chemical Engineering, Hefei University of Technology, Hefei, 230009, People's Republic of China. E-mail: zhengfazhou@hfut.edu.cn; Tel: +86-551-62901455
First published on 30th March 2022
Abstract
Heat dissipation has become a key problem for highly integrated and miniaturized electronic components. High thermal conductivity, good flowability and low coefficient of linear thermal expansion (CLTE) are indispensable performance parameters in the field of electronic potting composite materials. In this study, spherical alumina (Al2O3) was surface modified by γ-(2,3-epoxypropoxy) propyltrimethoxy silane (KH560) and γ-aminopropyltriethoxy silane (KH550) and labelled as Al2O3-epoxy and Al2O3–NH2, respectively. Al2O3-epoxy and Al2O3–NH2 powders were equally filled in vinyl silicone oil to prepare a high Al2O3 loading (89 wt%) precursor of silicone potting adhesive. The viscosity of the precursor rapidly decreased with increasing reaction time of Al2O3-epoxy and Al2O3–NH2 at 140 °C. The viscosity reduction mechanism may be due to the formation of some Al2O3 clusters by the reaction of Al2O3-epoxy with Al2O3–NH2, which results in some vinyl silicone oil segments being held in the channel of particles through capillary phenomenon, leading to the friction among Al2O3 clusters decreasing considerably. Laser particle size analysis and scanning electron microscopy (SEM) results confirmed the existence of Al2O3 clusters. Energy dispersive spectroscopy (EDS) and dynamic viscoelasticity experiments revealed that some segments of vinyl silicone oils were held by Al2O3 clusters. When Al2O3-epoxy and Al2O3–NH2 reacted for 4 h, the thermal conductivity, CLTE and volume electrical resistivity of the silicone potting adhesive reached 2.73 W m−1 k−1, 75.8 ppm/°C and 4.6 × 10¹³ Ω cm, respectively. A new strategy for preparing electronic potting materials with high thermal conductivity, good flowability and low CLTE is presented.
1. Introduction
The potting operation of electronic devices can not only improve the dust-proof, moisture-proof and anti-vibration performance of devices, but also be conducive to the miniaturization and lightweight of devices.1 Electronic potting materials usually include epoxy resin (EP), polyurethane, and silicone. Epoxy resin potting adhesive has high hardness, good adhesion, and low CLTE (50–70 ppm/°C),2 while the repairability of the device is poor.3,4 Polyurethane potting adhesive has good elasticity and anti-vibration performance, but its thermal resistance is poor (usually lower than 150 °C).5 Silicone has good elasticity, wide working temperature range of minus 60 to 200 °C, and excellent repairability of the device.6–8 As a result, silicone potting adhesive is now used in many electronic devices.In recent years, electronic devices are developing towards high integration and miniaturization. The heat generated by devices needs to be diffused in time to improve the operation reliability and service life of devices.9,10 The thermal conductivity of silicone is low (∼0.2 W m−1 k−1),11,12 which cannot meet the working requirements of potting materials. Thermally conductive but insulating fillers such as boron nitride (BN),13,14 Al2O3,15 aluminum nitride (AlN),16 and silicon carbide (SiC)17 are often filled to improve the thermal conductivity of silicone potting adhesive. However, the thermal conductivity of polymer-based composites with fillers is relatively low. Preparation of 3D fillers, filler assembling and orientation can effectively improve the thermal conductivity of polymer composites.18–21 Li et al.22 used the ice template method to assemble BN nanosheets (BNNSs) and silver nanowires (AgNWs), and the thermal conductivity of the composites reached 1.10 W m−1 k−1 when the filler addition was only 5.0 vol%. Yang et al.23 prepared a thermally conductive filler with BN bridging carbon fiber (CF), and a special three-dimensional oriented BN/CF/EP composite material was obtained by the vacuum impregnation method, improving the thermal conductivity to 3.1 W m−1 k−1. Song et al.24 prepared 3D-Al2O3/silicone rubber (SR) frame by a foaming and vacuum infiltration process, and the thermal conductivity of the composite reached 0.747 W m−1 k−1 when the loading amount of Al2O3 was 32.6 wt%. Liu et al.25 obtained 35 wt% BN/30 wt% Al2O3/polydimethylsiloxane (PDMS) composite materials through a 3-D printing assisted orientation technology, in which the orientation rate and thermal conductivity reached 90.65% and 3.64 W m−1 k−1, respectively. The CLTE of silicone is usually higher than 200 ppm/°C.26 Although 3D fillers, filler orientation and self-assembling can improve the thermal conductivity of silicone composites to a certain extent, the CLTE of these composites are often too large to satisfy the potting requirements of specific electronic devices. Thermally conductive but insulating fillers such as Al2O3 have low CLTE (∼6.6 ppm/°C),27 which can meet the performance requirements of high thermal conductivity and low CLTE of silicone potting adhesive under the condition of large amount of filling. For example, Fu et al.28 prepared a series of dense boric acid modified BNNSs/EP composites by mechanical ball milling and pressure forming processes; the EP composites with 90 wt% BNNSs achieved the maximum thermal conductivity (6.7 W m−1 k−1) and the minimum CLTE (4.5 ppm/°C) at a temperature of 25 °C. Unfortunately, high filler loading will inevitably cause a sharp increase in the viscosity of silicone potting adhesive, which makes it impossible to achieve potting under mechanical or artificial conditions.29
In this study, Al2O3-epoxy and Al2O3–NH2 powders were equally filled in vinyl silicone oil to prepare a high Al2O3 loading (89 wt%) precursor of silicone potting adhesive. The viscosity of the precursor was greatly reduced through the reaction of Al2O3-epoxy and Al2O3–NH2 powders, and a mechanism of viscosity reduction was proposed. The experimental results of laser particle size analysis, SEM, EDS, and dynamic viscoelasticity analysis supported the proposed viscosity reducing mechanism. This study presents a new strategy for preparing electronic potting materials with high thermal conductivity, low viscosity and low CLTE.
2. Experimental
2.1. Materials
Vinyl silicone oil (50 cp) and hydrogen-containing silicone oil (H = 0.8 wt%) were provided by Jiande City Sifco Materials Co., Ltd. (China). Spherical alumina (AX10-32, Al2O3) with a mean particle size of 8.7 μm was supplied by Nippon Steel Corporation (Japan). γ-Aminopropyltriethoxy silane (KH550) and γ-(2,3-epoxypropoxy) propyltrimethoxy silane (KH560) were purchased from Changzhou Runxiang Chemical Co., Ltd (China) with a purity of 99%. Platinum catalysts (1000 ppm) were obtained from Shanghai Guiyou New Materials Technology Ltd. (China). Absolute ethanol, toluene and tetrahydrofuran (THF) were purchased from Aladdin Industrial Corporation (China). All reagents were used as received without any further purification except vinyl silicone oil.2.2. Surface treatment of Al2O3
Al2O3 powders were modified by 1 wt% KH550 and KH560, respectively. The treatment process was the same as in our previous paper.30 8 g KH550 was mixed with water and ethanol (the molar ratio of KH550 to water was 1![[thin space (1/6-em)]](https://www.rsc.org/images/entities/char_2009.gif) :3, the volume ratio of KH550 to ethanol was 1:1) and hydrolyzed at 30 °C for 30 min to prepare KH550 hydrolysate. 800 g Al2O3 powders were added into the high-speed mixer (SHR-10A, Zhangjiagang Beier Machinery Co., Ltd. China). When the temperature of Al2O3 powders in the high-speed mixer reached 110 °C, KH550 hydrolysate was sprayed and stirred at 1000 rpm for 25 min. The KH550 treated Al2O3 was washed three times using absolute ethanol to remove the ungrafted KH550, and dried in a vacuum oven at 105 °C for 5 h. The preparation of KH560 modified Al2O3 was the same as above.
:3, the volume ratio of KH550 to ethanol was 1:1) and hydrolyzed at 30 °C for 30 min to prepare KH550 hydrolysate. 800 g Al2O3 powders were added into the high-speed mixer (SHR-10A, Zhangjiagang Beier Machinery Co., Ltd. China). When the temperature of Al2O3 powders in the high-speed mixer reached 110 °C, KH550 hydrolysate was sprayed and stirred at 1000 rpm for 25 min. The KH550 treated Al2O3 was washed three times using absolute ethanol to remove the ungrafted KH550, and dried in a vacuum oven at 105 °C for 5 h. The preparation of KH560 modified Al2O3 was the same as above.
2.3. Preparation of precursor
The vinyl silicone oil was vacuum dried at 125 °C for 3 h to remove volatile matter before using. The mass ratio of Al2O3-epoxy and Al2O3–NH2 was set as 1:1, and the amount of Al2O3 in the mixture of surface-treated Al2O3 and vinyl silicone oil was set as 89 wt%. The mixing process was carried out in a high-speed disperser (JFS-1100A, Laizhou Wankai Machinery Co., Ltd. China) at 2000 rpm for 20 min at 30 °C using cooling water, then the mixture was transferred to a three-necked flask with a mechanical stirrer at 600 rpm in an oil bath and reacted at 140 °C for 0.5 h, 1 h, 2 h, 3 h, and 4 h, respectively, to prepare the precursor of silicone potting adhesive. The epoxy and amino groups on the surface of Al2O3 can react to different degrees. The mixture directly coming from the high-speed disperser was indicated as the precursor of 0 h reaction time for comparison.
2.4. Preparation of silicone potting adhesive
1000 g precursor was mixed with 1 g platinum catalysts and 2.0 g hydrogen-containing silicone oil, respectively, to prepare the A and B components of silicone potting adhesive.2.5. Characterization
X-ray photoelectron spectroscopy (XPS) was utilized to measure elemental content on the surface of Al2O3 powders by ESCALAB 250Xi (Thermo Electron Corporation, USA).Thermogravimetric analysis (TG) was carried out on a TGA8000 analyzer (PerkinElmer, USA) at a heating rate of 10 °C min−1 under a nitrogen atmosphere from 25 °C to 700 °C.
Shear viscosity was obtained using the NDJ-97 type rotary viscometer (Shanghai Changji, China) at 25 °C. The experiment was repeated three times.
Mastersizer 2000 laser particle size analyzer (Malvern Instruments, UK) was used to detect the particle size distribution. 10 g precursor was added in 100 mL toluene under stirring for 10 min, and allowed to settle naturally; the sediments were then collected. This operation was repeated three times to obtain particle sediments. The particle sediments were dispersed in absolute ethanol for testing, and the concentration of the sediments was 0.09%.
Dynamic viscoelasticity analysis of the precursor was performed using small amplitude oscillatory shear (SAOS) at 25 °C, on a Malvern Rheometer (HRnano 200, UK) equipped with cone-and-plate fixture. The diameter of the cone-and-plate was 20 mm, the inclination angle was 2°, and the fixed strain was 1%. Pre-shearing was performed before each dynamic viscoelasticity experiment to eliminate the shear history of the samples.
Gemini 500 field emission scanning electron microscope (Carl Zeiss, German) was utilized to observe the morphology of Al2O3 clusters. The washing operation of the precursor was the same as the laser particle size analysis, where the sediments were fully dispersed in 50 mL THF, then a drop was taken and dripped on the copper mesh, and dried at 80 °C for 2 h. Before testing, the samples were treated with gold spraying. The distribution of elements was obtained by a high-resolution field emission scanning electron microscope equipped with energy dispersive spectroscopy (Regulus 8230, Japan), and testing pattern was selected to use high-end plane insertion energy spectrum, to eliminate shooting shadow.
TPS 2500S thermal analyzer (Hot Disk, Sweden) was used to characterize the thermal conductivity of silicone potting composite materials, in which the double helix probe of 4 mm diameter was sandwiched between two lamella samples of 2 mm thickness. The CLTE was measured on a TMA402F3 thermo-mechanical analyzer (NETZSCH, German) from 25 °C to 250 °C at a heating rate of 10 °C min−1. ZST-121 volume surface resistivity tester (Beijing Zhonghang Times Instrument Equipment, China) was utilized to determine the volume resistivity, and the diameter and thickness of the sample was 8 mm and 2 mm, respectively. The components A and B of silicone potting adhesive were mixed under equal mass. After complete stirring, the mixture was injected into the mold, and vacuumed to eliminate air bubbles. The mixture was cured at 90 °C for 3 h, and then demolded to obtain thermal and insulating test samples.
3. Results and discussion
3.1. Surface treatment of Al2O3 powders
Fig. 1 shows the XPS spectra of Al2O3-epoxy, Al2O3–NH2, and pristine Al2O3 powders, and the content of Si 2p, C 1s, N 1s, and O 1s are provided in Table 1. The C and Si atom content of Al2O3-epoxy and Al2O3–NH2 was higher than that of pristine Al2O3 powders, while the oxygen element content of Al2O3-epoxy and Al2O3–NH2 was lower than that of pristine Al2O3. The N element content of Al2O3–NH2 was considerably higher than that of pristine Al2O3. The results show that KH560 and KH550 are successfully grafted onto the surface of Al2O3 powders, respectively.31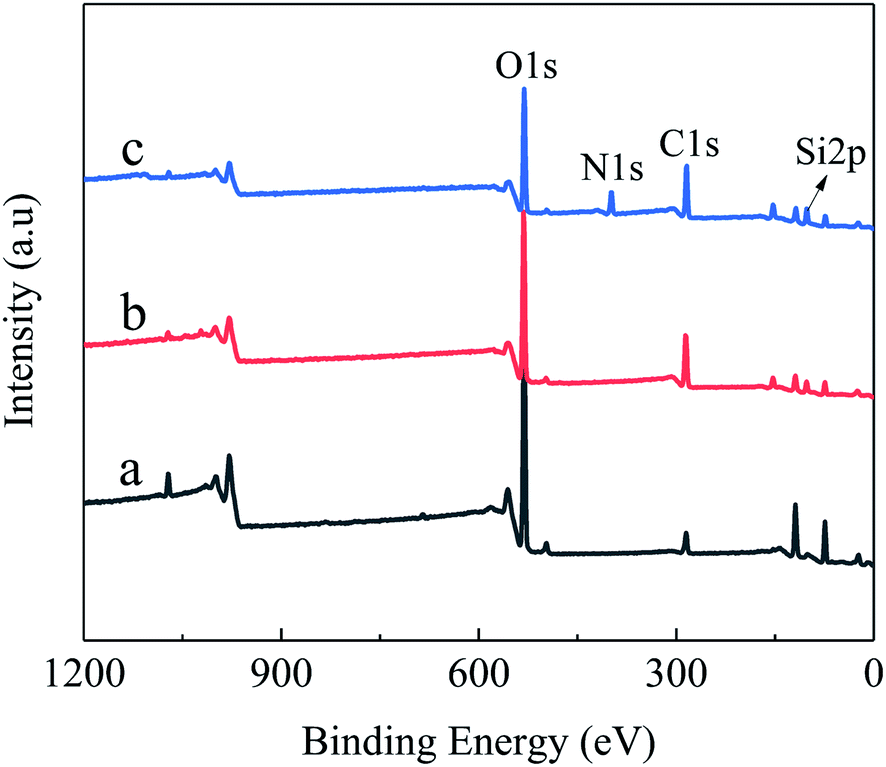 | ||
| Fig. 1 XPS spectra of powders (a) Pristine Al2O3, (b) Al2O3-epoxy, (c) Al2O3–NH2. | ||
| Sample | Si 2p (%) | C 1s (%) | N 1s (%) | O 1s (%) |
|---|---|---|---|---|
| Pristine Al2O3 | 1.85 | 17.70 | 0.80 | 79.65 |
| Al2O3-epoxy | 8.08 | 42.64 | 0 | 49.28 |
| Al2O3–NH2 | 11.46 | 40.08 | 10.50 | 37.96 |
Fig. 2 shows the TG curves of pristine and modified Al2O3. The mass retention rate (at 700 °C) of pristine Al2O3, Al2O3-epoxy, Al2O3–NH2 was 99.99%, 99.69%, and 99.64%, respectively. The mass loss of pristine Al2O3 came from the decomposition of the surface free hydroxyl group at high temperature, whereas the weight loss of Al2O3-epoxy and Al2O3–NH2 came from the decomposition of not only the free hydroxyl group but also the organic residues of KH560 or KH550 on the surface of Al2O3-epoxy and Al2O3–NH2 powders. The amount of residual silane agent grafted on the surface of inorganic powders can be obtained by comparing the mass retention rate difference between pristine and modified inorganic powders.32 A drop in the thermogram of Al2O3-epoxy at 100 °C (0.05%) might be coming from extraneous water, which should be eliminated while calculating the amount of residual KH560 grafted on the surface of Al2O3-epoxy. As a result, the amount of residual KH560 and KH550 grafted on the surface of Al2O3-epoxy and Al2O3–NH2 was 0.25% and 0.35%, respectively.
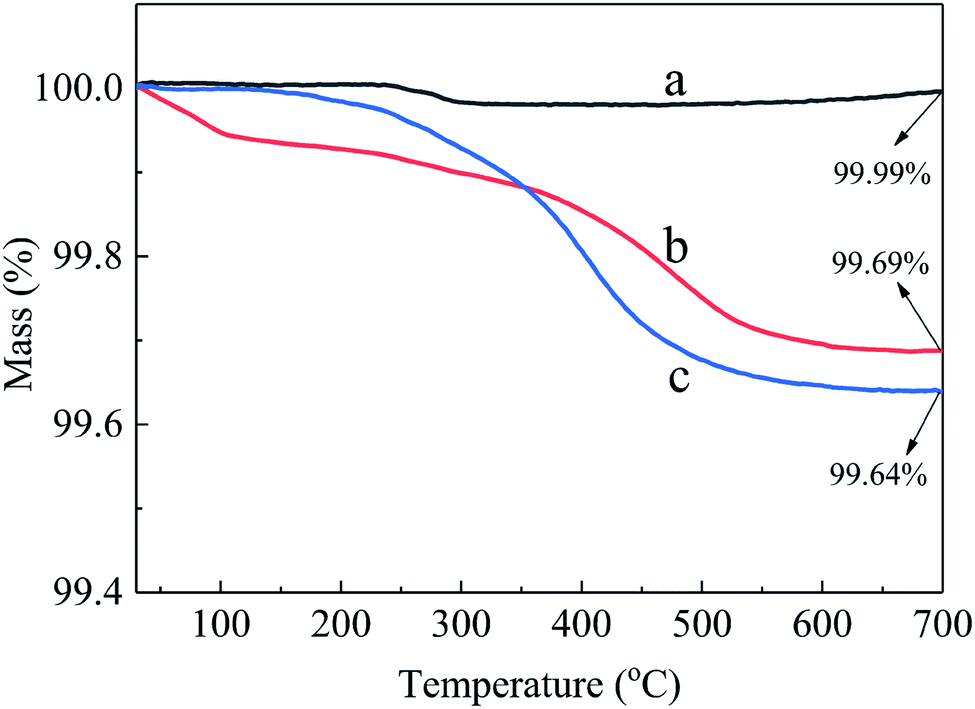 | ||
| Fig. 2 TG curves of powders (a) pristine Al2O3, (b) Al2O3-epoxy, (c) Al2O3–NH2. | ||
3.2. Effect of reaction time on viscosity
The viscosity of potting adhesive has a great impact on the stable production and performance consistency of electronic devices.33 Fig. 3 shows the effect of reaction time of Al2O3-epoxy and Al2O3–NH2 at 140 °C on the viscosity of the mixture of vinyl silicone oil filled with surface modified Al2O3. The Al2O3 loading amount was 89 wt%, and the viscosity of the mixture decreased significantly with increasing reaction time. The viscosity reached 110 Pa s when the reaction time was 0 h, and the mixture had difficulty to flow in this state. After Al2O3-epoxy and Al2O3–NH2 reacted for 0.5 h, the viscosity of the mixture had dropped about 46.4% of the initial viscosity. The viscosity dropped by 78.6% to 23.5 Pa s when the reaction time was 4 h, and the mixture flowed easily at this point.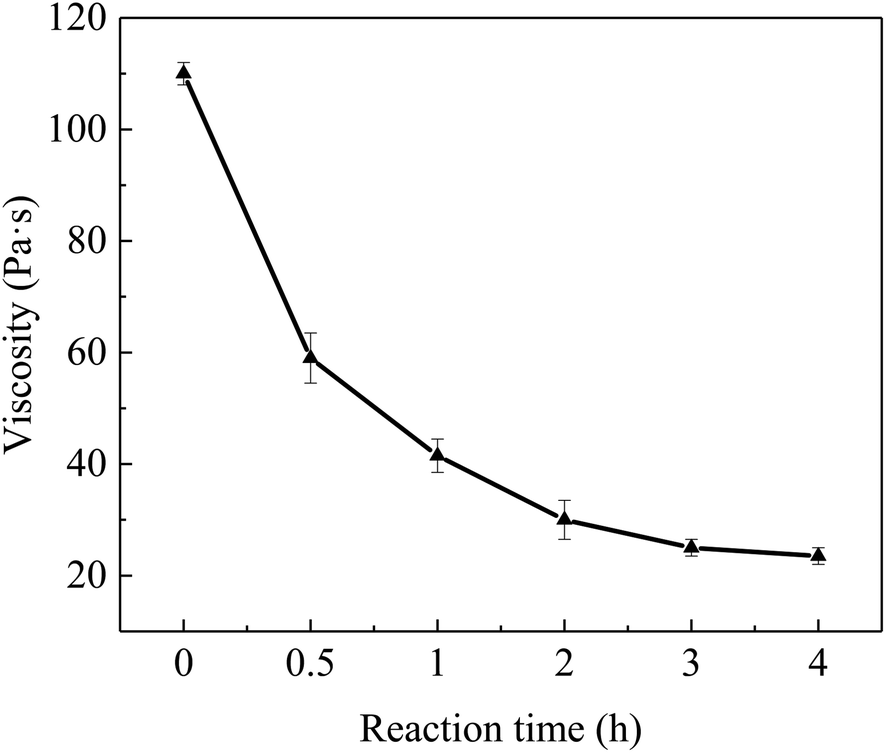 | ||
| Fig. 3 The viscosity of the mixture versus Al2O3-epoxy and Al2O3–NH2 reaction time. | ||
It is well known that Richard summarized the effect of particle interaction coefficient (σ) on the viscosity of the particle filling system.34 When σ = 0, the suspension viscosity equation was simplified as In(η/η0) = [η]φ, where η is suspension viscosity, η0 and [η] are viscosity and intrinsic viscosity of suspending medium, respectively, and φ is suspension particle volume fraction. For the case σ = 2, the suspension viscosity equation is In(η/η0) = [η]{φ/(1 − φ/φn)}, where, φn is the maximum particle packing fraction. He concluded that the viscosity of the particle filling mixture increased rapidly with increasing σ. In this work, the φ of Al2O3 was 0.68. Assuming φn was 0.95, when the σ increased from 0 to 2, η would increase e1.71[η] times by the above formula. However, the experimental results showed that the viscosity in this work decreased significantly with increasing particle interaction. This abnormal phenomenon may be due to the micro aggregation of Al2O3 particles, which will be discussed later.
3.3. Viscosity reduction mechanism
The epoxy groups of Al2O3-epoxy can react with the amino groups of Al2O3–NH2 in vinyl silicone oil, resulting in the formation of micro aggregation of Al2O3 particles as shown in Fig. 4(a). The chemical bond coming from the reaction of the epoxy and amino groups makes Al2O3 particles contact closely. As a result, tiny pore channels are generated and some vinyl silicone oil segments might immerse in the channels due to capillary phenomenon (Fig. 4(b)). The fixed vinyl silicone oil acts as a lubricator and significantly reduces the friction among Al2O3 clusters, so the viscosity of the Al2O3-epoxy and Al2O3–NH2 reaction system was considerably lower than that of the non-reacting system.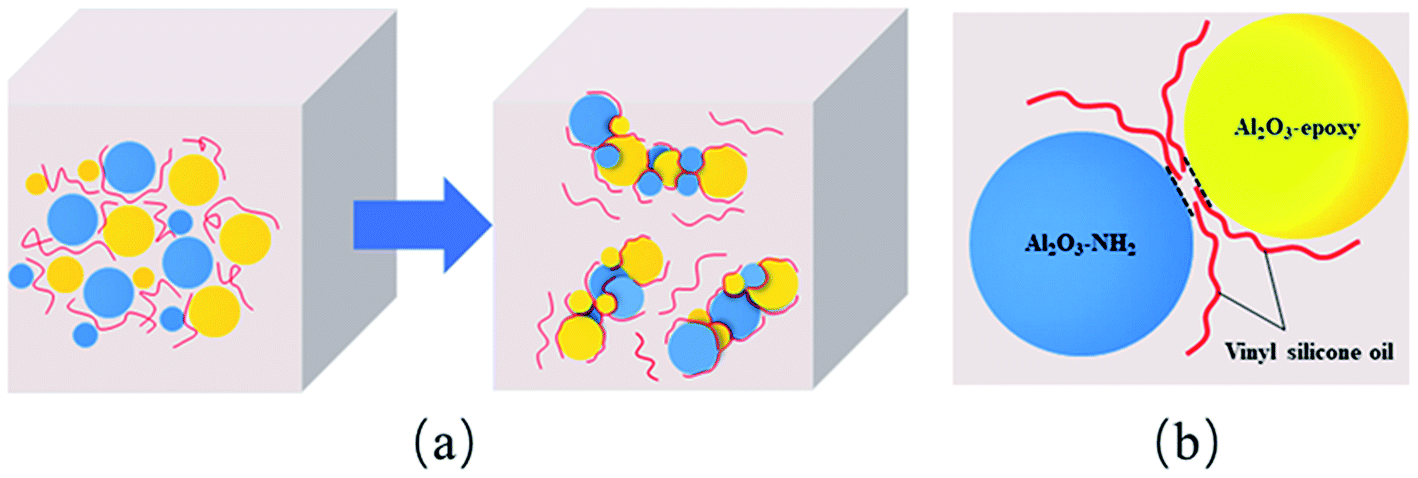 | ||
| Fig. 4 Diagrams of (a) formation of Al2O3 clusters, (b) some vinyl silicone oil segments fixing in the interval of particles. | ||
3.4. Experimental results supporting the viscosity reduction mechanism
Fig. 5 shows the effect of reaction time of Al2O3-epoxy and Al2O3–NH2 at 140 °C on the particle size and particle size distribution of Al2O3, and the corresponding data is shown in Table 2. The D10, D50 and D90 increased significantly with prolonged reaction time. There was a jump in particle size distribution between 1 h and 2 h reaction times. This phenomenon may be because the degree of epoxy group reacting with the amino group is considerably low at 1 h, but gets much higher at 2 h. The SEM images (Fig. 6) also show that the size of Al2O3 clusters at 2 h is considerably larger than that at 1 h.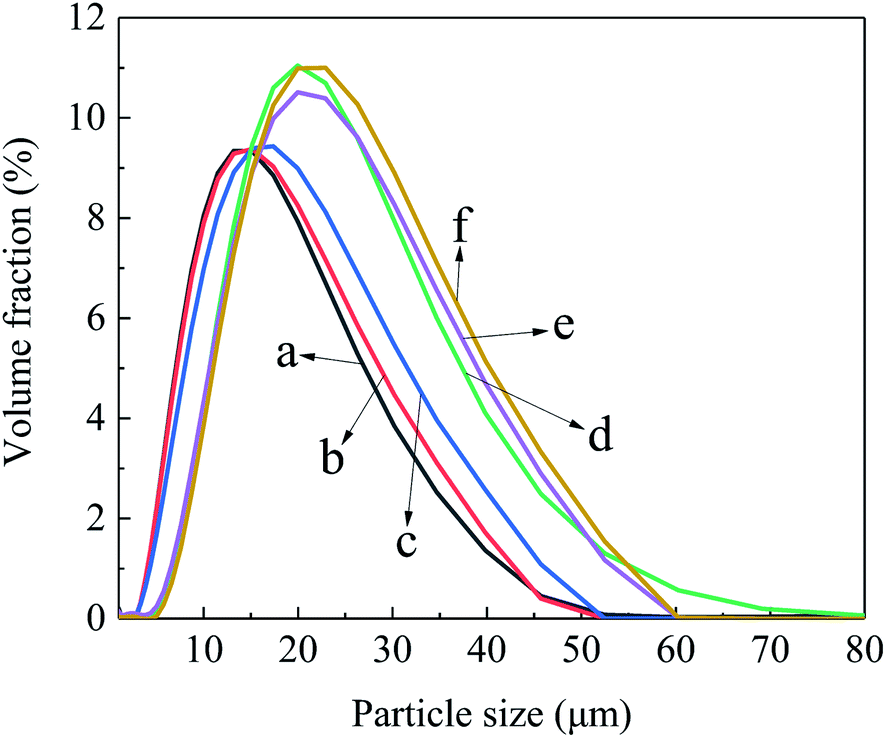 | ||
| Fig. 5 The particle size distribution curves of Al2O3 with different reaction time (a) 0 h, (b) 0.5 h, (c) 1 h, (d) 2 h, (e) 3 h, (f) 4 h. | ||
| Reaction time/h | D10/μm | D50/μm | D90/μm |
|---|---|---|---|
| 0 | 5.79 | 12.55 | 25.21 |
| 0.5 | 6.18 | 13.07 | 26.10 |
| 1 | 6.67 | 14.39 | 28.31 |
| 2 | 9.53 | 18.36 | 33.85 |
| 3 | 8.97 | 18.35 | 33.69 |
| 4 | 10.11 | 19.30 | 34.71 |
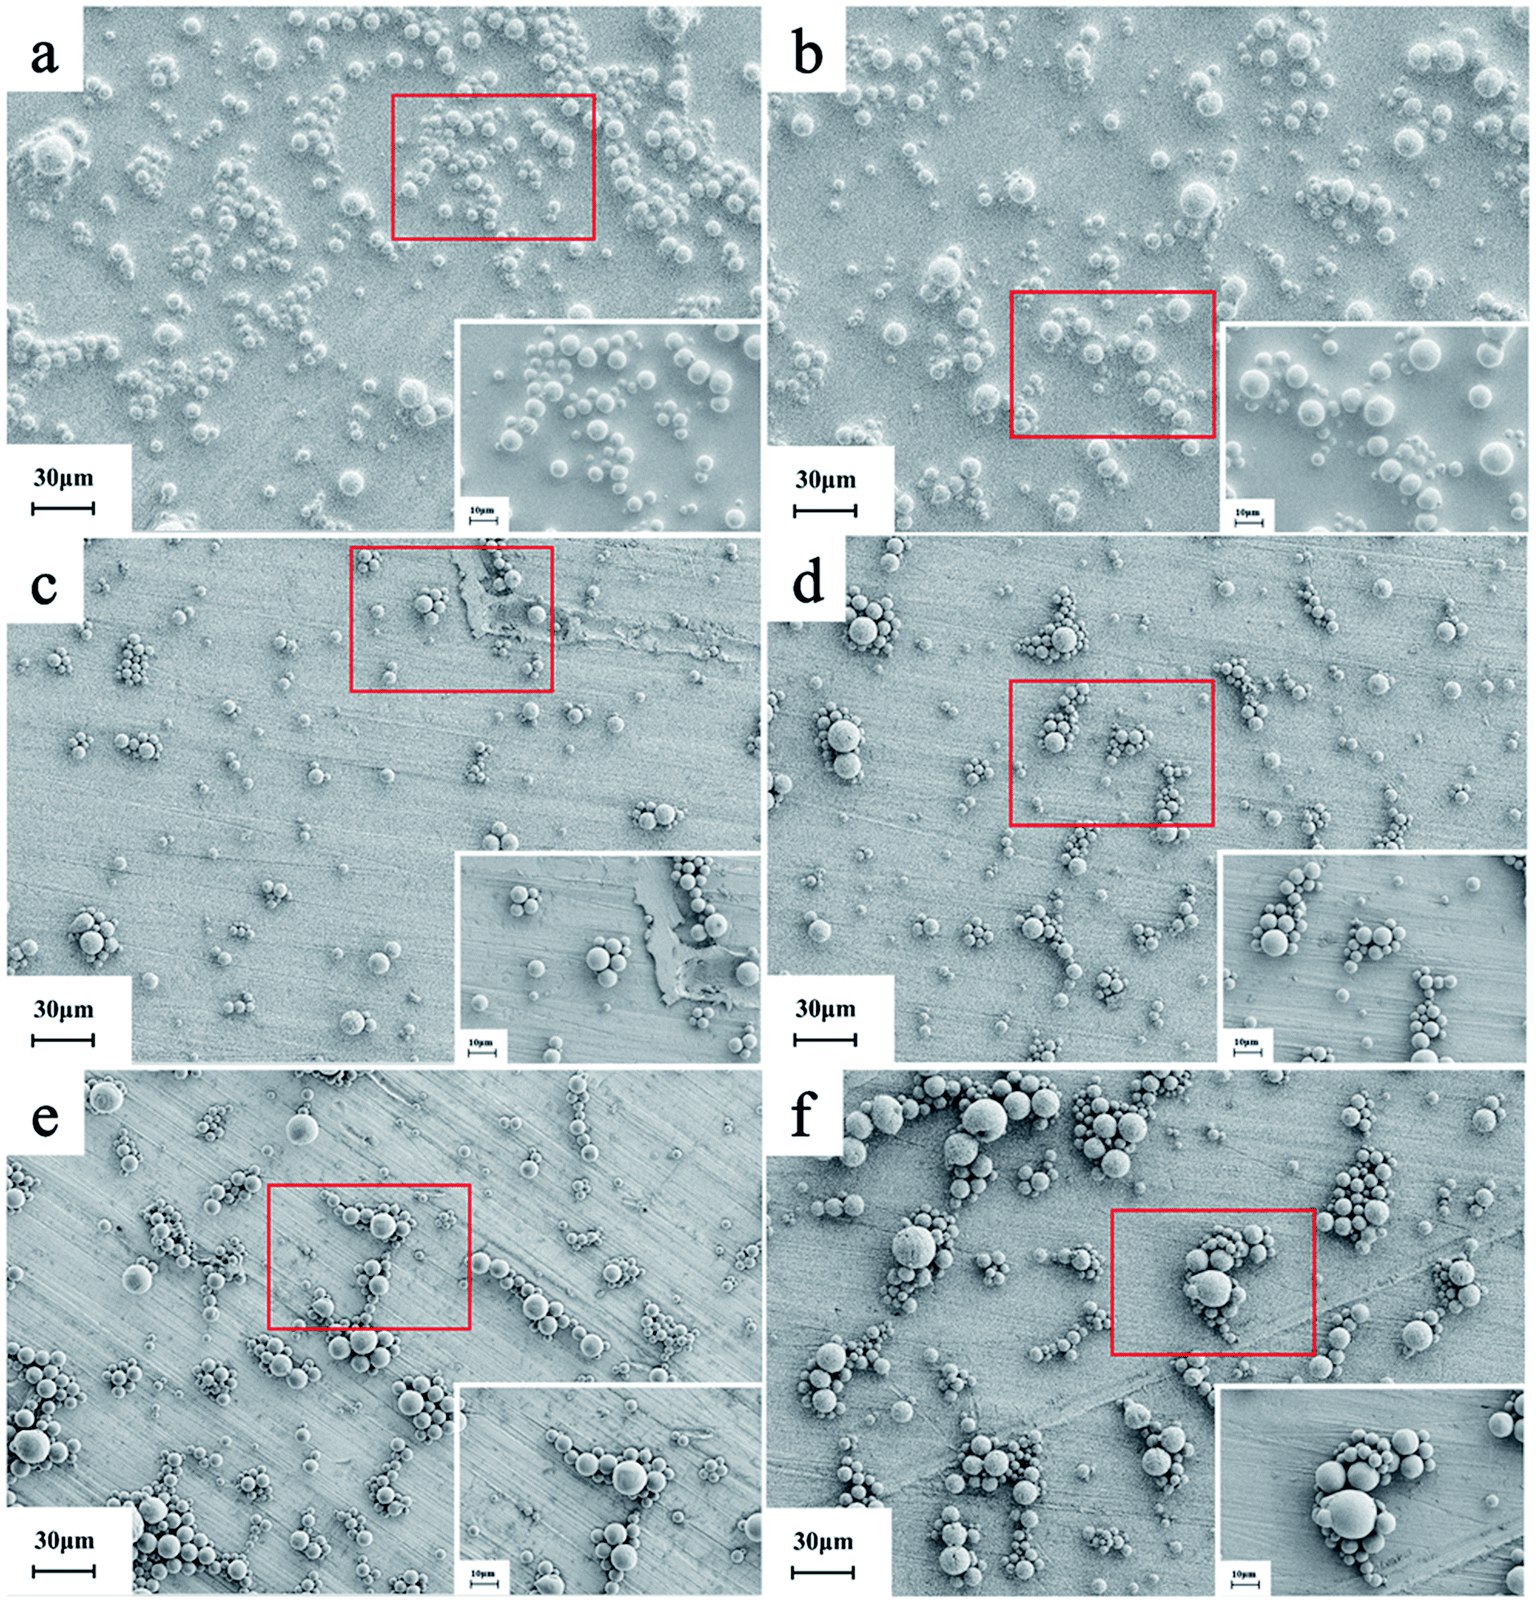 | ||
| Fig. 6 The SEM images of Al2O3 with different reaction time (a) 0 h, (b) 0.5 h, (c) 1 h, (d) 2 h, (e) 3 h, (f) 4 h. | ||
Fig. 6 shows the SEM images of Al2O3 with Al2O3-epoxy and Al2O3–NH2 reacting for different reaction times at 140 °C. It can be seen that the particle distribution was relatively loose when the reaction time was 0 h (Fig. 6(a)). When epoxy groups reacted with amino for 0.5 h to 1 h, the modified Al2O3 particles showed slight aggregation and the size of the Al2O3 clusters was small (Fig. 6(c)). The Al2O3 clusters became larger at 2 h reaction time, which was consistent with the results of particle size distribution shown in Fig. 5, and the Al2O3 particles were in close contact with each other (Fig. 6(d)). The size of Al2O3 clusters was getting larger and larger when the reaction time exceeded 3 h (Fig. 6(e and f)).
Fig. 7 shows the visual element distribution observed by EDS of Al2O3 with Al2O3-epoxy and Al2O3–NH2 reacting for different reaction times. From Fig. 7(a), when the reaction time was 0 h, the images of Al and O elements revealed that the Al2O3 particles were discrete from each other, and the image of Si element was unclear. Fig. 7(b) and (c) display the Al, O and Si images of Al2O3 with Al2O3-epoxy and Al2O3–NH2 reacting for 1 h and 4 h, respectively. It was found that some Al2O3 particles contacted tightly, and some Si elements appeared on the surface and interval of Al2O3 particles. Furthermore, the Si element in Fig. 7(c) was higher and more significant than that in Fig. 7(b) as the reaction time of Al2O3-epoxy and Al2O3–NH2 was prolonged. This phenomenon indicates that some vinyl silicone oil segments are fixed in the intervals of Al2O3 particles as described in Fig. 4(b).
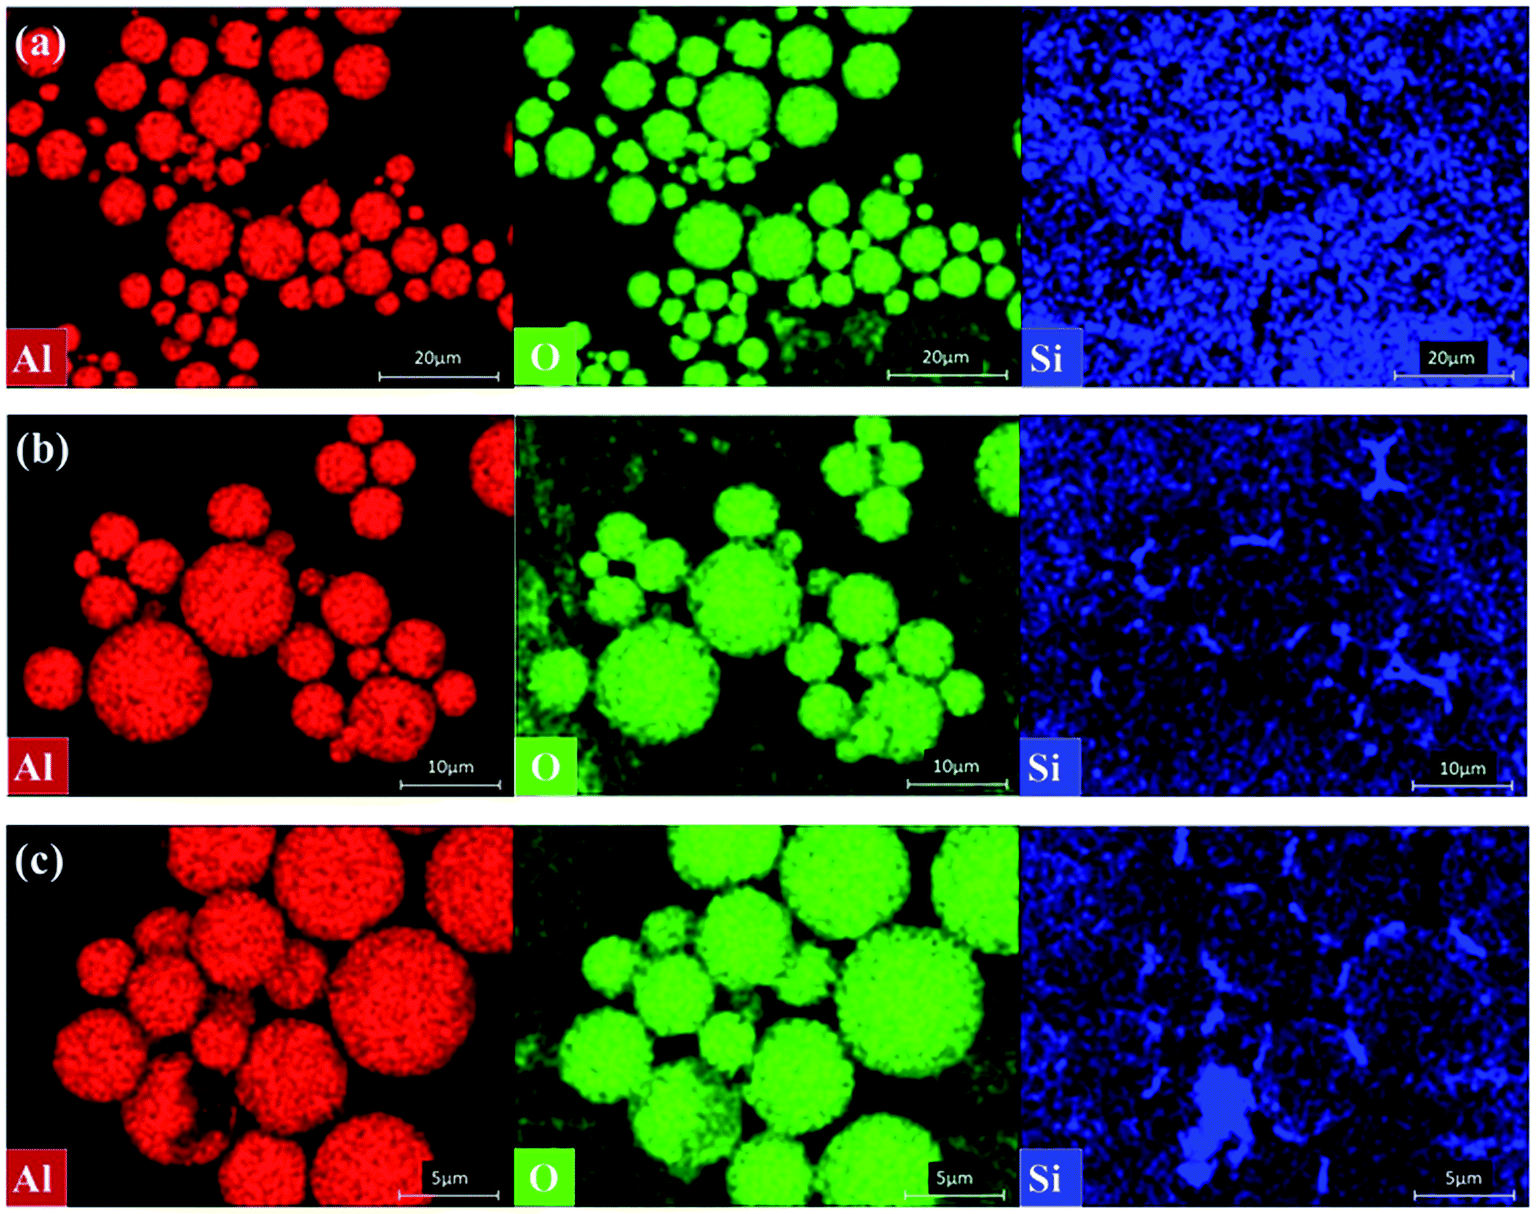 | ||
| Fig. 7 The Al, O and Si element images of Al2O3 with different reaction time (a) 0 h, (b) 1 h, (c) 4 h. | ||
Fig. 8 shows the dynamic viscoelasticity curves of precursors in which Al2O3-epoxy reacts with Al2O3–NH2 for different reaction times. Fig. 8(a) shows the curve of the complex viscosity η* versus angular frequency ω. When the reaction time was 0 h, the precursor exhibited significantly low-frequency shear thinning,35 while the precursor with powders reacting for 4 h exhibited weak shear thinning at low frequency, and both samples showed shear thickening behavior at high frequency. The change in viscosity is related to a certain structural change inside the liquid. Giuntoli et al.36 studied the α relaxation kinetic model of a coarse-grained polymer melt under steady-state shear. They found that the shear thinning was due to the action of shearing, the instantaneous combination of macromolecules was “deaggregated” or the fixed particle clusters were destroyed. In this study, when the epoxy and amino groups grafted on the Al2O3 surface did not undergo a chemical reaction, the Al2O3 powders were evenly dispersed in the vinyl silicone oil. Only electrostatic interaction, van der Waals forces and solvation exist among modified Al2O3 powders, and between powders and vinyl silicone oil. Under shear force, the electrostatic attraction, van der Waals forces and solvation were destroyed, and at this moment, the chain of vinyl silicone oil was untangled, resulting in remarkable shear thinning. On the contrary, when the two groups reacted, a chemical bonding interaction was generated among Al2O3 powders to form Al2O3 clusters. A part of the vinyl silicone oil was fixed in the tiny intervals due to capillary phenomenon, which has a lubricating effect resulting in reduced interaction among the Al2O3 clusters. Hence, the shear thinning phenomenon was weakened.
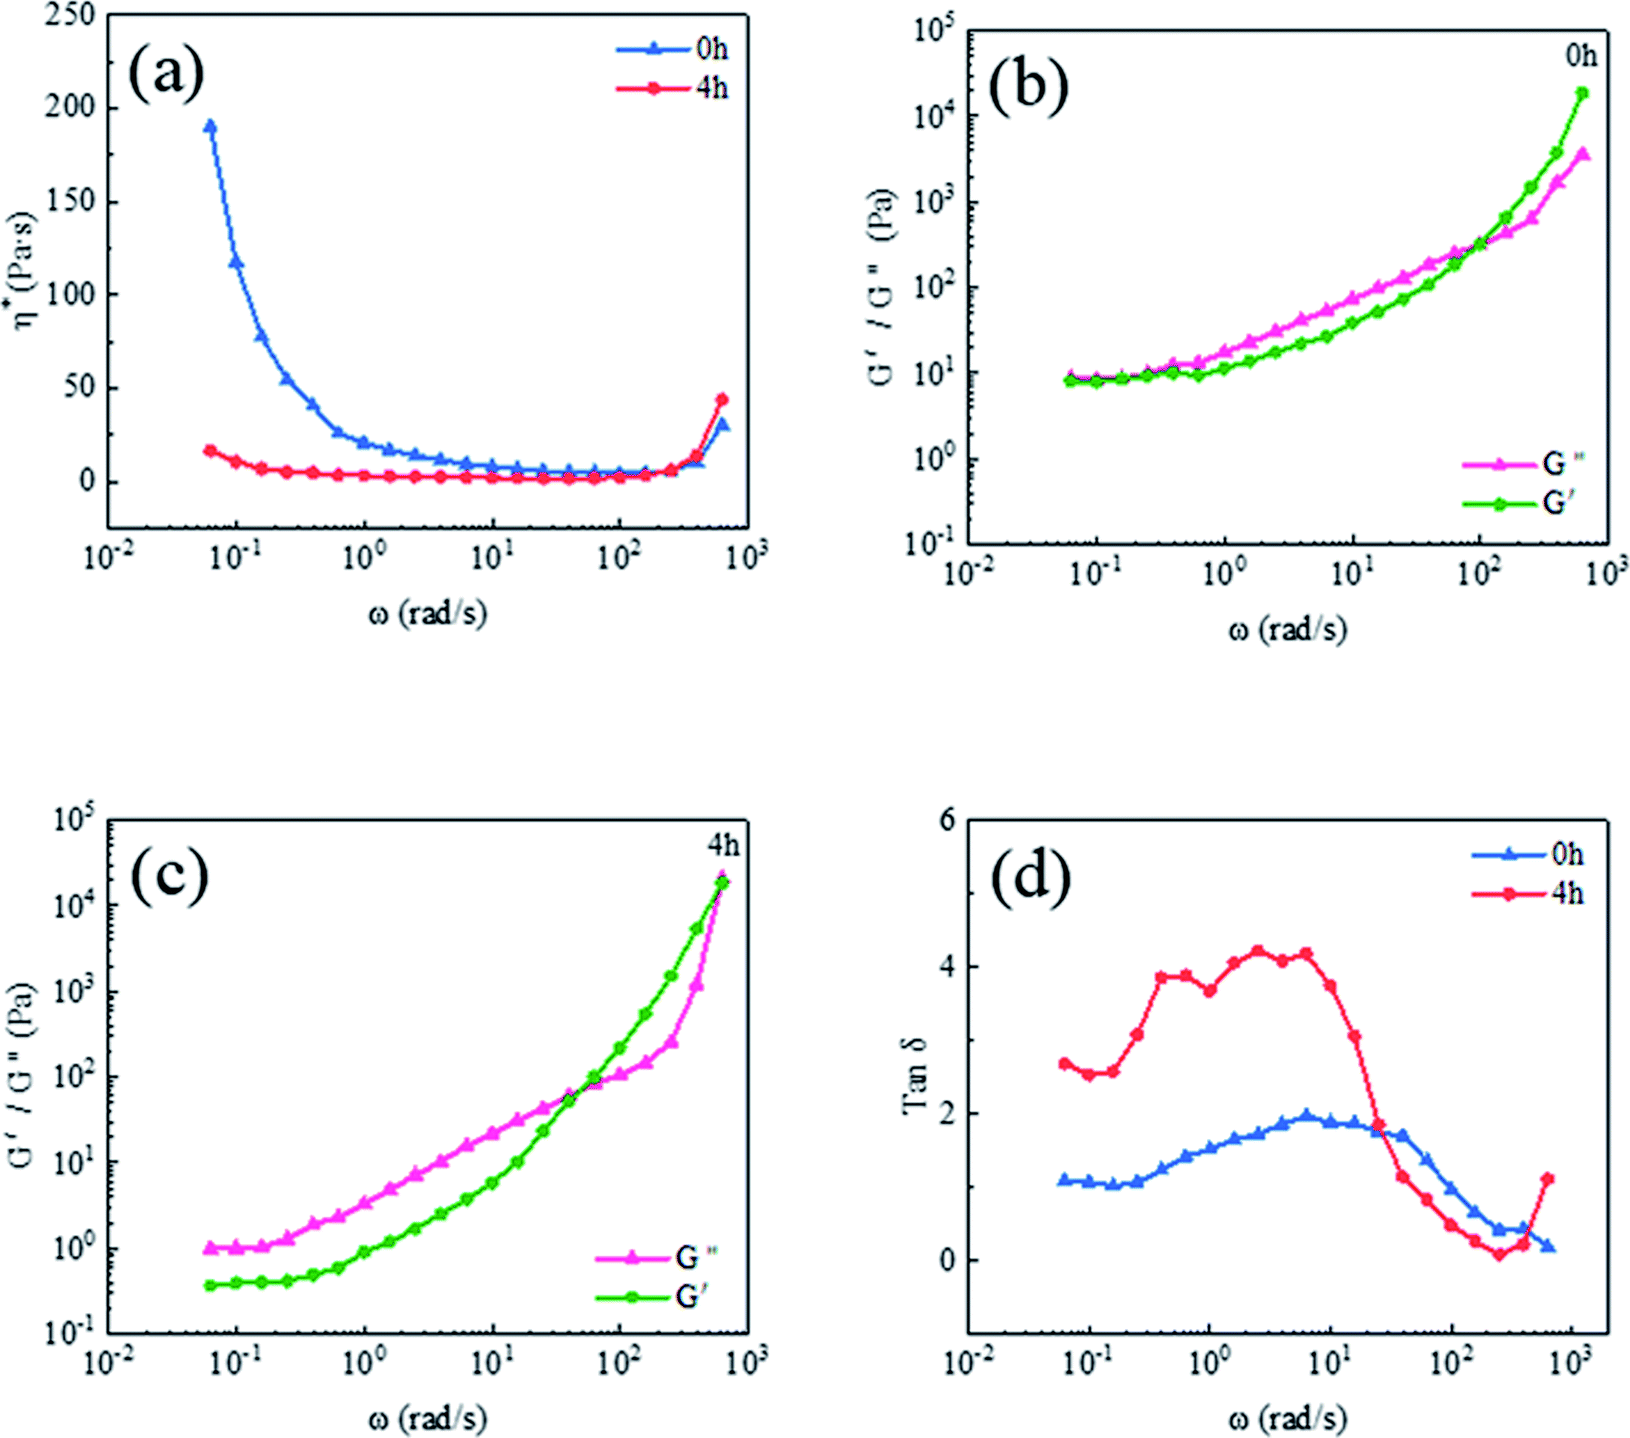 | ||
| Fig. 8 The dynamic viscoelasticity curves of precursors with different reaction time, (a) η* versus ω, (b) and (c) G′ and G′′ versus ω, and (d) tanδ versus ω. | ||
Fig. 8 (b) and (c) are the curves of the elastic modulus (G′) and viscous modulus (G′′) versus the angular frequency ω of precursor with the reaction time of 0 h and 4 h, respectively. It could be clearly seen from the figure that when ω was low, the G′ and G′′ of the precursor were basically the same at 0 h reaction time. Whereas the G′′ was higher than G′ when the reaction time was 4 h. It was because that Al2O3-epoxy and Al2O3–NH2 took reaction to build a Al2O3 cluster structure as shown in Fig. 6. Some segments of vinyl silicone oil were fixed in the particle intervals, which deeply limited the movement ability of the vinyl silicone oil, resulting in its prolonged relaxation time. The relationship between loss factor tanδ and ω in Fig. 8(d) further showed that the mechanical loss of the Al2O3-epoxy and Al2O3–NH2 reacting system was higher than that of the non-reacting system at lower frequency. As the frequency increased, both G′ and G′′ showed an increasing trend, but the increasing speed of G′ exceeded that of G′′. For the non-reacting system, the intersection of G′ and G′′ appeared at 99.58 rad s−1, while for the 4 h reaction system, the intersection appeared at 39.64 rad s−1, indicating that the elastic modulus of the 4 h reaction system is greatly improved. The results may be due to the formation of Al2O3 clusters in the 4 h reaction system, and Al2O3 clusters are of a bigger size, which increases the rigidity of the precursor at higher frequency. Zheng et al.37 found that higher G′ depended on larger size and the interaction between aggregations, which is conducive to flocculating a stable 3D network structure.
3.5. Thermal and insulating properties
The effect of reaction time of modified Al2O3 on the performance of silicone potting adhesive is shown in Table 3. The reaction time had little effect on the thermal conductivity, CLTE and the volume electrical resistivity of silicone potting adhesive. In the 4 h reaction system, the thermal conductivity, CLTE and volume electrical resistivity were 2.73 W m−1 k−1, 75.8 ppm/°C and 4.6 × 10¹³ Ω cm, respectively. The viscosity of silicone potting adhesive for the 4 h reaction system was 19.2 Pa s, which satisfies the demands of a heat conduction insulation potting material.| Reaction time (h) | 0 | 0.5 | 1 | 2 | 3 | 4 |
|---|---|---|---|---|---|---|
| Thermal conductivity (W m−1 k−1) | 2.67 | 2.69 | 2.70 | 2.67 | 2.71 | 2.73 |
| CLTE (ppm/°C) | 74.0 | 73.1 | 72.4 | 75.5 | 74.9 | 75.8 |
| Volume electrical resistivity (X 1013 Ω cm) | 5.7 | 4.8 | 2.5 | 6.4 | 7.3 | 4.6 |
4. Conclusions
This work found that the viscosity reduction of silicone potting adhesive was related to the formation of filler clusters. Al2O3-epoxy and Al2O3–NH2 were successfully obtained by surface silanization. The viscosity of the precursor decreased significantly with an increase in the reaction time of Al2O3-epoxy and Al2O3–NH2. The viscosity of the 4 h reaction system was only 78.6% of 0 h. The reason for this phenomenon might be that chemical bonding interaction among modified Al2O3 powders promoted the formation of Al2O3 clusters; some segments of vinyl silicone oils were fixed in tiny particle pore channels through capillary phenomenon, leading to a remarkable lubrication effect of Al2O3 clusters. Particle size distribution and SEM results revealed the formation of Al2O3 clusters. EDS evidently showed the existence of vinyl silicone oil in the particle intervals of clusters. The dynamic viscoelasticity experimental results also supported the assumed viscosity reduction mechanism. Moreover, the as-prepared silicone potting adhesive possessed excellent thermal conductivity, low CLTE and low viscosity.Author contributions
Jing Wang: methodology, validation, formal analysis, investigation, data curation, writing – original draft. Haihong Ma: investigation, validation, writing – review & editing. Fengmei Ren: investigation, validation. Zhengfa Zhou: methodology, investigation, validation, writing – review & editing. Weibing Xu: supervision, project administration, funding acquisition.Conflicts of interest
There are no conflicts to declare.Acknowledgements
The authors are grateful for the support and funding from Anhui Science and Technology Department, China (17030901076).References
- S. A. Meguid, C. Zhuo and F. Yang, J. Electron. Packag., 2014, 136, 041010 CrossRef
.
- T. Li, J. Zhang, H. P. Wang, Z. N. Hu and Y. F. Yu, ACS Appl. Mater. Interfaces, 2013, 5, 8968–8981 CrossRef CAS PubMed
- H. Chun, S. Y. Park, S. J. Park and Y. J. Kim, Polymer, 2020, 207, 122916 CrossRef CAS
- J. C. Foster, C. L. Staiger, J. W. Dugger and E. M. Redline, ACS Macro Lett., 2017, 10, 940–944 CrossRef
- N. H. Li, J. P. Liu, X. B. Liu, W. W. Yang, K. P. Song and X. L. Li, IOP Conf. Ser.: Mater. Sci. Eng., 2020, 774, 012089 CrossRef CAS
- Y. Xue, X. F. Li, H. S. Wang, F. Zhao, D. H. Zhang and Y. F. Chen, Mater. Des., 2019, 165, 107580 CrossRef CAS
- K. P. Ruan, H. Yan, S. J. Zhang, X. T. Shi, Y. Q. Guo and J. W. Gu, Compos. Sci. Technol., 2021, 210, 108799 CrossRef CAS
- Y. G. Ouyang, X. F. Li, F. Ding, L. Y. Bai and F. L. Yuan, Compos. Sci. Technol., 2020, 190, 108019 CrossRef CAS
- X. T. Yang, C. B. Liang, T. B. Ma, Y. Q. Guo, J. Kong, J. W. Gu, M. J. Chen and J. H. Zhu, Adv. Compos. Hybrid Mater., 2018, 1, 207–230 CrossRef
- M. Shtein, R. Nadiv, M. Buzaglo and O. Regev, ACS Appl. Mater. Interfaces, 2015, 7, 23725–23730 CrossRef CAS PubMed
- D. Yang, Q. G. Wei, B. Y. Li, L. Y. Yu, Y. F. Ni and L. Q. Zhang, Composites, Part A, 2021, 14, 106260 CrossRef
- D. Liu, Q. Q. Kong, H. Jia, L. J. Xie, J. P. Chen, Z. C. Tao, Z. Wang, D. Jiang and C. M. Chen, Carbon, 2021, 18, 216–224 CrossRef
- D. X. Liu, C. G. Ma, H. T. Chi, S. H. Li, P. Zhang and P. B. Dai, RSC Adv., 2020, 10, 42584–42595 RSC
- C. Y. Xu, M. Miao, X. F. Jiang and X. B. Wang, Compos. Commun., 2018, 10, 103–109 CrossRef
- Y. G. Ouyang, L. Y. Bai, H. F. Tian, X. F. Li and F. L. Yuan, Composites, Part A, 2022, 152, 106685 CrossRef CAS
- Z. L. Wei, W. Q. Xie, B. Z. Ge, Z. J. Zhang, W. L. Yang, H. Y. Xia, B. Wang, H. Y. Jin, N. K. Gao and Z. Q. Shi, Compos. Sci. Technol., 2020, 199, 108304 CrossRef CAS
- Y. M. Yao, X. D. Zhu, X. L. Zeng, R. Sun, J. B. Xu and C. P. Wong, ACS Appl. Mater. Interfaces, 2018, 10, 9669–9678 CrossRef CAS PubMed
- H. Y. Chen, V. V. Ginzburg, J. Yang, Y. F. Yang, W. Liu, Y. Huang, L. B. Du and B. Chen, Prog. Polym. Sci., 2016, 59, 41–85 CrossRef CAS
- F. Zhang, Y. Y. Feng and W. Feng, Mater. Sci. Eng. R, 2020, 142, 100580 CrossRef
- X. M. Zhang, J. J. Zhang, L. C. Xia, C. H. Li, J. F. Wang, F. Xu, X. L. Zhang, H. Wu and S. Y. Guo, ACS Appl. Mater. Interfaces, 2017, 9, 22977–22984 CrossRef CAS PubMed
- Y. Hue, H. S. Wang, X. F. Li and Y. F. Chen, Composites, Part A, 2021, 144, 106336 CrossRef
- H. T. Li, C. J. Fu, N. Chen, T. Zhang, J. M. Liu, G. P. Du, L. L. Ren, X. L. Zeng and R. Sun, Compos. Commun., 2021, 25, 100601 CrossRef
- Y. Wang, Y. Gao, B. Tang, X. F. Wu, J. Chen, L. M. Shan, K. Sun, Y. T. Zhao, K. Yang, J. H. Yu and W. G. Li, RSC Adv., 2021, 11, 25422–25430 RSC
- J. N. Song, L. Wu and Y. Zhang, Polym. Bull., 2020, 77, 2139–2153 CrossRef CAS
- M. J. Liu, S. W. Chiang, X. D. Chu, J. Li, L. Gan, Y. B. He, B. H. Li, F. Y. Kang and H. D. Du, Ceram. Int., 2020, 46, 20810–20818 CrossRef CAS
- N. Suzuki, S. Kiba, Y. Kamachi, N. Miyamoto and Y. Yamauchi, J. Mater. Chem., 2011, 21, 5338–5344 RSC
- Y. J. Wan, G. Li, Y. M. Yao, X. L. Zeng, P. L. Zhu and R. Sun, Compos. Commun., 2020, 19, 154–167 CrossRef
- K. Fu, J. W. Yang, C. C. Cao, Q. H. Zhai, W. Qiao, J. X. Qiao, H. J. Gao, Z. Zhou, J. W. Ji and M. Y. Li, ACS Appl. Mater. Interfaces, 2021, 13, 2853–2867 CrossRef CAS PubMed
- Y. Hu, C. Chen, Y. F. Wen, Z. G. Xue, X. P. Zhou, D. Shi, G. H. Hu and X. L. Xie, Compos. Sci. Technol., 2021, 209, 108760 CrossRef CAS
- F. M. Ren, R. Zhou, F. Sun, H. H. Ma, Z. F. Zhou and W. B. Xu, RSC Adv., 2017, 7, 29779–29785 RSC
- Q. Guo, P. L. Zhu, G. Li, J. J. Wen, T. Y. Wang, D. Q. Lu, R. Sun and C. P. Wong, Composites, Part B, 2017, 116, 388–397 CrossRef CAS
- Y. M. Han, J. Y. Zhang, Q. Y. Yang, L. Shi, S. C. Qi and R. G. Jin, J. Appl. Polym. Sci., 2008, 107, 3788–3795 CrossRef CAS
- C. Chen, Y. Xue, X. W. Li, Y. F. Wen, J. W. Liu, Z. G. Xue, D. A. Shi, X. P. Zhou, X. L. Xie and Y. W. Mai, Composites, Part A, 2019, 118, 67–74 CrossRef CAS
- R. D. Sudduth, J. Appl. Polym., 1993, 48, 37–55 CrossRef CAS
- J. E. Butler and B. Snook, Annu. Rev. Fluid. Mech., 2018, 50, 299–318 CrossRef
- A. Giuntoli, F. Puosi, D. Leporini, F. W. Starr and J. F. Douglas, Sci. Adv., 2020, 6, eaaz0777 CrossRef PubMed
- Z. Zheng, Y. H. Song, X. Wang and Q. Zheng, J. Rheol., 2015, 59, 971–993 CrossRef CAS
| This journal is © The Royal Society of Chemistry 2022 |