 Open Access Article
Insight on the effect of Ni and Ni–N co-doping on SnO2 anode materials for lithium-ion batteries
Jianjian Shi a,
Tao Chen*a,
Minhang Songb and
Xiaoli Sun*cd
aSchool of Electronic Engineering, Chengdu Technological University, Chengdu 611730, PR China. E-mail: sjjian@cdtu.edu.cn; 570560423@qq.com
bInstitute of Process Engineering, Chinese Academy of Sciences, Beijing 100190, China
cDepartment of Energy and Power Engineering, Tsinghua University, Beijing, 100084, P. R. China. E-mail: sunxiaolideyuye@163.com
dBeijing Graphene Institute, Beijing 100095, P. R. China
First published on 10th May 2022
Abstract
With the increased demand for high-rate performance Li-ion batteries, it is necessary to find available methods to improve the rate properties of SnO2 electrodes. It is noteworthy that doping was considered to be a feasible means. The electronic structures and diffusion energy barriers of Ni-doped and Ni–N co-doped SnO2 were calculated based on density functional theory. The results estimated that the energy gaps of Ni-doped and Ni–N co-doped SnO2 are 1.07 eV and 0.94 eV, which both are smaller than the value of 2.08 eV of SnO2. These exhibit that the conduction properties of SnO2 can be enhanced by doping with the Ni or Ni–N atoms. Moreover, the diffusion properties of Li can also be improved by doping with Ni–N atoms due to the diffusion energy barrier of Li from the B to C point for Ni–N co-doped SnO2 being 0.12 eV smaller than the value of 0.24 eV for the pristine SnO2. Meanwhile, the diffusion energy barriers of Li along other pathways for Ni–N co-doped SnO2 are almost the same as 0.24 eV for SnO2. These results show that both the electronic and ionic conductivity of SnO2 can be enhanced by Ni–N co-doping, which provides a theoretical explanation to promote the rate properties of SnO2 by Ni–N co-doping as anode materials for Li-ion batteries.
1. Introduction
Lithium-ion batteries (LIBs) have been extensively applied in portable electronics and are expected to be used in electric vehicles (EV) and plug-in hybrid electric vehicles (HEV). Further improvements in energy and power density put forward higher requirements on either new electrode materials or their novel structural design. In the past few decades, significant efforts have been made to meet these needs. Rutile SnO2 has become one of the most promising substitutes for graphite anode materials owing to its high theoretical capacity (781 mA h g−1) compared with the theoretical capacity (372 mA h g−1) of graphite.1–4 However, there is a severe impediment to the development of SnO2 as anode materials for LIBs because of its poor electric conductivity. Moreover, compared with two-dimensional materials, such as black phosphorus (BP), defective graphene, Li diffusion energy barrier in the bulk SnO2 is high.5–8 Therefore, it is necessary to find a feasible method to improve electronic and ionic conductivities of SnO2.The conduction property of SnO2-based composites with conducting materials (such as carbonaceous materials and conducting polymers) is high in comparison with SnO2, in accordance with the quantitative experiments.9–11 Meanwhile, other methods used to improve the rate property of SnO2 also play an essential role. For instance, doping, the metal cationic (such as Al, Mo, Ni, Co, Cu, Sb, W) doping, non-metal anionic (such as N, P, F) doping, or metal and non-metal (such as Ni–N, Co–N, Cu–N) co-doping can also be used to enhance the electrochemical properties of SnO2 as anode materials.12–22 Moreover, the rate property of SnO2 with graphene as electrode for LIBs was investigated by Miao et al. based on the density functional theory (DFT) method.6 They found that the Li ionic conductivity of SnO2 with graphene was enhanced due to a new Li diffusion path [110] with a low diffusion barrier of Li compared to the pristine SnO2 with [001] direction.6,7
Although the electronic and ionic conductivities of SnO2 as the anode material for LIBs can be enhanced with distinguishable modified techniques. However, the improvement of SnO2 by doping with impurity atoms mainly focuses on the experiment. There are few investigations to explain why the rate property of SnO2 improved by doping is high compared with the pure SnO2. Therefore, herein, the electronic and ionic conductivities of SnO2 as anode materials for LIBs were calculated using the DFT method, and the effects of doping atoms (Ni or Ni–N) on electronic and ionic conductivities of SnO2 were investigated.
2. Simulation methodology
The DFT calculations were performed using the SIESTA (Spanish Initiative for Electronic Simulations with Thousands of Atoms) with Perdew–Burke–Ernzerhof (PBE) generalized gradient approximation (GGA-PBE) function.23,24 The valence electron wave functions were expanded using a DZ basis set without polarization. An energy cut-off was set to be 150 Ry. The rutile SnO2 with P42/mnm space group, Sn and O atoms occupy the 2a and 4f sites, respectively, using a 2 × 2 × 3 k-point mesh to relax the bulk SnO2. The relaxation of the pristine SnO2 unit cell was performed with a conjugate gradient (CG) method until the maximum force was less than 0.02 eV Å−1. The optimized bulk structure is shown in Fig. 1, where big and small balls are Sn and O atoms, respectively. The calculated bulk equilibrium lattice constant of SnO2 is a = b = 4.85 Å, c = 3.29 Å, which is almost identical to the experimental and calculational values, as listed in Table 1.12,13,18,25 A Ni occupies a Sn site (Ni-doping) and a Ni occupies a Sn site while a N replaces a O Site (Ni–N co-doping) in 2 × 2 × 3 SnO2 supercells were used to study. A 1 × 1 × 3 k-point mesh to relax the Ni-doped SnO2 and Ni–N-doped SnO2, The Li diffusion barrier and band structure were computed after relaxing.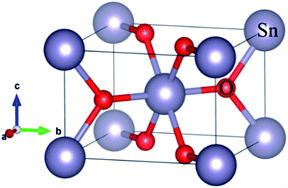 | ||
| Fig. 1 The crystal structure of the bulk SnO2, where the big and small balls are Sn and O atoms, respectively. | ||
3. Results and discussion
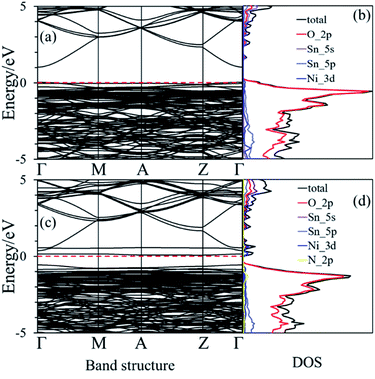
The nearest neighboring heteroatom doping was only considered in our work. According to the symmetry of SnO2, each Sn atom has 8 the nearest neighboring Sn atoms and 6 the neighboring O atoms, respectively, as shown in Fig. 1. Therefore, one Ni position doping and one Ni–N position co-doping were studied. Consider first, some materials demonstrate good computational performance but are difficult to synthesize, which limits their application in experiments or in practice.26 So, it is important to first investigate the stability of SnO2 in order to explore the possibility of its synthesis. We use the formation energy descriptor to measure the stability of doped SnO2. The calculated formation energies of Ni doping and Ni–N co-doping 2.21 eV and 2.70 eV, respectively. Low formation energies of defects generally mean that these defects form easily.27 The result indicates that Ni-doped SnO2 and Ni–N co-doped SnO2 are energetically favorable, which is consistent with the experimental observations.28,29The conduction property of SnO2 by doping (Ni, Ni–N-co-doping) was investigated by considering their electronic structures calculated based on the DFT. The calculated band structure and density of states (DOS) of the bulk SnO2 are shown in Fig. 2(a) and (b), respectively. It is shown that the bulk SnO2 is a semiconductor with a direct band gap of 2.08 eV. Its band gap is within other calculations (1.6 to 2.3 eV),6,30,31 as shown in Fig. 2(a), where the Fermi level is zero. Fig. 2(b) shows that the energy states near the Fermi level (Ef) are mainly occupied by electrons in the 2p orbital of O atoms. The conduction band is largely contributed by 5s states of Sn atom. However, the band gaps of Ni-doped and Ni–N co-doped SnO2 are 1.07 eV and 0.94 eV, respectively, as shown in Fig. 3(a) and (c), which both are smaller about 1 eV than that of the bulk SnO2. Therefore, the partial transfer of electrons caused by thermal excitation from the valence band to conduction band will be more effortless in the doped SnO2 than in the pure SnO2.
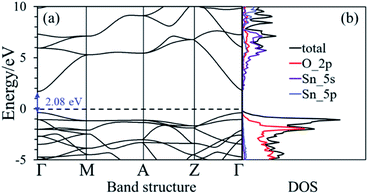 | ||
| Fig. 2 (a) and (b) are the band structure and the density of state of the bulk SnO2, respectively. The dashed black line is the Fermi level that its value is zero. | ||
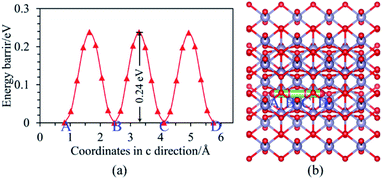
Moreover, it can be seen from Fig. 3(b) that the Ef is localized at the maximum of the valence band (VBM) for Ni-doped SnO2, as well as the states near Ef mainly consist of 3d states of Ni atom. For Ni–N co-doped SnO2, as shown in Fig. 3(d), the states near Ef are occupied primarily by 3d states of Ni and 2p states of N. This indicates that the states near Ef can be changed by doped atoms (Ni, Ni–N) for the bulk SnO2 to improve their electronic structures. Then their degree of conductivity has been enhanced by doping with Ni and Ni–N. In addition, the conductivity of Ni–N co-doped SnO2 is a little better than that of Ni-doped SnO2 according to their energy gaps. The Li ion property of SnO2 as anode material for LIBs is as significant as its electronic property discussed above. Therefore, the following Li diffusion properties of SnO2 and SnO2 doped were studied in the light of Li diffusion energy barrier calculated with the DFT method. The diffusion energy barrier of Li in the bulk SnO2 obtained is 0.24 eV, as shown in Fig. 4(a). Moreover, the diffusion path (a path from A point to D point) shown in Fig. 4(b), is identical to the experimental observation that Li diffusion direction is dominated by the [001] direction,6,7 which both is a one-dimensional diffusion path.
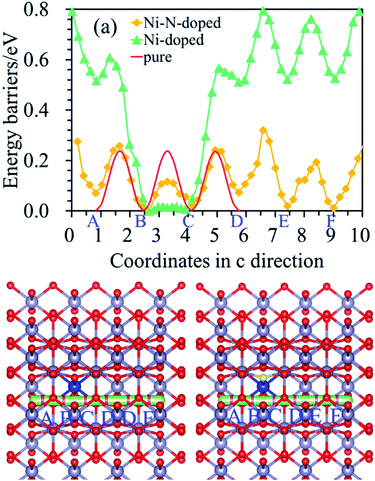
The diffusion path of Li in Ni-doped SnO2 and Ni–N co-doped SnO2 remains one-dimensional, as shown in Fig. 5(b) and (c), but the diffusion energy is different. It can be seen from Fig. 5(a) that the energy barriers of Li for the nearest neighbor diffusion path (from B to C point) in the Ni-doped SnO2 and Ni–N co-doped SnO2 are 0.02 eV and 0.12 eV, which are both less than the value (0.24 eV) of the bulk SnO2, which exhibits that the Li ionic conductivity of Ni-doped SnO2 and Ni–N co-doped SnO2 has been greatly improved for the nearest neighbor path. Furthermore, the energy barriers of Li far from the nearest-neighbor diffusion path (such as from C to D point, D to E point, and E to F point) be also calculated to see the effect of dopant atoms on all diffusion properties. For Ni-doped SnO2, diffusion barriers of Li from C to D, D to E site, and E to F position, are 0.57 eV, 0.25 eV and 0.24 eV, respectively. The Li diffusion for the second nearest neighbor Li (from C to D site) is more difficult in Ni-doped SnO2 than in the pure SnO2. The adsorption energies of Li at C position for pure SnO2, Ni-doped SnO2 and Ni–N co-doped SnO2 are −1.28 eV, −3.52 eV and −2.56 eV, respectively. The results show that lithium is energetically able to adsorb on C site for Ni-doped SnO2, and Li diffusion barrier (from C to D site) as shown in Fig. 5(a) would increase because of a strong Li adsorption. Above results indicates that although the electronic conductivity of SnO2 can be improved by Ni doping, the ionic conductivity was reduced when one Sn atom was replaced by one Ni atom because of a stronger Li adsorption at C site for Ni-doped SnO2. Therefore, it is not beneficial to improve the electrochemical properties of SnO2 as anode material for LIBs. However, for Ni–N co-doped SnO2, the diffusion energy of Li from C to D position is 0.22 eV. It almost is the same as that of the pure SnO2. Meanwhile, the energy barriers of Li (from B to C) just described above in the Ni–N co-doped SnO2 are 0.12 eV.
The ionic conductivity of SnO2 was enhanced by Ni–N co-doping. Therefore, both the electronic and ionic conductivity of SnO2 can be improved by Ni– N co-doping. It illustrates that Ni–N co-doping in the pure SnO2 is energetically favorable to promote the rate performance of SnO2.
4. Conclusions
In conclusion, Ni–N co-doping in the pure SnO2 is energetically favorable to improve both the electronic and ionic conductivity. The results calculated that the band gaps of Ni-doped and Ni–N co-doped SnO2 are 1.07 eV and 0.94 eV, which both are smaller than the value 0.24 eV of the pure SnO2. The diffusion energy barrier of Li from C to D for Ni-doped SnO2 is 0.57 eV larger than the value 0.24 eV for SnO2. However, the diffusion energy barrier of Li from B to C for Ni–N co-doped SnO2 is 0.12 eV smaller than the value 0.24 eV for SnO2. Meanwhile, the diffusion energy barriers of Li along pathways far from the nearest neighbor path for Ni–N co-doped SnO2 is almost the same as 0.24 eV for SnO2. Our results demonstrates that the electronic and ionic conductivity of SnO2 can be promoted by Ni–N co-doping, and provides a theoretical explanation to enhance the rate property of SnO2 by Ni–N co-doping.Conflicts of interest
There are no conflicts to declare.Acknowledgements
This work is supported by the Fund Project of Chengdu Technological University under Grant No. 2020RC004.References
- D. Guo and C. Hu, Appl. Surf. Sci., 2012, 258, 6987–6992 CrossRef CAS.
- D. W. Kim, I. S. Hwang, S. J. Kwon, H. Y. Kang, K. S. Park, Y. J. Choi, K. J. Choi and J. G. Park, Nano Lett., 2007, 7, 3041–3045 CrossRef CAS PubMed.
- J. W. Deng, C. L. Yan, L. C. Yang, S. Baunack, S. Oswald, H. Wendrock, Y. F. Mei and O. G. Schmidt, ACS Nano, 2013, 7, 6948–6954 CrossRef CAS PubMed.
- Z. Lu, Z. Kong, L. Jing, T. Wang, X. Liu, A. Fu, P. Guo, Y.-G. Guo and H. Li, Energy Fuels, 2020, 34, 13126–13136 CrossRef CAS.
- Q. Yao, C. Huang, Y. Yuan, Y. Liu, S. Liu, K. Deng and E. Kan, J. Phys. Chem. C, 2015, 119, 6923–6928 CrossRef CAS.
- L. Miao, J. Wu, J. Jiang and P. Liang, J. Phys. Chem. C, 2013, 117, 23–27 CrossRef CAS.
- F. R. Sensato, L. Gracia, A. Beltrán, J. Andrés and E. Longo, J. Phys. Chem. C, 2012, 116, 16127–16137 CrossRef CAS.
- X. Fan, W. T. Zheng and J. L. Kuo, ACS Appl. Mater. Interfaces, 2012, 4, 2432–2438 CrossRef CAS PubMed.
- F. Li, G. Wang, D. Zheng, X. Zhang, C. J. Abegglen, H. Qu and D. Qu, ACS Appl. Mater. Interfaces, 2020, 12, 19423–19430 CrossRef CAS PubMed.
- R. Li, S. Nie, C. Miao, Y. Xin, H. Mou, G. Xu and W. Xiao, J. Colloid Interface Sci., 2022, 606, 1042–1054 CrossRef CAS PubMed.
- H. Mou, Y. Xin, C. Miao, S. Nie, S. Chen and W. Xiao, Electrochim. Acta, 2021, 397, 139286 CrossRef CAS.
- C. Wei, G. Zhang, Y. Bai, D. Yan, C. Yu, N. Wan and W. Zhang, Solid State Ionics, 2015, 272, 133–137 CrossRef CAS.
- X. K. Wang, Z. Q. Li, Z. W. Zhang, Q. Li, E. Y. Guo, C. X. Wang and L. W. Yin, Nanoscale, 2015, 7, 3604–3613 RSC.
- N. Wan, T. T. Zhao, S. W. Sun, Q. Wu and Y. Bai, Electrochim. Acta, 2014, 143, 257–264 CrossRef CAS.
- N. Wan, P. Yu, S. Sun, Q. Wu, T. Li and Y. Bai, Mater. Lett., 2014, 133, 168–170 CrossRef CAS.
- X. Wang, X. Cao, L. Bourgeois, H. Guan, S. Chen, Y. Zhong, D.-M. Tang, H. Li, T. Zhai, L. Li, Y. Bando and D. Golberg, Adv. Funct. Mater., 2012, 22, 2682–2690 CrossRef CAS.
- X. W. Liu, D. H. Teng, T. Li, Y. H. Yu, X. H. Shao and X. P. Yang, J. Power Sources, 2014, 272, 614–621 CrossRef CAS.
- N. Wan, X. Lu, Y. Wang, W. Zhang, Y. Bai, Y. S. Hu and S. Dai, Sci. Rep., 2016, 6, 18978 CrossRef CAS PubMed.
- Y. D. Wang, I. Djerdj, B. Smarsly and M. Antonietti, Chem. Mater., 2009, 21, 3202–3209 CrossRef CAS.
- Y. Feng, C. Bai, K. Wu, H. Dong, J. Ke, X. Huang, D. Xiong and M. He, J. Alloys Compd., 2020, 843, 156085 CrossRef CAS.
- A. Vázquez-López, D. Maestre, J. Ramírez-Castellanos, J. M. González-Calbet, I. Píš, S. Nappini, N. Yuca and A. Cremades, J. Phys. Chem. C, 2020, 124, 18490–18501 CrossRef.
- B. Liang, J. Wang, S. Zhang, X. Liang, H. Huang, D. Huang, W. Zhou and J. Guo, Appl. Surf. Sci., 2020, 533, 147447 CrossRef CAS.
- N. Troullier and J. L. Martins, Phys. Rev. B, 1991, 43, 1993–2006 CrossRef CAS PubMed.
- J. P. Perdew, K. Burke and M. Ernzerhof, Phys. Rev. Lett., 1996, 77, 3865–3868 CrossRef CAS PubMed.
- J. Haines and J. M. Leger, Phys. Rev. B, 1997, 55, 11144–11154 CrossRef CAS.
- Q. Sun, Q. Wang, P. Jena and Y. Kawazoe, J. Am. Chem. Soc., 2005, 127, 14582–14583 CrossRef CAS PubMed.
- J. Shi, Int. J. Electrochem. Sci., 2016, 11, 9067–9073 CrossRef CAS.
- S. S. Pan, S. Wang, Y. X. Zhang, Y. Y. Luo, F. Y. Kong, S. C. Xu, J. M. Xu and G. H. Li, Appl. Phys. A, 2012, 109, 267–271 CrossRef CAS.
- S. N. Matussin, A. L. Tan, M. H. Harunsani, A. Mohammad, M. H. Cho and M. M. Khan, Mater. Chem. Phys., 2020, 252, 123293 CrossRef CAS.
- O. Mounkachi, E. Salmani, M. Lakhal, H. Ez-Zahraouy, M. Hamedoun, M. Benaissa, A. Kara, A. Ennaoui and A. Benyoussef, Sol. Energy Mater. Sol. Cells, 2016, 148, 34–38 CrossRef CAS.
- W. Dong, X. Xie, J. Jia, H. Du, L. Zhong, Z. Liang and P. Han, Electrochim. Acta, 2014, 132, 307–314 CrossRef CAS.
- V. Golovanov, V. Golovanova and T. T. Rantala, J. Phys. Chem. Solids, 2016, 89, 15–22 CrossRef CAS.
- J. Jia, W. Zhang, Z. Liang, X. Zhang, C. Fan and P. Han, Phys. B, 2012, 407, 1985–1989 CrossRef CAS.
- M. Behtash, P. H. Joo, S. Nazir and K. Yang, J. Appl. Phys., 2015, 117, 175101 CrossRef.
| This journal is © The Royal Society of Chemistry 2022 |

