DOI:
10.1039/D2RA01049F
(Paper)
RSC Adv., 2022,
12, 12702-12709
Bimetallic CoCu-ZIF material for efficient visible light photocatalytic fuel denitrification
Received
17th February 2022
, Accepted 19th April 2022
First published on 26th April 2022
Abstract
Effective design of photocatalysts is an effective method to improve the separation of photogenerated carriers, which improves the photocatalytic performance of photocatalysts. In this work, CoCu-ZIF materials with bimetallic structure were synthesized at room temperature for efficient photocatalytic fuel denitrification. The properties and structures of CoCu-ZIF photocatalysts can be effectively controlled by adjusting the molar ratio of cobalt to copper. The as-prepared CoCu-ZIF photocatalysts were characterized by XRD, FT-IR, SEM, TEM, UV-vis, Raman, BET and other techniques. The photoactivity of CoCu-ZIF for the denitrogenation of NCCs has been evaluated using visible light (λ ≥ 420 nm). The results indicate that Co8Cu2-ZIF photocatalysts exhibit excellent photocatalytic properties, in which the denitrification rate almost reached 80% after 4 hours under visible light irradiation, which is higher than the degradation ability of ZIF-67 (38%). Transient photoelectrochemical experiments and EIS Nyquist plots indicate that Co8Cu2-ZIF with unique structure efficiently improves the separation and transfer of photogenerated electron–hole pairs. Moreover, a possible reaction mechanism was proposed by LC-MS analysis.
Introduction
With the rapid development of the world, the human demand for energy is also increasing, especially for low-cost natural energy such as oil, coal and gas.1,2 However, nitrogen-containing compounds (NCCs) in fuels (gasoline and diesel), such as pyridine and pyrrole, will lead to NOx emission, reduction of combustion efficiency and increase of CO and particulate emissions during combustion.3–5 Specifically, NOx produced by fuel combustion will lead to acid rain, corrode buildings and crops, and change the pH value of soil and rivers.6 Moreover, NOx will also seriously impact human health, such as through respiratory diseases and nervous system diseases.7,8 Therefore, more and more strict environmental regulations have been formulated for the nitrogen content in fuels worldwide.9,10
Currently, NCCs in fuel are usually removed by hydrodenitrification (HDN), which consumes expensive hydrogen and requires high temperature (range from 300 to 400 °C) and high-pressure conditions (range from 30 to 130 atmospheres).11,12 The process is not economical. Photocatalysis technology is a kind of technology with low energy consumption and mild conditions, which has attracted significant attention.13–15 At present, researchers focus on the use of semiconductor catalysts for photocatalytic removal of NCCs.16 Although some semiconductors have narrow band gaps and are promising photocatalysts, their photocatalytic efficiency is low due to high recombination rate of photogenerated carriers and low specific surface area.17 For example, Weineng Hu et al. synthesized CdS for the degradation of NCCs in fuel (64%, 4 h)18 and Bi2MoO6 (51%, 4 h).19 Considering the high specific surface area and excellent photogenerated carrier transport properties, porous nanostructures are deemed to be the key structures of photocatalytic materials.20
Metal–organic framework materials (MOFs) have the characteristics of high specific surface area, regular pore structure, good chemical stability and convenient synthesis,21,22 so they are widely used in adsorption and separation,23 gas storage, catalytic reaction (including chemical catalysis,24,25 electrocatalysis26,27 and photocatalysis,28 sensors,29 electronic or optical devices29 and so on). Meanwhile, the high specific surface area of MOFs can also improve the adsorption of target pollutants and increase the number of active sites,30,31 which has obvious application potential to improve the photocatalytic performance of semiconductors. Furthermore, compared with traditional inorganic semiconductors, it is noteworthy that the structures and functionalities of MOFs can be readily tuned via the modification of their organic linkers or metal centers.32 ZIFs are excellent photocatalytic material, which has been applied in many fields.33,34 For example, ZIF-67 (Co) is a typical Co-based ZIF with high pore volume and specific surface area.35 Changli Shi et al.36 synthesized Ag/ZIF-67/TiO2/Cu sheet, which displayed greatly enhanced photocatalytic activity for the degradation of 4-ATP (∼100%, 15 min). Interestingly, the catalyst containing copper has strong adsorption for nitrogen-containing compounds. Yang Xu et al.37 synthesised 3% CuO/NaY zeolite that could adsorb 75 percent of N-nitropyrrolidine (NPYR). However, single metal ZIF (Cu) are harder to synthesize. At present the modification of metal elements of ZIFs has become a research hotspot, hoping to make up for the defects of single metal ZIFs.38,39 Bimetallic ZIFs can optimize the energy conversion mechanism by virtue of the synergy between bimetallic elements. Herein, CoCu bimetallic ZIF was prepared by introducing Cu and used for photocatalytic fuel denitrification. Compared with ZIF-67, the prepared CoCu bimetallic ZIF showed excellent photocatalytic fuel denitrification activity. In this study, bimetallic ZIF was used as photocatalytic fuel denitrification catalyst for the first time.
Experimental
Materials and reagents
Cobalt nitrate hexahydrate [Co(NO3)2·6H2O], copper nitrate trihydrate [Cu(NO3)2·3H2O], cetyltrimethylammonium bromide (CTAB), pyridine and octane were supplied by Aladdin Reagent Co., Ltd. All chemical reagents are of analytical grade and used as received.
Synthesis of CoCu-ZIF
In a typical synthetic procedure, 2-methylimidazole (4.105 g, 50 mmol) was dissolved in 70 mL distilled (DI) water. While Co(NO3)2·6H2O (232.8 mg, 0.8 mmol), Cu(NO3)2·3H2O (48.3 mg, 0.2 mmol) and CTAB (7.5 mg, 0.02 mmol) were dissolved in 10 mL DI water. Then the two solutions were mixed and kept at room temperature for 24 h after stirring for 1 h. The final sample was collected by centrifugation at 10![[thin space (1/6-em)]](https://www.rsc.org/images/entities/char_2009.gif) 000 rpm for 10 min, washed several times with ethanol, and dried under vacuum at 60 °C for 12 h. The obtained sample was Co8Cu2-ZIF.
000 rpm for 10 min, washed several times with ethanol, and dried under vacuum at 60 °C for 12 h. The obtained sample was Co8Cu2-ZIF.
Changing the molar ratio of cobalt to copper, we can get ZIF-67 (10:0), Co9Cu1-ZIF (9:1), Co7Cu3-ZIF (7:3), Co6Cu4-ZIF (6:4), Co5Cu5-ZIF (5:5), respectively.
Characterizations
X-ray diffraction (XRD) patterns were obtained using a Bruker D8 Advance X-ray diffractometer. Fourier-transform infrared reflectance (FT-IR) spectra were measured using a Shimadzu irprestige-21 spectrophotometer. The morphology of the prepared samples was evaluated using a TESCAN MIRA4 field emission scanning electron microscopy (SEM) instrument, Tecnai G2 F20 S-TWIN (FEI) transmission electron microscopy (TEM) apparatus. The X-ray photoelectron spectroscopy (XPS) profiles of the samples were obtained using a Thermo Scientific K-Alpha instrument equipped with a monochromatic Al Lα X-ray source. The UV-Vis diffuse reflectance spectra (DRS) of the samples were obtained using a Shimadzu UV-2700 ultraviolet-visible-near-infrared spectrophotometer over the wavelength range of 250–800 nm. High-performance liquid chromatography-mass spectrometry (HPLC-MS) experiments were performed using an Agilent 1200 series system, equipped with an Agilent Zorbax Eclipse XDB-C18 column (2.1 mm × 100 mm × 3.5 m). Photocurrent measurements were conducted using a BAS Epsilon workstation. Electrochemical impedance spectroscopy (EIS) experiments were conducted using a Precision PARC workstation.
Photocatalytic activity measurements
First, 100 μg g−1 simulated NCCs-containing gasoline fuel was prepared by dissolving 70 mg pyridine in 1.0 L octane. Then, 50 mg photocatalyst and 50 mL pyridine/octane solution (100 μg g−1) were added into a quartz reactor. The suspension was stirred in the dark for 1.5 h to ensure the adsorption–desorption equilibrium was reached. Afterward, the suspensions were irradiated using a 300 W Xe lamp (PLS-SXE 300) equipped with a UV-cut filter to cut off light of wavelength shorter than 420 nm. At selected time intervals, aliquots of the suspension were removed and centrifuged. The residual concentration of pyridine in the supernatant was monitored using a Varian Cary 60 spectrometer.
Results and discussion
Structural and morphological characterization
XRD analysis was used to determine the crystal structures of the as-prepared samples. The XRD patterns of photocatalysts with different molar ratio of CoCu-ZIFs were shown in Fig. 1(a). The characteristic peaks of prepared ZIF-67 appeared at 7.3°, 10.4°, 12.7°, 18.0°, 22.1°, 24.6°, 26.7° could be attributed to the (011), (002), (112), (222), (114), (233) and (134) reflections were identified with simulated ZIF-67.40 In addition, the XRD pattern of CoCu-ZIFs are similar to that of ZIF-67, which indicated that the addition of copper had almost no effect on crystallinity. However, one can see that the characteristic peaks show systematic shifts toward low angles as an increase in the copper content in CoCu-ZIFs, see Fig. 1(b), consistent with the fact that the ionic radius of Co2+ is larger than that of Cu2+.41
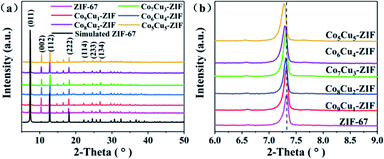 |
| | Fig. 1 X-ray diffraction patterns of ZIF-67 and CoCu-ZIFs (a), and the enlarged regions of the XRD patterns (b). | |
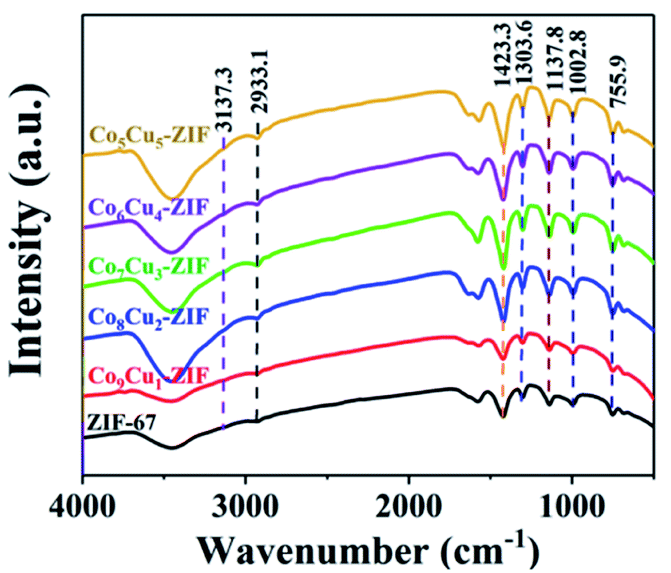
The structures and chemical bonds of different samples were studied by Fourier transform infrared spectroscopy (FT-IR). The peaks were primarily attributed to the 2-methylimidazole ligand. As is illustrated in Fig. 2, for the Co10Cu0-ZIF (ZIF-67), the peaks ranging from 600–1500 cm−1 were due to the stretching and bending of the imidazole group. A minor peak at 1423.3 cm−1 was owing to the stretching mode of C![[double bond, length as m-dash]](https://www.rsc.org/images/entities/char_e001.gif) N bonding in 2-MIM. The peaks obtained at 2933.1 and 3137.3 cm−1 were attributed to the stretching of C–H from the aliphatic methyl group and aromatic ring of 2-MIM, respectively. The positions of peaks correspond well with the published report.42 As expected, the composite CoCu-ZIFs contain all the chemical bonds belong to ZIF-67. The result further confirmed the successful preparation of CoCu-ZIFs and maintained the structure integrity of ZIF-67 in this composite.43
N bonding in 2-MIM. The peaks obtained at 2933.1 and 3137.3 cm−1 were attributed to the stretching of C–H from the aliphatic methyl group and aromatic ring of 2-MIM, respectively. The positions of peaks correspond well with the published report.42 As expected, the composite CoCu-ZIFs contain all the chemical bonds belong to ZIF-67. The result further confirmed the successful preparation of CoCu-ZIFs and maintained the structure integrity of ZIF-67 in this composite.43
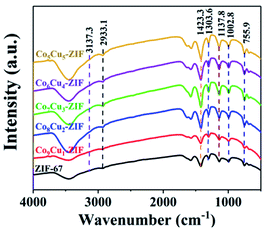 |
| | Fig. 2 FT-IR pattern of CoCu-ZIFs and ZIF-67. | |
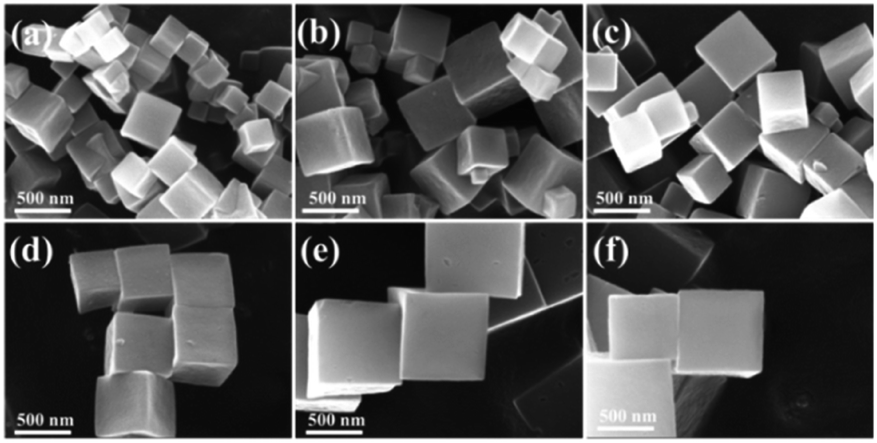
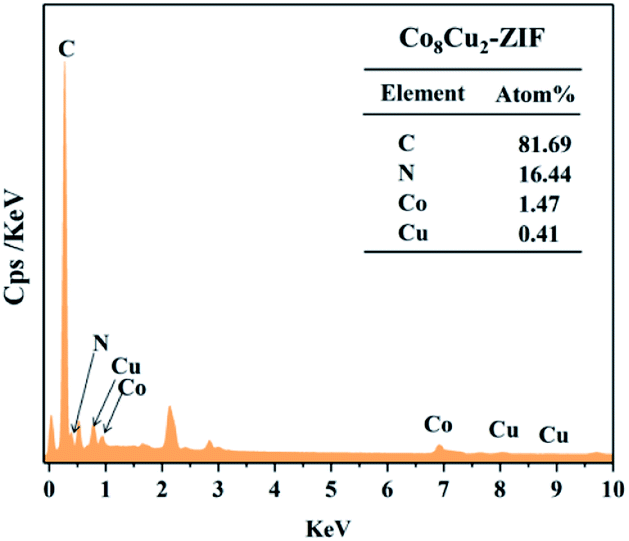
The morphologies and structures of CoCu-ZIFs and ZIF-67 were characterized using SEM and TEM. The SEM images of CoCu-ZIFs and ZIF-67 (Fig. 3(a)–(f)) shows dispersed and uniform cubic morphology with an average diameter of 450 nm and a smooth surface. Furthermore, with the increase of copper content, there were not many discernible differences in morphology. The EDS spectrums (Fig. 4) verify the presence of elements N, C, Co, Cu in bimetal CuCo-ZIF.
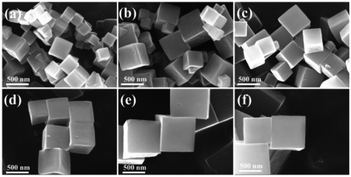 |
| | Fig. 3 SEM images of (a) ZIF-67, (b) Co9Cu1-ZIF, (c) Co8Cu2-ZIF, (d) Co7Cu3-ZIF, (e) Co6Cu4-ZIF, (f) Co5Cu5-ZIF. | |
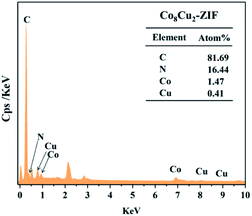 |
| | Fig. 4 EDS spectrum of Co8Cu2-ZIF. | |
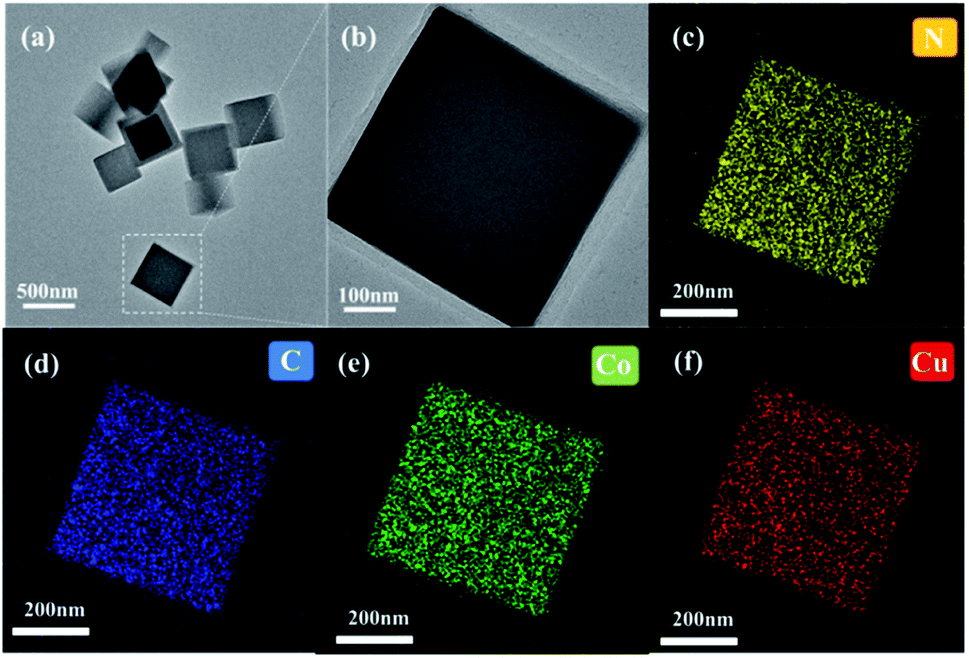
To obtain further information about the microstructure of the CoCu-ZIF composite, TEM analyses were performed. As shown in Fig. 5, the introduction of Cu(II) has no significant impact on the morphology of ZIF-67. The EDS elemental mapping indicates the equal distribution of Cu, Co, C and N in the CoCo-ZIF. What's more, copper is randomly substituted for cobalt to ensure the uniformity and stability of the CoCu-ZIF.
 |
| | Fig. 5 Transmission electron microscopy images of (a and b) Co8Cu2-ZIF, and (c–f) EDS mapping of Co8Cu2-ZIF. | |
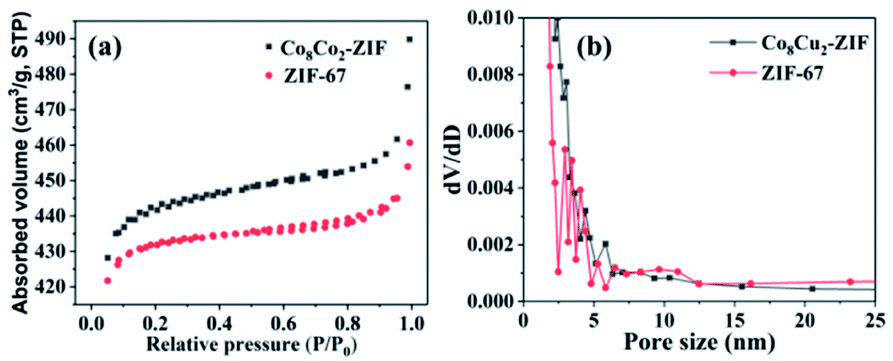
In order to further explore the specific surface area and pore size distribution, nitrogen adsorption/desorption experiments were carried out. The N2 adsorption/desorption isotherms of CoCu-ZIFs samples are shown in Fig. 6. The corresponding BET specific surface areas and pore volumes are summarized in Table 1. As shown in Fig. 6(a), ZIF-67 and Co8Cu2-ZIF belonged to I type adsorption behaviour. The BET surface areas for the ZIF-67 and Co8Cu2-ZIF are 1493.24 m2 g−1 and 1834.71 m2 g−1, respectively (Table 1). Obviously, The BET surface area of Co8Cu2-ZIF is larger than that of ZIF-67. A high BET surface area might be beneficial for providing more active sites, hence could lead to enhanced photocatalytic performance.27,44 From the corresponding pore size distributions of Fig. 6(b), more mesopores with increased pore sizes are generated with the introduction of Cu.
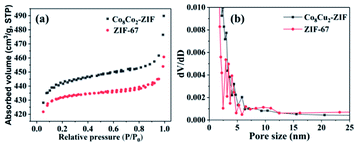 |
| | Fig. 6 (a) N2 adsorption/desorption isotherms distribution curves and (b) pore size distribution curves of Co8Cu2-ZIF and ZIF-67. | |
Table 1 BET surface areas and pore volumes of Co8Cu2-ZIF and ZIF-67
| Sample |
BET surface area (m2 g−1) |
Pore volume (cm3 g−1) |
| Co8Cu2-ZIF |
1834.71 |
0.788 |
| ZIF-67 |
1493.24 |
0.713 |
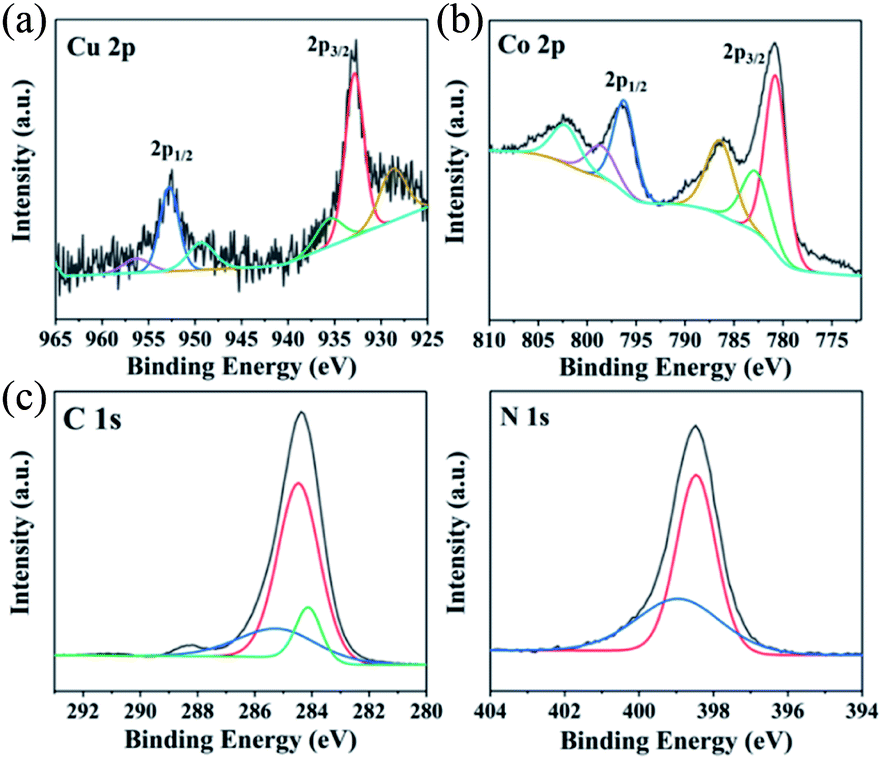
XPS measurements were used to determine the elements and valence states of Co8Cu2-ZIF. To get clearer information, the high-resolution XPS spectra analysis was carried out. The Cu 2p's high-resolution XPS spectrum is shown in Fig. 7(a). It can be realized that peaks centered at 932.51 eV was related to Cu 2p3/2 and peak at 953.71 eV was related to Cu 2p1/2 of Cu(II). Fig. 7(b) was the high-resolution XPS spectrum extracted from Co 2p. The main two peaks were centered at 779.01 eV and 796.31 eV, which can be appointed to the binding energies of 2p3/2 and 2p1/2 of Co(II). As can be seen from the high-resolution spectrum of C 1s in Fig. 7(c), peaks centered at 284.1 and 284.58 are attributed to C–C and C–N bonds in CuCo-ZIF. Also, the peak located at 298.48 represented the tertiary N bonded to carbon atoms.45 These results further proved that the chemical component of as-fabricated products was CuCo-ZIF.
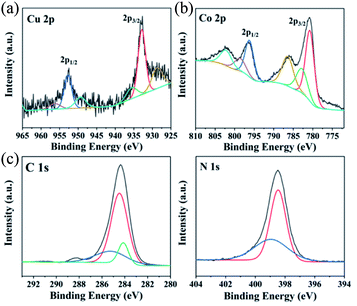 |
| | Fig. 7 High resolution XPS spectra of (a) Cu 2p, (b) Co 2p, (c) C 1s, and N 1s for Co8Cu2-ZIF. | |
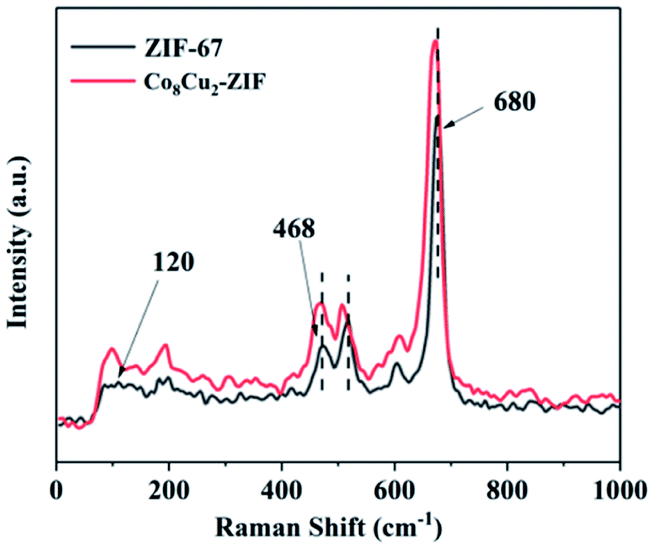
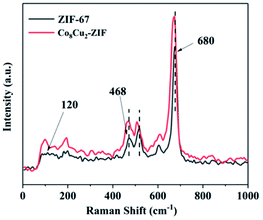
The structure samples were further investigated by Raman spectrum, as shown in Fig. 8. A peak can be observed in the Raman shift region at 120 cm−1, which can be attributed to cobalt ions of ZIF-67.46 The peaks at 468, 680 cm−1 were associated to ZIF-67, which vibrational mode of the 2-methylimidazolate ligand at 680 cm−1 and Co–N bond at 468 cm−1.47 It was noticeable that some peaks of Co8Cu2-ZIF were shifted comparing to the ZIF-67.48 The spectrum of Co8Cu2-ZIF is similar to ZIF-67's, further proving the good retention of ZIF-67 structure in the Co8Cu2-ZIF.
 |
| | Fig. 8 Raman spectra of ZIF-67 and Co8Cu2-ZIF. | |
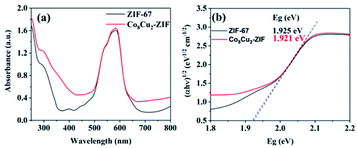
UV-Vis DRS spectra suggested that all CoCu-ZIF samples exhibited strong visible light absorption (Fig. 9). The band gap energies of the photocatalysts in this study were calculated using the Kubelka–Munk formula: αhν = A(hν − Eg)η/2, where α, h, ν, A, and Eg are the absorption coefficient, the Planck constant, the frequency of light, a constant, and the absorption band gap energy, respectively. The value of η depends on the optical transition type of the semiconductor photocatalyst, and η = 1 for the systems in our study because ZIF-67 is indirect band gap semiconductor.45 The introduction of copper changed the sample from purple to blue purple. The approximative band gaps of ZIF-67, Co8Cu2-ZIF were 1.925 eV and 1.921 eV. The band gap decreased as the content of copper increased, The reduction of the band gap of CoCu-ZIF can be attributed to the formation of a new energy level in the band structure of CoCu-ZIF since chemical bonds between ZIF-67(Co) and Cu(II) may have created.49
 |
| | Fig. 9 UV-vis DRS spectra (a) and energy band gaps (Eg) (b) of samples. | |
Photocatalytic performance
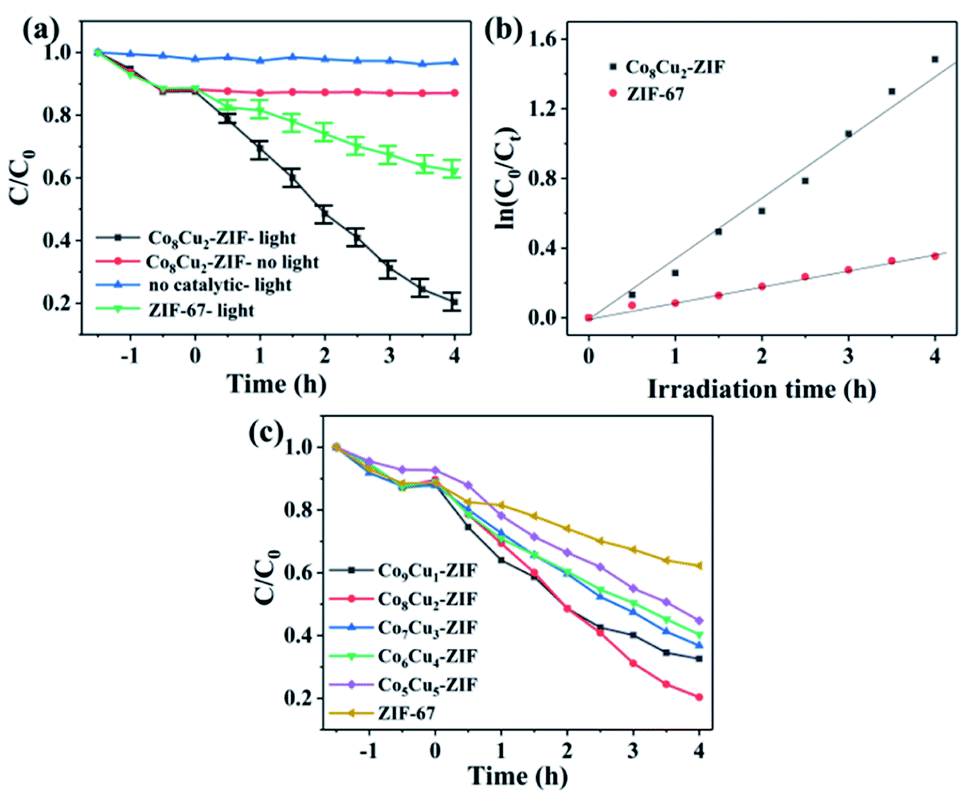
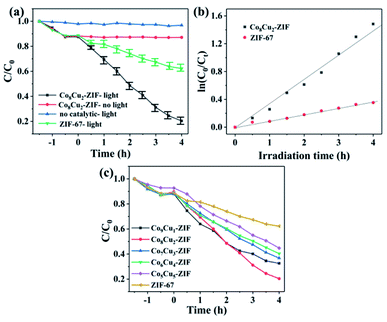
The photoactivity of CoCu-ZIF for the denitrogenation of NCCs have been evaluated using visible light (λ ≥ 420 nm). As illustrated in Fig. 10, Co8Cu2-ZIF exhibited excellent catalytic performance (80%), however, there is rarely catalytic activity without light. Fig. 9(a) also displayed the comparison of the pyridine denitrogenation efficiencies of Co8Cu2-ZIF (80%) and ZIF-67 (38%). The reaction kinetics data for the pyridine photo–denitrogenation reaction are displayed in Fig. 9(b). The rate constants of Co8Cu2-ZIF and ZIF-67 were calculated to be 0.348 and 0.091 h−1, respectively. Sample Co8Cu2-ZIF presented the highest photoactivity. Significantly, the rate constant of Co8Cu2-ZIF was 3.82 times higher than ZIF-67. Fig. 9(c) shows photocatalytic denitrogenation of pyridine over CoCu-ZIFs, Co8Cu2-ZIF has the best photoactivity, obviously. The higher photoactivity of Co8Cu2-ZIF could be attributed to: (i) The introduction of copper improves the utilization of light; (ii) Compared with ZIF-67, Co8Cu2-ZIF has larger specific surface area, exposes more active sites and reduces carrier recombination; (iii) Appropriate copper cobalt ratio is conducive to synergistic effect.
 |
| | Fig. 10 (a) Photocatalytic denitrogenation of pyridine under different conditions, (b) kinetics of photocatalytic denitrogenation of pyridine over Co8Cu2-ZIF and ZIF-67, (c) photocatalytic denitrogenation of pyridine over CoCu-ZIFs. | |
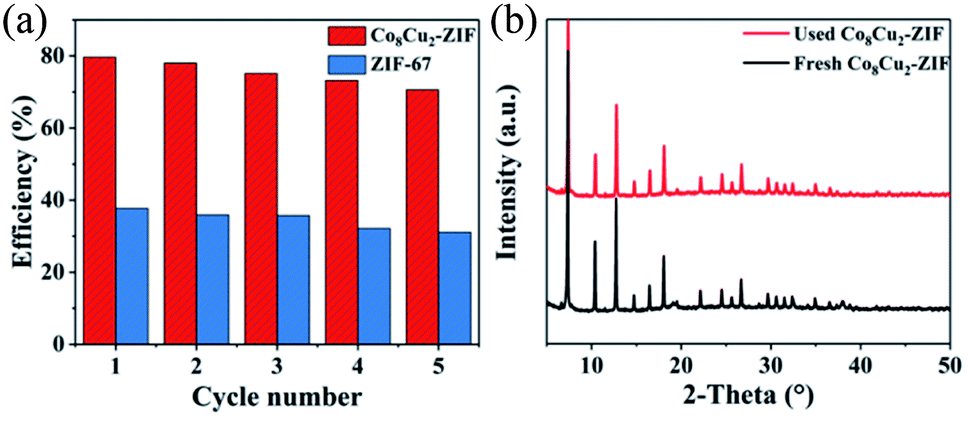
The stability and recyclability of catalyst
To study the stability of Co8Cu2-ZIF, the cycling test was conducted in five consecutive runs (Fig. 11(a)). The denitrogenation efficiencies after 5 run still was 71%, with slightly decreasing of 9%. The insignificant reduction of catalytic activity is a common phenomenon during cycling tests, which may be due to the leaching and poisoning of active constituent in catalysts.50 Notably, the Co8Cu2-ZIF still remained relatively high catalytic activity after five consecutive runs, suggesting this material may be suitable for industrial use. Furthermore, the XRD patterns of the fresh and used Co8Cu2-ZIF composites are illustrated in Fig. 11(b). The XRD results revealed that the characteristic peaks of the Co8Cu2-ZIF composites did not exhibit any significant changes after five cycles.
 |
| | Fig. 11 (a) Cycling experiments of photocatalytic denitrogenation of pyridine over Co8Cu2-ZIF, (b) XRD patterns of fresh Co8Cu2-ZIF and used Co8Cu2-ZIF recovered after five cycles of photocatalysis. | |
Photocatalytic mechanism
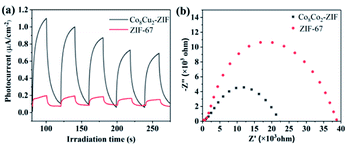
To further appraise the separation efficiency of the photogenerated electron–hole pairs, transient photoelectrochemical experiments were performed. As shown in Fig. 12(a), the photocurrent density of Co8Cu2-ZIF was significantly higher than ZIF-67 under the experimental conditions in this study, during five on–off cycles, which indicated that Co8Cu2-ZIF presented lower photogenerated electron–hole recombination rate and higher electron transport than ZIF-67.51 While photocurrent decay attributable to photo-corrosion can be observed during five on–off cycles. It may be caused by the leaching of some metal ions.52 Moreover, to better understand the excellent charge carrier transmission performance of Co8Cu2-ZIF, EIS Nyquist plots have been obtained (Fig. 12(b)). The Nyquist plot radius of Co8Cu2-ZIF was smaller than ZIF-67, which revealed that Co8Cu2-ZIF exhibited better separation of its electron–hole pairs and more photogenerated charge carries than ZIF-67, and, consequently, it presented higher photocatalytic fuel denitrification performance.53,54
 |
| | Fig. 12 (a) Nyquist impedance plots of Co8Cu2-ZIFs and ZIF-67, (b) transient photocurrent responses of Co8Cu2ZIFs and ZIF-67 using visible light (λ ≥ 420 nm). | |
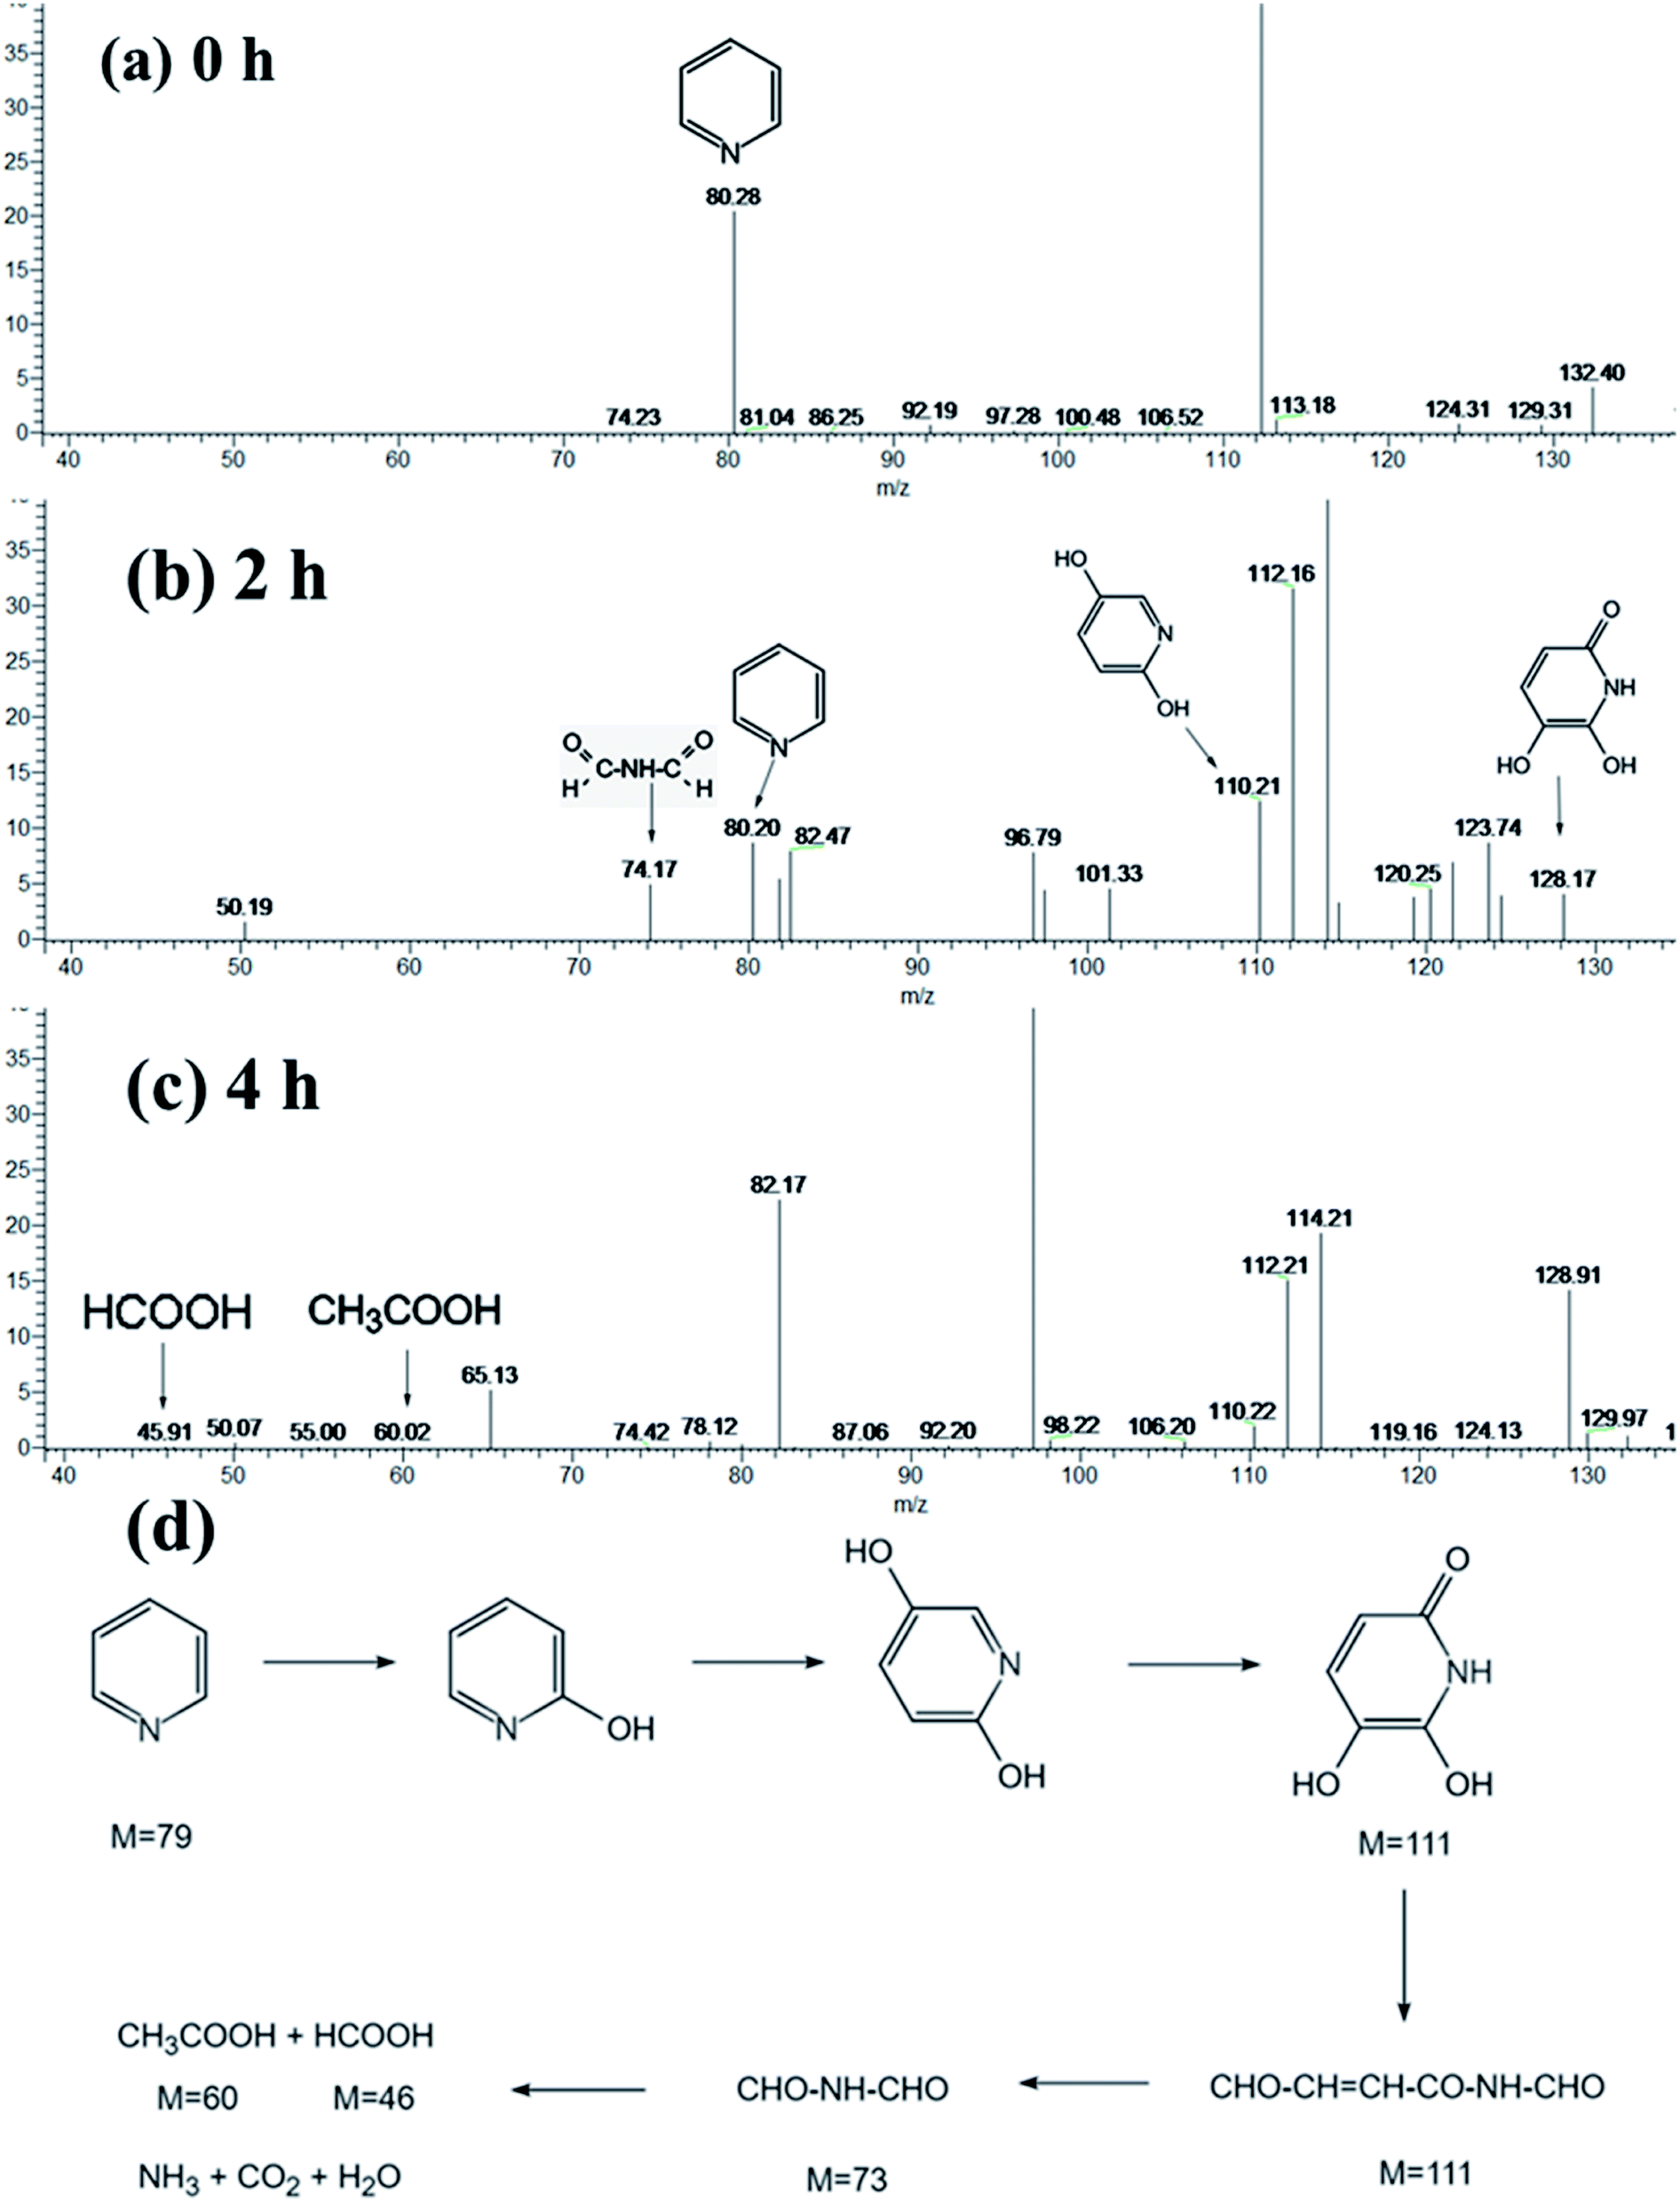
The HPLC-MS spectrometry results are displayed in Fig. 13(a)–(c). Upon irradiation for 240 min, the peak intensity of pyridine at approximately m/z = 80.28 was greatly decreased, compared Fig. 13(a) and (c), which implied the successful denitrogenation of pyridine. At the same time, two new peaks at m/z = 74.17, and 112.16 gradually appeared (Fig. 13(b)), which suggested that pyridine has been transformed into C2H2ONH and C5H5O2N, which are protonated intermediate products. Furthermore, the possible denitrogenation pathway of pyridine is illustrated in Fig. 13(d)
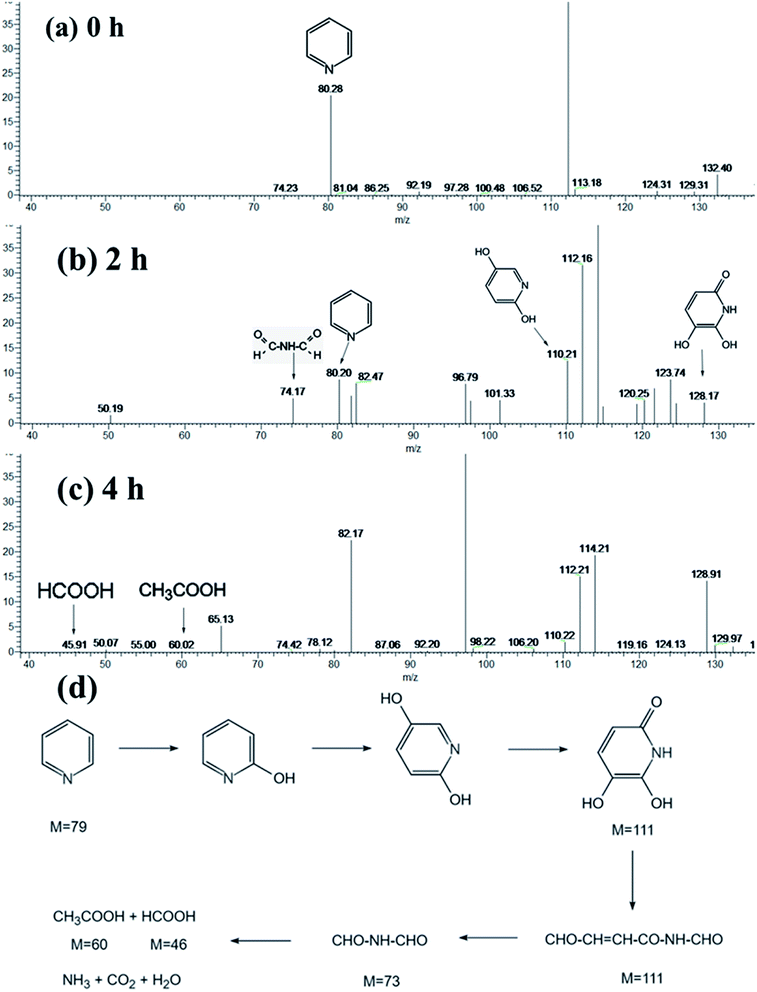 |
| | Fig. 13 High-performance liquid chromatography-MS profiles of pyridine after different irradiation times: (a) 0, (b) 2 h and (c) 4 h, and (d) possible denitrogenation pathway of pyridine. | |
Conclusion
Containing copper doped CoCu-ZIFs can be obtained by solvent method at room temperature. CoCu-ZIFs still maintain uniform cube morphology. Ultraviolet-visible spectra supported that Co8Cu2-ZIF samples presented greater light-harvesting ability than ZIF-67 in the visible light. What's more, compared to the ZIF-67, the Co8Cu2-ZIF sample presented significantly higher performance for the photocatalytic denitrogenation of pyridine (∼80%, 4 h) using visible light (λ ≥ 420 nm), which was beneficial for the separation and transfer of the photogenerated electron–hole pairs and absorption of light. Due to the fact that the atomic radius of copper is similar to that of cobalt and dispersion uniformity of copper in CoCu-ZIF, the Co8Cu2-ZIF sample also displayed excellent stability and reproducibility. Under the catalysis of Co8Cu2-ZIF, pyridine was finally transformed into harmless small molecules. At last, this work could provide a strategy toward the design of low-cost, highly efficient photocatalytic fuel denitrification using ZIFs as promising precursors.
Conflicts of interest
There are no conflicts to declare.
Acknowledgements
This work was financially supported by program for National Natural Science Foundation of China (21806085, 22108129), Innovative Research Team in Science and Technology in Fujian Province University, Natural Science Foundation of Fujian Province (2019J05121, 2019J01837, 2021J05253), Research Project of Ningde Normal University (No. 2019T03, 2020FZ08, 2020T01).
References
- S. Delpachitra, K. Hou and S. Cottrell, Energy Econ., 2020, 91, 104846 CrossRef.
- A. Díaz, G. A. Marrero, L. A. Puch and J. Rodríguez, Energy Econ., 2019, 81, 1056–1077 CrossRef.
- L. Wang, D. Xie, Y. Ma, M. Sun, N. Mominou, W. Jiang, C. Shufeng and C. Jing, Fuel Process. Technol., 2021, 216, 106802 CrossRef CAS.
- S. Albersberger, J. Hein, M. W. Schreiber, S. Guerra, J. Han, O. Y. Gutiérrez and J. A. Lercher, Catal. Today, 2017, 297, 344–355 CrossRef CAS.
- R. D. Deese, R. E. Morris, A. E. Metz, K. M. Myers, K. Johnson and T. N. Loegel, Energy Fuels, 2019, 33, 6659–6669 CrossRef CAS.
- V. A. Kirillov, E. I. Smirnov, Y. I. Amosov, A. S. Bobrin, V. D. Belyaev and V. A. Sobyanin, Kinet. Catal., 2009, 50, 18–25 CrossRef CAS.
- N. E. Paucar, P. Kiggins, B. Blad, K. De Jesus, F. Afrin, S. Pashikanti and K. Sharma, Environ. Chem. Lett., 2021, 19, 1205–1228 CrossRef CAS.
- M. R. Jury, Atmos. Pollut. Res., 2020, 11, 1226–1237 CrossRef CAS.
- C. Yin, Environ. Impact Assess. Rev., 2021, 88, 106551 CrossRef.
- Y. Han, S. Hu, Y. Sun, X. Sun, M. Tan, Y. Xu, J. Tian, R. Li and Z. Shao, Energy Fuels, 2018, 32, 5072–5080 CrossRef CAS.
- S. S. Bello, C. Wang, M. Zhang, H. Gao, Z. Han, L. Shi, F. Su and G. Xu, Energy Fuels, 2021, 35, 10998–11016 CrossRef CAS.
- S. Badoga, P. Misra, G. Kamath, Y. Zheng and A. Dalai, Catalysts, 2018, 8, 645 CrossRef.
- H. Luo, Z. Zeng, G. Zeng, C. Zhang, R. Xiao, D. Huang, C. Lai, M. Cheng, W. Wang, W. Xiong, Y. Yang, L. Qin, C. Zhou, H. Wang, Y. Zhou and S. Tian, Chem. Eng. J., 2020, 383, 123196 CrossRef CAS.
- Y. Qian, F. Zhang and H. Pang, Adv. Funct. Mater., 2021, 31, 2104231 CrossRef CAS.
- V. N. Rao, N. L. Reddy, M. M. Kumari, K. K. Cheralathan, P. Ravi, M. Sathish, B. Neppolian, K. R. Reddy, N. P. Shetti, P. Prathap, T. M. Aminabhavi and M. V. Shankar, J. Environ. Manage., 2019, 248, 109246 CrossRef CAS PubMed.
- R. Huang, R. Liang, H. Fan, S. Ying, L. Wu, X. Wang and G. Yan, Sci. Rep., 2017, 7, 7858 CrossRef PubMed.
- W. Zhan, L. Sun and X. Han, Nano-Micro Lett., 2019, 11, 1 CrossRef CAS PubMed.
- W. Hu, M. Jiang, R. Liang, R. Huang, Y. Xia, Z. Liang and G. Yan, Dalton Trans., 2021, 50, 2596–2605 RSC.
- W. Hu, G. Yan, R. Liang, M. Jiang, R. Huang, Y. Xia, L. Chen and Y. Lu, RSC Adv., 2021, 11, 23288–23300 RSC.
- X. Zhang, C. Li, J. Liang, J. Wang, J. Zhang, X. Chen, F. Wang and R. Li, ChemCatChem, 2020, 12, 1212–1219 CrossRef CAS.
- R. Liang, F. Jing, L. Shen, N. Qin and L. Wu, Nano Res., 2015, 8, 3237–3249 CrossRef CAS.
- J. Meng, X. Liu, C. Niu, Q. Pang, J. Li, F. Liu, Z. Liu and L. Mai, Chem. Soc. Rev., 2020, 49, 3142–3186 RSC.
- M. Davoodi, F. Davar, M. R. Rezayat, M. T. Jafari, M. Bazarganipour and A. E. Shalan, RSC Adv., 2021, 11, 13245–13255 RSC.
- R. Liang, Z. Liang, F. Chen and L. Wu, Chin. J. Catal., 2020, 41, 188–199 CrossRef CAS.
- R. Liang, F. Jing, G. Yan and L. Wu, Appl. Catal., B, 2017, 218, 452–459 CrossRef CAS.
- M. Ying, R. Tang, W. Yang, W. Liang, G. Yang, H. Pan, X. Liao and J. Huang, ACS Appl. Nano Mater., 2021, 4, 1967–1975 CrossRef CAS.
- D. Feng, Y. Cheng, J. He, L. Zheng, D. Shao, W. Wang, W. Wang, F. Lu, H. Dong, H. Liu, R. Zheng and H. Liu, Carbon, 2017, 125, 454–463 CrossRef CAS.
- T. Xia, Y. Lin, W. Li and M. Ju, Chin. Chem. Lett., 2021, 32, 2975–2984 CrossRef CAS.
- P. Gao, R. Liu, H. Huang, X. Jia and H. Pan, RSC Adv., 2016, 6, 94699–94705 RSC.
- Y. Li, K. Zhou, M. He and J. Yao, Microporous Mesoporous Mater., 2016, 234, 287–292 CrossRef CAS.
- B. Luan Tran, H.-Y. Chin, B. K. Chang and A. S. T. Chiang, Microporous Mesoporous Mater., 2019, 277, 149–153 CrossRef CAS.
- J. Qiu, X. Zhang, Y. Feng, X. Zhang, H. Wang and J. Yao, Appl. Catal., B, 2018, 231, 317–342 CrossRef CAS.
- N. Cheng, L. Ren, X. Xu, Y. Du and S. X. Dou, Adv. Energy Mater., 2018, 8, 1801257 CrossRef.
- P. Kukkar, K.-H. Kim, D. Kukkar and P. Singh, Coord. Chem. Rev., 2021, 446, 214109 CrossRef CAS.
- G. Zhong, D. Liu and J. Zhang, J. Mater. Chem. A, 2018, 6, 1887–1899 RSC.
- C. Shi, L. Qin, S. Wu, S.-Z. Kang and X. Li, Chem. Eng. J., 2021, 422, 129970 CrossRef CAS.
- Y. Xu, H.-d. Liu, J. H. Zhu, Z.-y. Yun, J.-h. Xu, Y. Cao and Y.-l. Wei, New J. Chem., 2004, 28, 244 RSC.
- M. A. Mohamud and A. B. Yurtcan, Int. J. Hydrogen Energy, 2021, 46, 33782–33800 CrossRef CAS.
- H. Gao, J. Zang, X. Liu, Y. Wang, P. Tian, S. Zhou, S. Song, P. Chen and W. Li, Appl. Surf. Sci., 2019, 494, 101–110 CrossRef CAS.
- X. Wang, L. Yu, B. Y. Guan, S. Song and X. W. D. Lou, Adv. Mater., 2018, e1801211, DOI:10.1002/adma.201801211.
- R. D. Shannon, Acta Crystallogr., Sect. A: Cryst. Phys., Diffr., Theor. Gen. Crystallogr., 1976, 32, 751–767 CrossRef.
- A. Khan, M. Ali, A. Ilyas, P. Naik, I. F. J. Vankelecom, M. A. Gilani, M. R. Bilad, Z. Sajjad and A. L. Khan, Sep. Purif. Technol., 2018, 206, 50–58 CrossRef CAS.
- H. Gong, X. Zhang, G. Wang, Y. Liu, Y. Li and Z. Jin, Mol. Catal., 2020, 485, 110832 CrossRef CAS.
- Y. Li, X. Li, H. Zhang and Q. Xiang, Nanoscale Horiz., 2020, 5, 765–786 RSC.
- M. Gholinejad, Z. Naghshbandi and J. M. Sansano, Appl. Organomet. Chem., 2020, 34, 5522 CrossRef.
- Z. Yu, L. Qian, T. Zhong, Q. Ran, J. Huang, Y. Hou, F. Li, M. Li, Q. Sun and H. Zhang, Mol. Catal., 2020, 485, 110832 CrossRef.
- K. Zhao, H. Li, S. Tian, W. Yang, X. Wang, A. Pang, C. Xie and D. Zeng, Inorg. Chem. Front., 2019, 6, 715–722 RSC.
- A. Awadallah-F, F. Hillman, S. A. Al-Muhtaseb and H.-K. Jeong, J. Mater. Sci., 2018, 54, 5513–5527 CrossRef.
- Y. Wu, Z. Yue, A. Liu, P. Yang and M. Zhu, ACS Sustainable Chem. Eng., 2016, 4, 2569–2577 CrossRef CAS.
- S. Navalon, M. Alvaro and H. Garcia, Appl. Catal., B, 2010, 99, 1–26 CrossRef CAS.
- X. Men, H. Chen, K. Chang, X. Fang, C. Wu, W. Qin and S. Yin, Appl. Catal., B, 2016, 187, 367–374 CrossRef CAS.
- P. Zhu, X. Yin, X. Gao, G. Dong, J. Xu and C. Wang, Chin. J. Catal., 2021, 42, 175–183 CrossRef CAS.
- D. Liu, Z. Jin, H. Li and G. Lu, Appl. Surf. Sci., 2017, 423, 255–265 CrossRef CAS.
- M. Li, J. Sun, G. Chen, S. Wang and S. Yao, Adv Powder Mater., 2022, 1, 100032 CrossRef.
|
| This journal is © The Royal Society of Chemistry 2022 |
Click here to see how this site uses Cookies. View our privacy policy here. 
 Open Access Article
 This Open Access Article is licensed under a Creative Commons Attribution-Non Commercial 3.0 Unported Licence
 ab,
Jiafeng Laic,
Yuzhou Xia
ab,
Jiafeng Laic,
Yuzhou Xia