 Open Access Article
Investigation of the structural, electrical, and dielectric properties of La0.5Sm0.2Sr0.3Mn1−xCrxO3 for electrical application
Khouloud Abdouli *a,
F. Hassinibc,
W. Cherifa,
P. R. Prezasd,
M. P. F. Graça
 d,
M. A. Valent
 d,
O. Messaoudie,
S. Elgharbif,
Ahmed Dhahrig and
L. Manaie
aSfax University, Faculty of Sciences, B. P. 1171, 3000, Tunisia
bResearch Unit of Valorization and Optimization of Exploitation of Resources, Faculty of Science and Technology of Sidi Bouzid, Kairouan University, 9100 Sidi Bouzid, Tunisia
cLaboratory of Physical Chemistry of Materials, Physics Department, Faculty of Sciences of Monastir, Monastir University, 5019 Monastir, Tunisia
dI3N – University of Aveiro, Aveiro, Portugal
ePhysics Department, College of Sciences, University of Ha'il, Saudi Arabia
fDepartment of Chemistry, College of Science, University of Hail, Ha'il, Kingdom of Saudi Arabia
gDepartment of Physics, College of Science and Humanities - Dawadmi, Shaqra University, Riyadh, Saudi Arabia
First published on 7th June 2022
Abstract
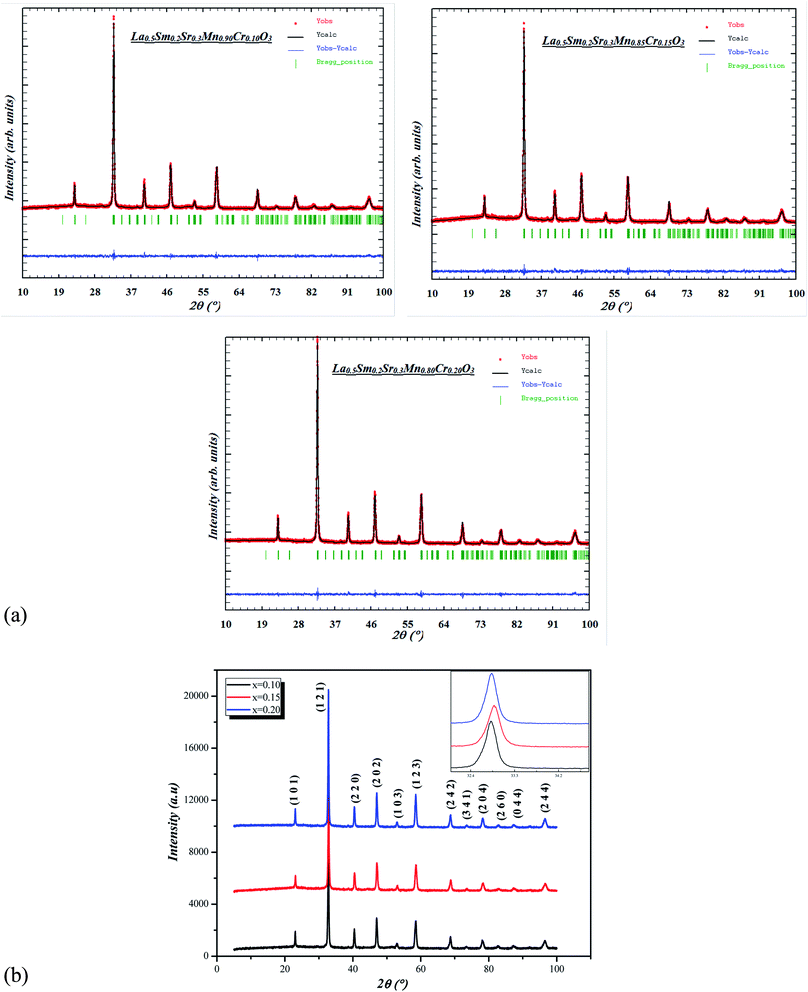
In the present research, polycrystalline samples of La0.5Sm0.2Sr0.3Mn1−xCrxO3 are prepared using the self-combustion method. Then, we have studied their crystalline structure, and dielectric and electrical properties. The X-ray diffraction study shows that all the samples exhibit a single phase with orthorhombic structure (space group Pnma). The studied samples were also characterized by complex impedance spectroscopy in a wide range of temperatures and frequency. AC conductivity analyses are used to study the transport property of the investigated samples. These analyses indicate that the conduction mechanism is strongly dependent on temperature and frequency. It is also found that the conductivity decreases with Cr concentration. Complex impedance analysis confirms the contributions of grain and grain boundaries in the conduction mechanism. Finally, the impedance spectra, characterized by the appearance of semicircle arcs at different temperatures, were well modeled in terms of equivalent electrical circuits to explain the impedance results.
1. Introduction
Perovskite manganites have been the subject of intense research efforts1–5 due to the potential technological application of the so-called colossal magnetoresistance (CMR) behavior.6–8 In the last two decades, experiments have focused on the effects of the application of an electric field on doped manganites. These systems are known to exhibit interesting electronic properties which are explained by many mechanisms.9–12 The manganite oxides described by the general formula Ln1−xAxMnO3, where Ln is a rare earth and A is an alkaline earth, have become every exciting materials for researchers not only for their interesting physical properties but also for their inherent ability to accommodate a wide range of elemental compositions and to display a wealth of structure variants. Lanthanum manganite (LaMnO3) is one of the most broadly studied systems.13,14 The ferromagnetic/electric properties of these materials can be achieved by varying the sintering conditions and by doping with various cations on both La and Mn sites.15,16 In this paper, we have synthesized a set of samples of La0.5Sm0.2Sr0.3Mn(1−x)CrxO3 with different Cr contents and we study its effect of Cr doping on the structural, electrical and dielectric properties of these compounds. Impedance spectroscopy was successfully employed to obtain clear information about the conduction and dielectric properties of these materials.The elaboration technique used for this investigation is the glycine nitrate process, an aqueous autocombustion process initially developed by Chick in 1990 for the production of chromite and manganite powders (GNP).17 Two reagents are required to begin redox reactions in autocombustion processes: the oxidizer and the fuel. Although metal nitrates are obvious oxidizers due to their excellent water solubility, ability to sustain combustion (high oxidizing power), and low cost, the nature of the fuel necessitates that it meet two criteria: it must be a good chelating agent to avoid selective precipitation during cation solution, as well as an effective reductant. Several possibilities are mentioned in the literature; the most common ones are urea, citric acid, and glycine. The amino acid glycine is recognized to be the most basic of all the amino acids. It has a zwitterionic nature due to its carboxylic acid and amine functionalities, allowing it to complex a high number of metal cations with its formula NH2CH2COOH. Indeed, the COO– group primarily captures alkalis and alkaline earths, whereas the amine typically complexes transition metals.17,18 Concerning the reduction properties, the heats of combustion of the reducing agents given by Hwang are −2.98 kcal g−1, −2.76 kcal g−1 and −3.24 kcal g−1 for urea, citric acid, and glycine respectively.19 Glycine, in addition to being a strong chelating agent, appears to be the reductant most likely to make the autocombustion process the most exothermic.
2. Experimental procedure
2.1 GNP principles
The redox reaction equation for synthesis of La0.5Sm0.2Sr0.3Mn0.9Cr0.1O3 via the GNP method is as follows:| 0.5La(NO3)3 + 0.2Sm(NO3)3 + 0.3Sr(NO3)2 + 0.9Mn(NO3)2 + 0.1Cr(NO3)3 + zNH2CH2COOH + λO2 → La0.5Sm0.2Sr0.3Mn0.9Cr0.1O3 + δCO2 + δ′H2O + δ′′N2 |
For a given fuel, the reaction is governed by the maximum temperature reached during combustion which is itself dependent on the oxidizing/reducing character of the mixture defined by the stoichiometric coefficient noted φ, which is the ratio between the total valences of the fuel (glycine) and the oxidizers (metal nitrates). These correspond to those defined in the Jain model:20 +4 for carbon, +1 for hydrogen, +2 for strontium and manganese and +3 for lanthanum, samarium and the chromium, while nitrogen has a zero valence (0) and oxygen a negative valence of −2. φ is therefore calculated as follows:
 and the G/N ratio becomes
 By definition, the reaction is considered under stoichiometric conditions when φ = 1, i.e. when all the valences of the oxidizing and reducing elements compensate each other. G/N is then 0.55 and Z is equal to 2.64. It is in this case that the reaction is the most violent and that the temperature reached during combustion is maximum.
2.2 Experimental protocol
We mix stoichiometric ratio of nitrates, La(NO3)3·6H2O, Sm(NO3)3·6H2O, Sr(NO3)2, Mn(NO3)2·4H2O, Cr(NO3)3·9H2O and glycine (C2H5NO2) with high purity (Sigma Aldrich, >97%). All nitrates were dissolved in distilled water to form the precursor solution for La0.5Pr0.2Sr0.3Mn(1−x)FexO3 (x = 0, 0.15 and 0.2) composition. The precursor solution was heating on a hot plate at about 100 °C for 1 h under magnetic stirring. Water was gradually vaporized during heating and formed a transparent viscous gel. When a critical temperature was reached (350 °C), the autoignition started, lasting only few seconds combustion and a great deal of foams produced. The obtained powders were preheated at 350 °C for about 4 h to remove the remaining organic and decompose the nitrates of the gel. These powders were sintered at 600 and 800 °C for 12 h with pressing into pellets form (of about 1 mm in thickness) under 4 tonnes per cm2.Phase purity and homogeneity, of the synthesized materials were checked by X-ray diffraction (XRD) analysis (CuKα radiation λ = 1.5405 Å) at room temperature. The impedance spectroscopy measurements were taken in the temperature range 100–400 K with 10 K step and in the frequency range of 100 Hz to 1 MHz using an impedance analyzer HP 4294 A Precision Impedance meter in the Cp–Rp configuration. The samples were maintained in a helium atmosphere in order to improve the heat transfer and eliminate the moisture.
3. Results and discussions
3.1 Structural analysis
The Rietveld refinement of X-ray diffraction patterns for the prepared samples are shown in Fig. 1a and b. These diagrams show quite fine and intense lines, which shows the good crystallization of the synthesized samples. They also show the absence of additional peaks related to other impurity phases, thus confirming the purity of the prepared samples. These spectra are characterized by strong main lines which can be identified (using the X'Pert HighScore Plus program) as corresponding to an orthorhombic phase with the Pnma space group. The quality of the refinement is evaluated through the goodness of the fit indicator χ2. The refined crystallographic data and relevant geometrical parameters for all the samples are listed in Table 1. An enlargement at the scale of the most intense line (121) represented in the inset of Fig. 1 reveals that according to the rate of substitution x of the chromium, the angular position of Bragg shifts towards the large angles, sign a decrease in the lattice parameters of the synthesized samples. A reduction of the unit cell volume and the lattice parameters is expected upon substitution manganese by chromium because the radius of Cr3+ (0.615 Å) is a little smaller than that of Mn3+ (0.645 Å).21 The bond lengths dMn–O and the bond angle Mn–O–Mn change slightly with increasing Cr3+ content.| Parameters | x = 0.10 | x = 0.15 | x = 0.20 |
| Symmetry | Orthorhombic | Orthorhombic | Orthorhombic |
| Space group | Pnma | Pnma | Pnma |
| a (Å) | 5.496(5) | 5.491(4) | 5.489(9) |
| b (Å) | 7.718(6) | 7.713(7) | 7.717(9) |
| c (Å) | 5.462(6) | 5.459(9) | 5.460(8) |
| V (Å3) | 231.752(4) | 231.27(6) | 231.376(8) |
| dMn−O1 (Å) | 1.950(4) | 1.949(4) | 1.955(4) |
| dMn−O2 (Å) | 1.99(3) | 1.86(6) | 1.87(3) |
| dMn−O2 (Å) | 1.92(3) | 2.02(6) | 2.03(3) |
| dMn−O (Å) | 1.955(4) | 1.947(1) | 1.953(8) |
| θMn−O1–Mn (°) | 163.36(17) | 163.37(16) | 161.44(15) |
| θMn−O2–Mn (°) | 165.2(14) | 170.(3) | 166.4(12) |
| θMn−O–Mn (°) | 164.28(7) | 166.835(8) | 163.926(7) |
| Rp (%) | 3.19 | 3.39 | 3.74 |
| Rwp (%) | 4.04 | 4.25 | 4.79 |
| Rexp (%) | 3.61 | 3.73 | 4.16 |
| Bragg R-factor (%) | 1.78 | 1.59 | 1.57 |
| RF-factor (%) | 4.34 | 3.33 | 3.19 |
| χ2 (%) | 1.25 | 1.30 | 1.33 |
| D (nm) | 32.38 | 31.50 | 27.15 |
| t | 0.85 | 0.85 | 0.85 |
The crystallite size was calculated using the full width at half maximum (FWHM) of the most intense peak (1 1 0) by Scherrer's formula:22
 | (1) |
The distortion from the ideal perovskite structure was confirmed with the value of the Goldschmidt23 tolerance factor.
 | (2) |
3.2 Electrical conductivity
The conductivity data are analyzed using Jonscher's law.24| σT(ω) = σdc + σac(ω) = σdc + A(T)ωn(T) | (3) |
In order to evaluate the conductivity of our samples and to identify the origin of the conduction process, it is useful to present the ac conductivity at different frequencies and temperatures which can be calculated from the dielectric data using following formula:
σac = ωε0εr![[thin space (1/6-em)]](https://www.rsc.org/images/entities/char_2009.gif) tan tan![[thin space (1/6-em)]](https://www.rsc.org/images/entities/char_2009.gif) δ δ
| (4) |
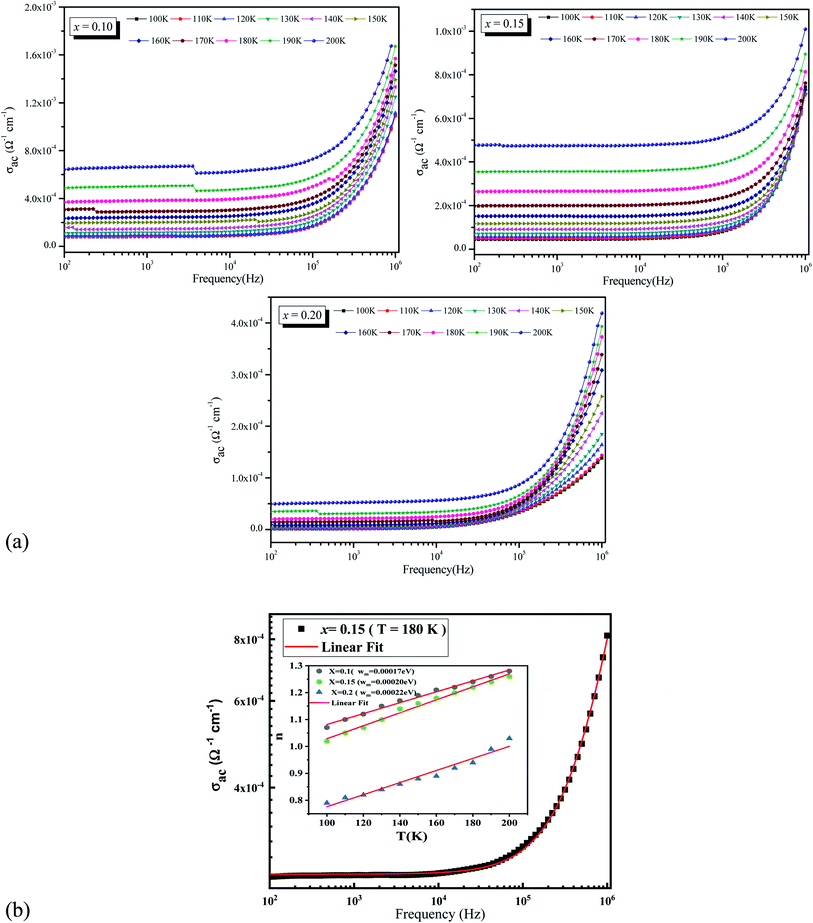
The frequency dependent conductivity spectrum is plotted in Fig. 2a which shows two distinct regions, a low frequency plateau region and a high frequency dispersive region. As frequency increases, hopping between charge carriers increases which results an increase in AC conductivity value of all samples. At any frequency, conductivity is found to decrease with the increase in chrome concentration. To understand the transport behaviors of our material system, one must suppose that the doping element's electronic structure is critical. In our situation, the doped element is chromium, which is a periodic table neighbor of manganese, and these ions occur in the forms Mn3+, Mn4+, and Cr3+ in such systems.26 Cr3+: (t32ge0g) (S = 3/2), Mn3+: (t32ge1g) (S = 2), and Mn4+: (t32ge0g) (S = 3/2) are their electronic configurations, with only the (e1g) electron of Mn3+ being electrically active. Cr3+, Mn3+, and Mn4+ have ionic radii of 0.615 Å, 0.645 Å, and 0.530 Å, respectively.27 Because the chromium ion's radius is approximately identical to that of the Mn3+ ion, the latter is immediately replaced by the Cr 3+ form. Cr3+ has the same electronic configuration as Mn4+, hence the FM double exchange FMDE interaction between Mn3+ and Cr3+ should be the same as between Mn3+ and Mn4+.Then, in the semiconducting phase, inserting Cr3+ into manganite (Mn3+–O–Mn4+ chains) disrupts the lattice by enhancing electron–phonon interaction, encouraging the creation of polarons and hopping between various valence states of Mn. Furthermore, it is well known that the FMDE interaction between Mn3+ and Cr3+ ions is weaker than the interaction between Mn3+ and Mn4+ ions.28 As a result of Cr doping, the effective FMDE interaction weakens. Also, because of the weaker DE interaction, the single electrically active electron, e1g electron of the Mn3+ ion, becomes confined, resulting in a steady drop in conductivity as Cr concentration rises. Moreover, this decrease in conductivity values can be related to the decrease in grain size. This can be explained by the fact that with a decrease in grain size the effect of grain boundaries opposes the passage of charge carriers which increases the barrier effect and thus the path to the decrease of electrical transport.
Fig. 2b illustrate a typical example of a non-linear fitting of frequency dependency of AC electrical conductivity for La0.5Sm0.2Sr0.3Mn0.85Cr0.15O3 sample at T = 180 K using the Jonscher's law. It can be seen that the fit (red solid line) matches well with the experimental values which means that the electrical conductivity are well fitted. The inset shows the variation of the exponent n as a function of temperature for the three samples (x = 0.10, 0.15 and 0.20). The conductivity parameters σac for 100 Hz, n, and A values are summarized in Table 2. The n values decrease with increasing the concentration of chrome indicating that the electron-hopping decrease with addition of this metal which confirm the precedent results.
| T (K) | x = 0.1 | x = 0.15 | x = 0.20 | ||||||
|---|---|---|---|---|---|---|---|---|---|
| σac × 10−5 (Ω−1 cm−1) | A × 10−10 | n | σac × 10−5 (Ω−1 cm−1) (S m−1) × 10−5 | A × 10−10 | n | σac × 10−5 (Ω−1 cm−1) | A × 10−10 | n | |
| 100 | 8.274 | 3.788 | 1.072 | 3.99 | 4.80 | 1.02 | 0.081 | 18.98 | 0.82 |
| 110 | 8.347 | 2.52 | 1.102 | 4.38 | 3.13 | 1.05 | 0.144 | 15.02 | 0.84 |
| 120 | 9.158 | 1.80 | 1.12 | 6.3 | 2.22 | 1.07 | 0.219 | 14.4 | 0.86 |
| 130 | 11.78 | 1.41 | 1.153 | 6.67 | 1.48 | 1.10 | 0.102 | 15.02 | 0.865 |
| 140 | 15.19 | 1.179 | 1.17 | 8.84 | 0.83 | 1.14 | 0.144 | 12.96 | 0.87 |
| 150 | 20 | 0.903 | 1.19 | 11.5 | 0.619 | 1.16 | 0.768 | 12.68 | 0.88 |
| 160 | 25.01 | 0.648 | 1.216 | 14.92 | 0.459 | 1.18 | 0.506 | 12.27 | 0.89 |
| 170 | 29.34 | 7.39 | 1.22 | 20 | 0.389 | 1.19 | 1.314 | 10.23 | 0.92 |
| 180 | 39.77 | 0.471 | 1.24 | 26.6 | 0.256 | 1.22 | 2.002 | 7.645 | 0.945 |
| 190 | 48.9 | 0.347 | 1.26 | 35.7 | 0.194 | 1.24 | 3.112 | 3.912 | 0.994 |
| 200 | 65 | 0.265 | 1.28 | 47.6 | 0.149 | 1.26 | 5.151 | 3.421 | 1.07 |
According to Funke,29 the electrons-hopping is happened between neighboring sites for both samples x = 0.10 and x = 0.15 as their n values are greater than unity, which is the case of other materials.30–32 Whereas for the sample x = 0.20 n is found to be between 0.8 and 1 for temperatures lower than T = 200 K. This can be ascribed to hopping conduction of mobile charge carriers (ions) over barrier between two sufficiently distant sites. This behavior is similar to that observed in amorphous semiconductors and glasses.33–36
Furthermore, based on the variation of the exponent n as a function of temperature we identify the predominant conduction process for our present compounds. Different models have been proposed to determine the conduction's nature, such as the Quantum Mechanical Tunneling (QMT),37 the Correlated Barrier Hopping (CBH) model,38 the Non-overlapping Small Polaron Tunneling (NSPT) model,39 and the Overlapping Large Polaron Tunneling (OLPT) model.40 In our case we notice an increase in the n values with increasing temperature which is corresponding to a thermally activated process. From this behavior we can reveal that the NSPT model is most suitable model to describe the conduction mechanism in our compounds.
It was important to note that a significant number of materials have been recognized to exhibit small polaron conduction as a result.41,42 The Coulomb interaction between conduction electrons and the lattice ionic charge carrier produces a quasi-particle that results in a strong electron phonon coupling. Virtual phonons surround conduction electrons, which equate to the electron drawing nearby positive ions towards it and pushing nearby negative ions away. The electrons and their virtual phonon, which may be thought of as a new quasi-composite particle, are known as polarons, and they polarize the system by modifying the energy state configurations. We also remark that for an electron placed in a continuum polarizable (or deformable) medium, the electron mobility and effective mass estimation, which results in an alleged small and large polaron, the radius of the polaron is significantly bigger than the lattice constant of the materials in large polaron, which is also known as Fröhlich polaron. The wave function of a large polaron and its accompanying lattice distortions was characterized by a dimensionless number known as the Fröhlich coupling constant (), which was distributed over several lattice sites. As a result of the expansion of effective mass, polarizations of ionic carriers can pursue polaron motion due to limited phonon frequencies and inseminate via lattice sites as free electrons with low kinetic energy. The small polaron of thermally activated hopping is created when the deformation surrounding charge carriers and their ionic displacement is constrained to a volume of one unit or less to its nearest neighbor.
The exponent n can be expressed as a function of temperature by the following formula:43
 | (5) |
The Wm values were calculated from the slope of the n(T) curves in the NSPT model. The values are obtained in the order of 0.00017 eV, 0.00020, and 0.00022 eV for x = 0.10 and 0.15, and 0.20 respectively. The insertion of chrome in place of manganese has an effect on the bonding energy. Indeed the increase of Wm values in agreement with the decrease of the conductivity when we rise Cr concentration.
The dc conductivity behavior is well fitted by the Arrhenius relation given as44
 | (6) |
 | (7) |
 | (8) |
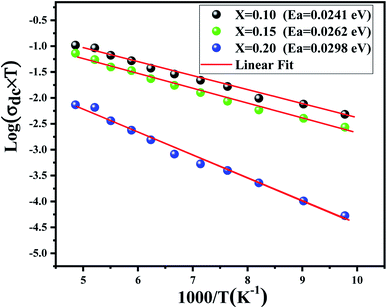 | ||
| Fig. 3 Dependence of log(σdc × T) on (1000/T). Red solid lines represent the linear fit to the experimental data. | ||
| Sample | N(EF) (1038 eV−1 m−1) | α (A°−1) | WH (eV) |
|---|---|---|---|
| x = 0.10 | 0.96 | 1.14 | 0.145 |
| x = 0.15 | 17.8 | 1.35 | 0.245 |
| x = 0.20 | 35.47 | 1.89 | 0.298 |
3.3 Dielectric studies
According to the Mott theory,47 the complex permittivity is expressed as:| ε* = ε′ − jε′′ | (9) |
The dissipation factor or loss tangent (tan![[thin space (1/6-em)]](https://www.rsc.org/images/entities/char_2009.gif) δ) can be expressed by the formula:
δ) can be expressed by the formula:
tan![[thin space (1/6-em)]](https://www.rsc.org/images/entities/char_2009.gif) δ = ε′′/ε′ δ = ε′′/ε′
| (10) |
The dielectric loss is the power dissipated in a dielectric as heat when the dielectric is exposed to an electric field. The origins of these dielectric losses, ε′′, are the conduction losses, dipole losses and vibrational losses. Dielectric loss tangent (tan![[thin space (1/6-em)]](https://www.rsc.org/images/entities/char_2009.gif) δ) is defined as a ratio of energy lost or dissipated per cycle to the energy stored.
δ) is defined as a ratio of energy lost or dissipated per cycle to the energy stored.
The plots of imaginary part of permittivity ε′′ and of loss tangent![[thin space (1/6-em)]](https://www.rsc.org/images/entities/char_2009.gif) δ (tan
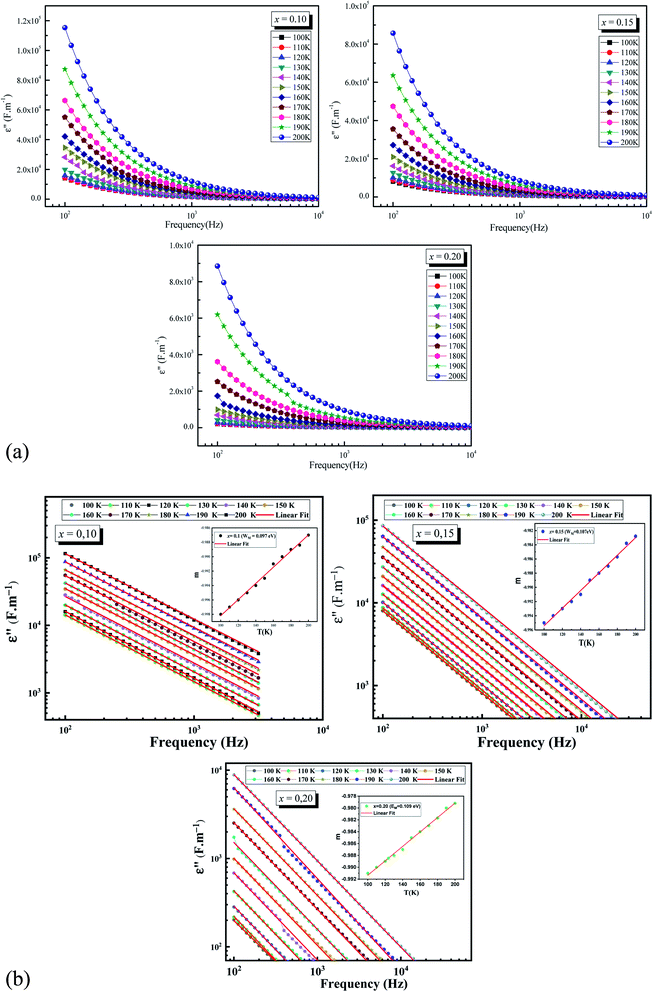
δ (tan![[thin space (1/6-em)]](https://www.rsc.org/images/entities/char_2009.gif) δ) versus frequency at different temperatures for La0.5Sm0.2Sr0.3Mn(1−x)CrxO3 (x = 0.10, 0.15 and 0.2) samples are showing in the Fig. 4.a and the Fig. 5 respectively. With increasing frequency, ε′′ and tan
δ) versus frequency at different temperatures for La0.5Sm0.2Sr0.3Mn(1−x)CrxO3 (x = 0.10, 0.15 and 0.2) samples are showing in the Fig. 4.a and the Fig. 5 respectively. With increasing frequency, ε′′ and tan![[thin space (1/6-em)]](https://www.rsc.org/images/entities/char_2009.gif) δ values are found to decrease rapidly at low frequencies until they become frequency independent at higher frequencies which leads to the appearance of two different regions in ε′′ = f(freq) and tan
δ values are found to decrease rapidly at low frequencies until they become frequency independent at higher frequencies which leads to the appearance of two different regions in ε′′ = f(freq) and tan![[thin space (1/6-em)]](https://www.rsc.org/images/entities/char_2009.gif) δ = f(freq) spectra: a plateau region at higher frequency and a strong dielectric dispersion at lower frequency. This behavior can be explained by the Maxwell–Wagner interfacial polarization48,49 where the dielectric permittivity of a material is due to the four types of polarizations:50 interfacial, dipolar, ionic and electronic. The contribution of each type depends either on the frequency. Electronic and ionic polarizations are active in the high frequency range, while the other two mechanisms prevail in the low frequency range. Indeed the dielectric structure of manganite is composed of grains which act as good conductive, separated by grain boundaries which have the ability to act as an insulator, preventing the inter-grains conductivity. Under the influence of an electric field applied across the material, the movement of electrons through the grain is interrupted in the grain boundaries. Charges accumulate in the interface between grains, therefore the appearance of interfacial polarization. We can attribute the dispersion occurring in the low frequency region to this interfacial polarization, since the effect of grain boundaries is dominant in the low frequency region. The electronic exchange results in a local displacement of the electrons in the electric field direction, which polarizes the samples. Thus, by increasing frequency, the polarization decreases. Beyond a certain frequency, the electrons in the grain can no longer follow the alternating field thus the electrons begin to localize, leading to the non-frequency dependence of dielectric constants. At the low-frequency region, the values of the loss factor decrease with increasing the chromium concentration in good agreement with the decrease of the conductivity. The low values of the two dielectric constants at higher frequencies identifies the potential of these material for high frequency applications.51 Fig. 4a and 5 show an increase of ε′′ and tan
δ = f(freq) spectra: a plateau region at higher frequency and a strong dielectric dispersion at lower frequency. This behavior can be explained by the Maxwell–Wagner interfacial polarization48,49 where the dielectric permittivity of a material is due to the four types of polarizations:50 interfacial, dipolar, ionic and electronic. The contribution of each type depends either on the frequency. Electronic and ionic polarizations are active in the high frequency range, while the other two mechanisms prevail in the low frequency range. Indeed the dielectric structure of manganite is composed of grains which act as good conductive, separated by grain boundaries which have the ability to act as an insulator, preventing the inter-grains conductivity. Under the influence of an electric field applied across the material, the movement of electrons through the grain is interrupted in the grain boundaries. Charges accumulate in the interface between grains, therefore the appearance of interfacial polarization. We can attribute the dispersion occurring in the low frequency region to this interfacial polarization, since the effect of grain boundaries is dominant in the low frequency region. The electronic exchange results in a local displacement of the electrons in the electric field direction, which polarizes the samples. Thus, by increasing frequency, the polarization decreases. Beyond a certain frequency, the electrons in the grain can no longer follow the alternating field thus the electrons begin to localize, leading to the non-frequency dependence of dielectric constants. At the low-frequency region, the values of the loss factor decrease with increasing the chromium concentration in good agreement with the decrease of the conductivity. The low values of the two dielectric constants at higher frequencies identifies the potential of these material for high frequency applications.51 Fig. 4a and 5 show an increase of ε′′ and tan![[thin space (1/6-em)]](https://www.rsc.org/images/entities/char_2009.gif) δ values with increasing temperature which can be attribute to the thermally activated nature of the hopping of charge carriers.
δ values with increasing temperature which can be attribute to the thermally activated nature of the hopping of charge carriers.
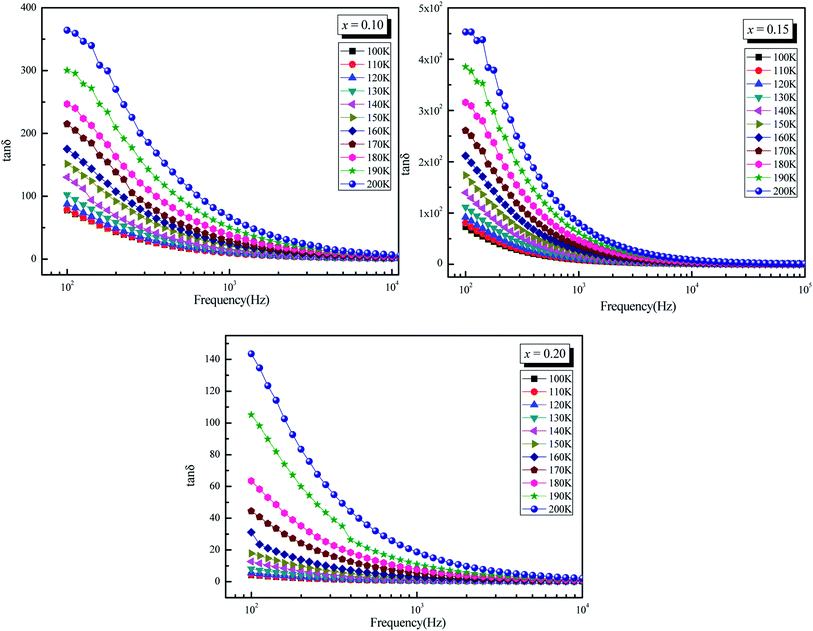 | ||
Fig. 5 Dielectric loss tangent (tan![[thin space (1/6-em)]](https://www.rsc.org/images/entities/char_2009.gif) δ) versus Logarithm of (ω) at different temperatures for La0.5Sm0.2Sr0.3Mn1−xCrxO3 (x = 0.10, 0.15 and 0.20). δ) versus Logarithm of (ω) at different temperatures for La0.5Sm0.2Sr0.3Mn1−xCrxO3 (x = 0.10, 0.15 and 0.20). | ||
Moreover, we can use Giuntini model52 to analyze ε′′ (freq, T) spectra where ε′′ can be expressed as:
| ε′′(ω) = (ε0 − ε∞)2π2N(ne/ε0)3KTτ0mWM−4ωm | (11) |
The eqn (11) can be abbreviate as:
| ε′′(ω) = Bωm | (12) |
The exponent m(T) may be written as a function of temperature and maximum barrier height WM according to the following equation:
 | (13) |
3.4 Complex impedance analysis
Various contributions in electrical characteristics emanating from the system's grains and grain-boundaries may be distinguished using this impedance spectroscopy.53,54 The real (Z′) and imaginary (Z′′) part of the complex impedance can be calculated by using the following equations:55| Z* = Z′ − jZ′′ | (14) |
 | (15) |
 | (16) |
The frequency dependence of real part of impedance (Z′, i.e., bulk resistance) at some representative temperature is shown in Fig. 6. It is clear from the Z′ = f(freq) curves that the impedance value decreases with rise in frequency and temperature. The values of Z′ merge after a certain frequency. This may be due to release of space charges at low temperatures.56,57 The reduction in barrier properties of the materials with rise in temperature may be a responsible factor for enhancement of AC conductivity of the materials at higher frequencies.58,59 Further, in the low frequency region, there is a decrease in magnitude of Z′ with rise in temperature showing negative temperature coefficient of resistance (NTCR) behavior. This behavior is changed drastically in the high frequency region showing complete merger of plot above a certain fixed frequency. This particular frequency at which Z′ value becomes constant is observed to shift towards the high-frequency side with rise of temperature. This shift in Z′ plateau indicates the possibility of frequency relaxation process in the material.
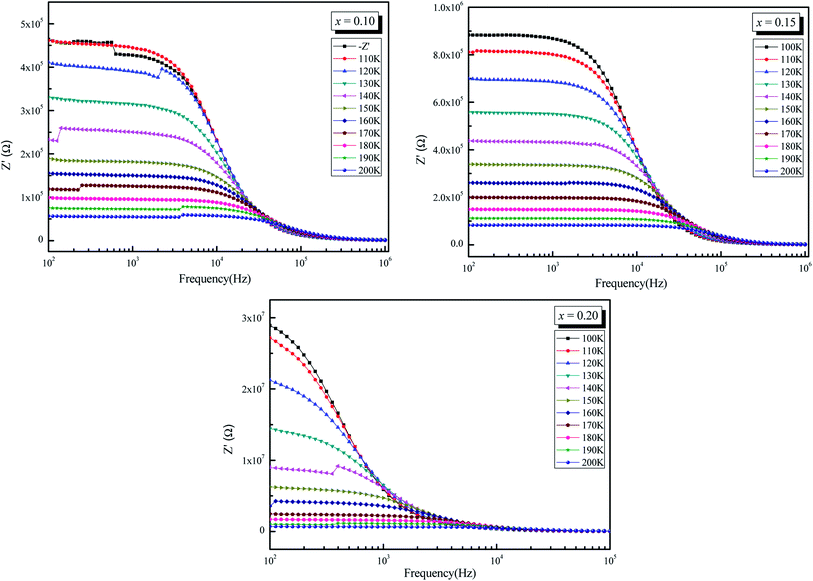 | ||
| Fig. 6 Variation of real part of impedance (Z′) as a function of frequency (ω) of La0.5Sm0.2Sr0.3Mn1−xCrxO3 (x = 0.10, 0.15 and 0.20). | ||
Fig. 7 shows the frequency and temperature dependent plots of the imaginary part of impedance (Z′′, i.e., loss spectrum) for all the samples. This plot provides information on the dielectric processes taking place in the material. The Z′′ value is shown to decrease with frequency for all temperatures and to shift to higher frequencies as the temperature increases. The spectrum is characterized by the appearance of a peak which is shifted to higher frequency with increasing temperature, indicating the existence of relaxation processes in the system, while its broadening on increasing temperature suggests that those relaxation processes are temperature-dependent.60 At low temperatures, the relaxation phenomenon may be due to the immobile species/electrons; at high temperatures, the relaxation may be due to the defects/vacancies.61
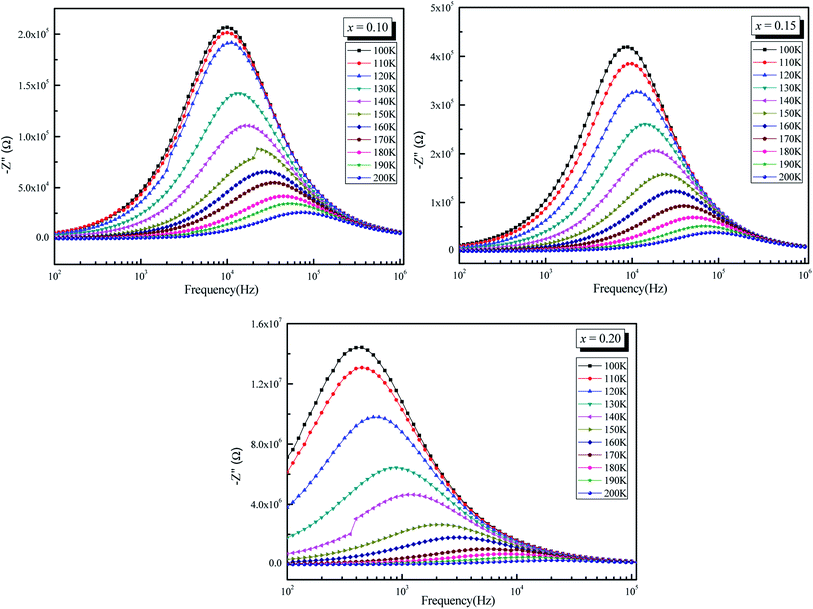 | ||
| Fig. 7 Variation of imaginary part of impedance (−Z′′) as a function of frequency (ω) of La0.5Sm0.2Sr0.3Mn1−xCrxO3 (x = 0.10, 0.15 and 0.20). | ||
The normalized spectra of Z′′ (i.e. Z′′/Z′′ max) as function of frequency at different temperatures are represented in Fig. 8. These plots are normally used to detect the presence of the smallest capacitance and the largest resistance as suggested by Sinclair et al.62 This will help us to identify the relaxation process whether there is a short range or long range motion of charge carriers. If the process is of short range, frequency dependence peaks of Z′′ occurs at different frequencies but for long-range movement of charge carrier peaks occurs at the same frequency.62,63 In the studied compounds, the mismatch of above two peaks of different temperatures suggests the presence of short-range motion of charge carrier.62,64
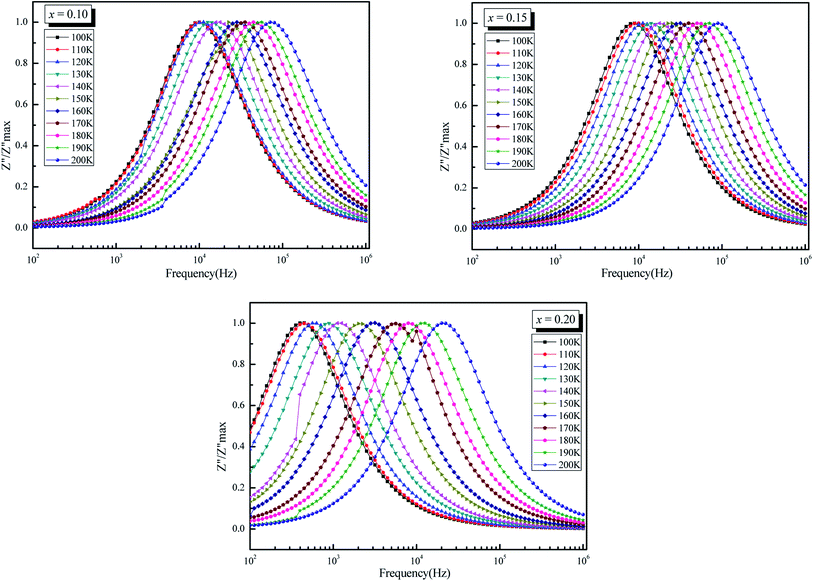 | ||
| Fig. 8 Variation of Z′′/Z′′ max as a function of frequency (ω) of La0.5Sm0.2Sr0.3Mn1−xCrxO3 (x = 0.10, 0.15 and 0.20). | ||
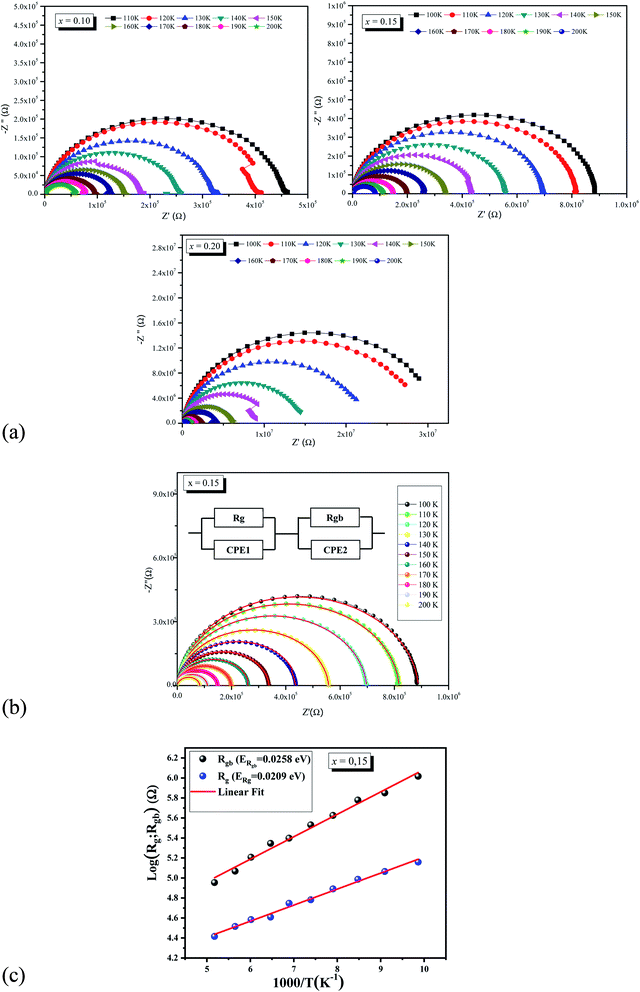
In order to determine the contributions of grain boundaries and grains (bulk or intrinsic properties of material) in the conduction mechanism, Cole–Cole analysis65 has been performed. For all investigated samples, the Nyquist diagram (−Z′′ vs. Z′) at different temperatures is presented in Fig. 9a. As clearly shown, All the Nyquist plots are not centered on the real axis which indicating the departure from the ideal Debye behavior.66,67
We observe that the diameters of the semicircles decrease when temperature increases. Such behavior proves that the conduction process is thermally activated. The Nyquist plots are formed by two semicircles: a small one at high frequency due to bulk (grain) and a larger one at low frequencies due to grain boundary.68 For ceramics materials, Nyquist plot is used in modeling the compound by an electrical equivalent circuit. Fig. 9b shows the simulate Nyquist plots with the equivalents circuits elements for La0.5Sm0.2Sr0.3Mn0.85Cr0.15O3 samples at several temperatures. The investigated compound can be modeled by an equivalent circuit model, which is composed of two parallel circuits. The first circuit describes the transport through the grain. It is composed of a resistor Rg and a constant phase element CPE1.The second one is composed of a resistor Rgb in parallel with a constant phase element CPE2.
The extracted parameters Rg, Cg, Rgb, Q, and αgb are given in Table 4. The logarithmic variation of the determinate Rg and Rgb values for La0.5Sm0.2Sr0.3Mn0.85Cr0.15O3 with the inverse of temperature for the samples is shown in Fig. 9c. The Arrhenius law was applied in log(Rg; Rgb) vs. (1000/T) curves to estimate the activation energies (see Fig. 9c). The obtained (ERgb) values were closed to those deduced from dc conductivity and relaxation time analyses. In addition, the grain boundary have a greater activation energy then grain which affirmed that grain boundary is less thermally conductive than its grain counterpart.
| T (K) | Rg (105 Ω) | C (10−11 F) | Rgb (105 Ω) | CPE | |
|---|---|---|---|---|---|
| Q (10−9F) | αbg | ||||
| 100 | 1.2423 | 2.1977 | 7.7318 | 8.1964 | 0.67131 |
| 110 | 1.1613 | 2.1699 | 7.095 | 8.1975 | 0.67204 |
| 120 | 1.0369 | 2.1612 | 6.0102 | 7.4496 | 0.67941 |
| 130 | 4.7636 | 2.1796 | 0.86589 | 6.3352 | 0.691 |
| 140 | 0.60507 | 2.1917 | 3.7993 | 5.4903 | 0.70187 |
| 150 | 0.55863 | 2.2301 | 2.8487 | 5.0954 | 0.70812 |
| 160 | 0.40614 | 2.284 | 2.2207 | 3.5807 | 0.73132 |
| 170 | 0.38383 | 2.3675 | 1.6142 | 3.0695 | 0.74174 |
| 180 | 0.32781 | 2.4934 | 1.1694 | 2.0766 | 0.76509 |
| 200 | 0.22608 | 2.894 | 0.60606 | 0.8142 | 0.81783 |
3.5 Complex modulus analysis
Fig. 10 shows the evolution of the real part of the electrical modulus with frequency at different temperatures for La0.5Sm0.2Sr0.3Mn(1−x)CrxO3 (x = 0.10, 0.15 and 0.2). The M values for all samples are relatively low in the low frequency band, indicating that electrode polarization has a negligible effect on the materials.69 With increasing frequency, M′ displays a constant dispersion. This might be owing to charge carriers' short-range mobility.70 For all of the temperatures in these figures, M′ approaches a constant value (M) at high frequencies and it shows relaxation process, which occurs in the materials.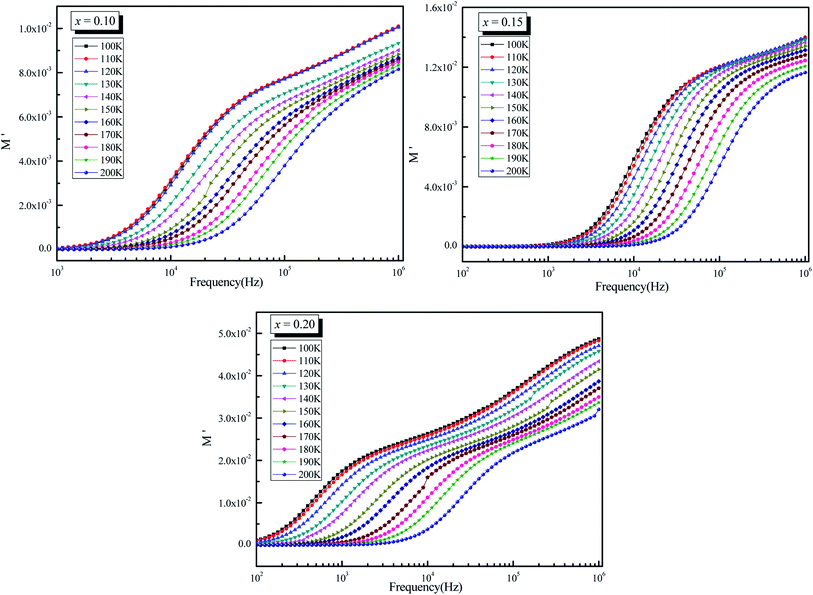 | ||
| Fig. 10 Variation of real part of modulus (M′) as a function of frequency (ω) at different temperatures for La0.5Sm0.2Sr0.3Mn1−xCrxO3 (x = 0.10, 0.15 and 0.2). | ||
Fig. 11 depicts a semi-log plot of M′′ vs. frequency for various compositions at various temperatures. The following describes the variation of M′′ as a function of frequency:
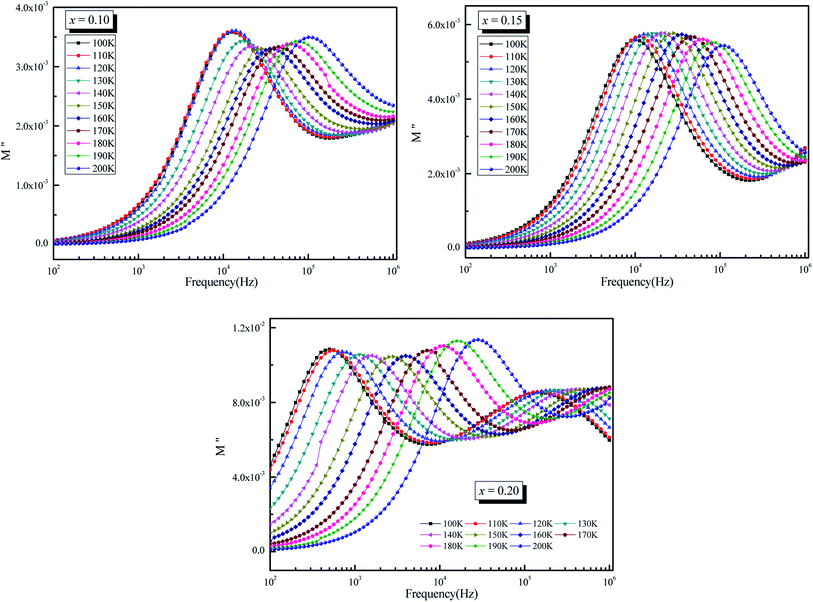 | ||
| Fig. 11 Variation of imaginary part of modulus (M′′) as a function of frequency (ω) at different temperatures for La0.5Sm0.2Sr0.3Mn1−xCrxO3 (x = 0.10, 0.15 and 0.2). | ||
• As the temperature rises, the maximum M′′ max shifts to the higher frequency side, implying that dielectric relaxation is a thermally stimulated process. The modulus spectrum of various ionic conductors has been shown to have this effect.
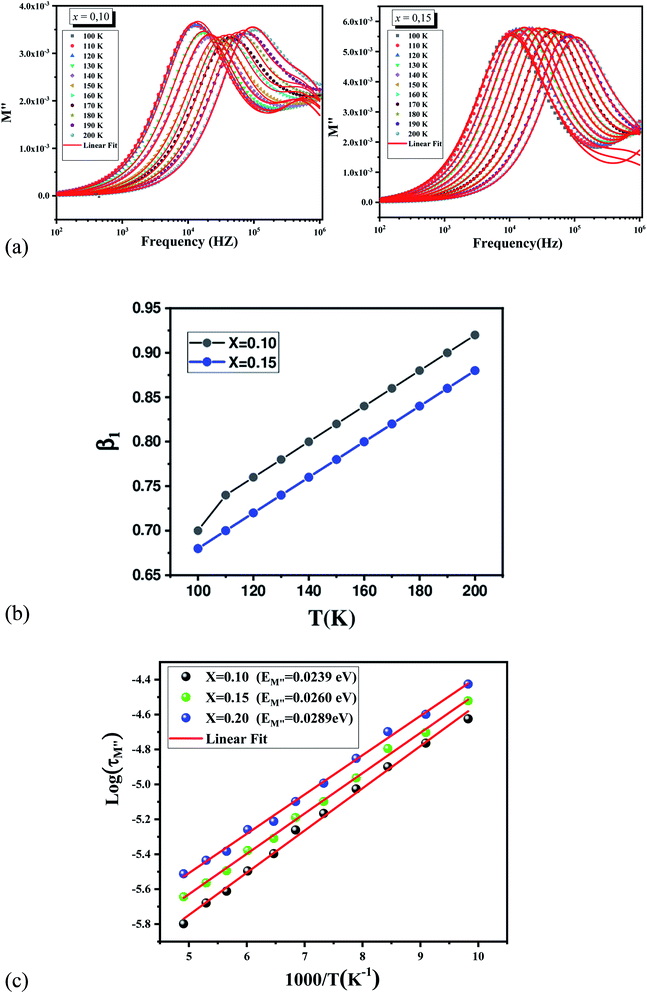
• For the three compounds, two well defined broad and asymmetric peaks in M′′ are found, suggesting the presence of two relaxation processes which illustrates the existence of non-Debye type relaxation. With rising temperature, these two relaxation peaks progressively overlapped at high frequency. M′′(f) curves for (x = 0.10 and 0.15) were modeled using the Kohlrausch, Williams and Watts (KWW) function71 Fig. 12a:
 | (17) |
 represent the peak maxima and fmax its corresponding frequency, β1 and β2 are the stretching factors which rank between 0 and 1.71 The M′′(f) data were well fitted using eqn (17) as shown in Fig. 12a for both compounds (x = 0.10 and 0.15). The β1 and β2 values are less than unity which confirms the non-Debye dielectric behavior of the samples.
Fig. 12b depicts the variation of β1 with temperature for the samples (x = 0.10 and 0.15), β1 values increase when temperature rises. The decrease of β1 values with Cr content can be related to the increase of grains size.72 The relaxation time (τ) was calculated from the relaxation frequency (fmax) through the following relation:
| τ = 1/2πfmax | (18) |
Fig. 12c shows the log(τM′′) vs. (1000/T) curves which have also been modelized using the following Arrhenius equation:73
 | (19) |
4. Conclusion
To sum up, polycrystalline La0.5Sm0.2Sr0.3Mn1−xCrxO3 (x = 0.10, 0.15 and 0.20) manganites were synthesized using self-combustion process. The effects of the partial substitution of Mn3+ with Cr3+ on the structural, electrical and dielectrical properties of the investigated samples were carefully studied by means of X-ray diffraction analyses and complex impedance spectroscopy in the temperature range 100–400 K and in the frequency range of 100 Hz to 1 MHz. The X-ray diffraction analysis revealed that all samples exhibit single perovskite with orthorhombic Pnma structure. We have studied the electrical conductivity of our samples, it was found decreases with chrome content. It was verified that both dielectric losses ε′′ and dielectric losses tangent tan![[thin space (1/6-em)]](https://www.rsc.org/images/entities/char_2009.gif) δ decrease by increasing frequency and increase sharply at low frequency by increasing temperature. Nyquist plots confirmed the contributions of grain and grain boundary effect to the conductivity of the investigated samples.
δ decrease by increasing frequency and increase sharply at low frequency by increasing temperature. Nyquist plots confirmed the contributions of grain and grain boundary effect to the conductivity of the investigated samples.
Conflicts of interest
There are no conflicts to declare.Acknowledgements
This research has been funded by the research Deanship of the University of Ha'il, project number RG-20 085.References
- A. Berksoy-Yavuz, E. Mensur-Alkoy, E. Erdem and S. Alkoy, Ceram. Int., 2020, 48, 28986 Search PubMed.
- H. SuHan, J. Koruza, E. A. Patterson, J. Schultheiß, E. Erdem, W. Jo, J.-S. Lee and J. Rödel, J. Eur. Ceram. Soc., 2017, 37, 2089 Search PubMed.
- A. Nucara, F. MilettoGranozio, W. S. Mohamed, A. Vecchione, R. Fittipaldi, P. P. Perna, M. Radovic, F. M. Vitucci and P. Calvani, Physica B, 2014, 433, 106 CrossRef.
- Y. Bitla, S. N. Kaul and L. FernándezBarquín, Physica B, 2014, 448, 225 CrossRef.
- H. Rahmouni, A. Dhahri and K. Khirouni, J. Alloys Compd., 2014, 591, 262 CrossRef.
- K. Abdouli, W. Cherif, M. A. Valent, M. P. F. Graça, L. Ktari, O. Messaoudi, S. Elgharbi and W. I. Elsofany, J. Mater. Sci.: Mater. Electron., 2021, 32, 22106–22118 CrossRef CAS.
- Kh. Abdouli, W. Cherif, H. Omrani, M. Mansouri, M. A. Valent, M. P. F. Graça and L. Ktari, Structural, magnetic and magnetocaloric properties of La0.5Sm0.2Sr0.3Mn1-xFexO3 compounds with (0 ≤ x ≤ 0.15), J. Magn. Magn. Mater., 2018, 475, 635–642 CrossRef CAS.
- F. Khammassi, et al, J. Phys. D: Appl. Phys., 2021, 54, 175001 CrossRef CAS.
- Kh Abdouli, et al., J. Alloys Compd., 2018, 739, 1048–1058 CrossRef CAS.
- F. Khammassi, W. Cherif, A. J. M. Sales, K. Riahi, M. P. F. Graça and M. Dammak, J. Supercond. Novel Magn., 2021, 34, 497–505 CrossRef CAS.
- S. Aydi, W. Chérif, F. Khammassi, A. J. M. Sales, N. M. Ferreira and N. Zouari, Appl. Phys. A, 2021, 127, 931 CrossRef CAS.
- S. Khadhraoui, A. Triki, S. Hcini, S. Zemni and M. Oumezzine, Variable-range-hopping conduction and dielectric relaxation in Pr0.6Sr0.4Mn0.6Ti0.4O3±δ perovskite, J. Magn. Magn. Mater., 2014, 371, 69–76 CrossRef CAS.
- R. Selmi, W. Cherif, A. R. Sarabando, N. M. Ferreira and L. Ktari, J. Mater. Sci.: Mater. Electron., 2022, 33, 1703–1723 CrossRef CAS.
- R. Tlili, R. Hammouda, M. Bejar and E. Dhahri, Theoretical investigation of the magnetocaloric effect on La0.7(Ba, Sr)0.3Mn0.9Ga0.1O3 compound at room temperature, J. Magn. Magn. Mater., 2015, 386, 81 CrossRef CAS.
- J. J. Blanco, M. Insausti, I. Gil de Muro, L. Lezama and T. Rojo, Neutron diffraction and magnetic study of the Nd0.7Pb0.3Mn1-xFexO3 (0≤x≤0.1) perovskites, Solid State Chem., 2006, 179, 623 CrossRef CAS.
- M. Bejar, R. Dhahri, E. Dhahri, M. Balli and E. K. Hlil, Large magnetic entropy change at room temperature in La0.7Ca0.3-xKxMnO3, J. Alloy. Compd., 2007, 442, 136 CrossRef CAS.
- L. Chick, L. Pederson, G. Maupin, J. Bates, L. Thomas and G. Exarhos, Mater. Lett., 1990, 10(1–2), 6 CrossRef CAS.
- R. Peng, X. Fan, Z. Jiang and C. Xia, Fuel Cells, 2006, 6(6), 455 CrossRef CAS.
- C. C. Hwang and T. Y. Wu, J. Mater. Sci. Eng. B, 2004, 111(2–3), 197 CrossRef.
- S. Jain, K. Adiga and V. P. Verneker, Combust. Flame, 1981, 40, 71 CrossRef CAS.
- R. D. Shannon, Revised effective ionic radii and systematic studies of interatomic distances in halides and chalcogenides, Acta Crystallogr., Sect. A: Cryst. Phys., Diffr., Theor. Gen. Crystallogr., 1976, 32(5), 751–767 CrossRef.
- A. Taylor, X-Ray Metallography, Wiley, New York, 1961 Search PubMed.
- J. S. Rathod, M. J. Keshvani, P. S. Solanki, D. D. Pandya, B. Kataria, N. A. Shah and D. G. Kuberkar, Phys. B, 2015, 478, 1 CrossRef CAS.
- A. K. Jonscher, Nature, 1977, 267, 673 CrossRef CAS.
- X. F. Du and I. W. Chen, J. Am. Ceram. Soc., 1998, 81, 3253 CrossRef CAS.
- J. Zhang, Q. Yan, F. Wang, P. Yuan and P. Z. Hang, J. Phys.: Condens. Matter, 2000, 12, 1981 CrossRef CAS.
- P. V. Vanitha, R. S. Sing, S. Natarajan and C. N. R. Rao, J. Solid State Chem., 1998, 137, 365 CrossRef CAS.
- A. Maignan, C. Martin, F. Damay, M. Hervieu and B. Raveau, J. Magn. Magn. Mater, 1998, 188, 185 CrossRef CAS.
- K. Funke, Prog. Solid State Chem., 1993, 22, 111–195 CrossRef CAS.
- A. Selmi, S. Hcini, H. Rahmouni, A. Omri, M. L. Bouazizi and A. Dhahri, Phase Transitions, 2017, 90, 942 CrossRef CAS.
- M. H. Dhaou, S. Hcini, A. Mallah, M. L. Bouazizi and A. Jemni, Appl. Phys. A: Mater. Sci. Process., 2017, 123, 8 CrossRef.
- F. Hcini, S. Hcini, B. Alzahrani, S. Zemni and M. L. Bouazizi, J. Mater. Sci.: Mater. Electron., 2020, 31, 14986–14997 CrossRef CAS.
- W. K. Lee, J. F. Liu and A. S. Nowick, Phys. Rev. Lett., 1994, 67, 1559 CrossRef.
- S. R. Elliott, Adv. Phys., 1987, 36, 135 CrossRef CAS; S. R. Elliott, Solid State Ionics, 1994, 27, 70–71 Search PubMed.
- A. Dhahri, A. Zaouali, A. Benali, N. Abdelmoulla, J. Massoudi, K. Nouri, L. Bessais, M. P. F. Graça, M. A. Valente and B. F. O. Costa, J. Mater. Sci.: Mater. Electron., 2021, 32, 7926–7942 CrossRef CAS.
- S. Khadhraoui, A. Triki, S. Hcini, S. Zemni and M. Oumezzine, J. Magn. Magn. Mater., 2014, 371, 69–76 CrossRef CAS.
- M. Pollak, Philos. Magn., 1971, 23, 519 CrossRef CAS.
- S. Mollah, K. K. Som, K. Bose and B. K. Chaudhuri, J. Appl. Phys., 1993, 74, 931 CrossRef CAS.
- A. Ghosh, Phys. Rev. B: Condens. Matter Mater. Phys., 1990, 41, 1479 CrossRef CAS PubMed.
- M. Megdiche, C. Perrin-Pellegrino and M. Gargouri, J. Alloys Compd., 2014, 584, 209 CrossRef CAS.
- A. Banerjee, S. Pal and B. K. Chaudhuri, J. Chem. Phys., 2001, 115, 1550 CrossRef CAS.
- A. Banerjee, S. Pal, S. Bhattacharya, B. K. Chaudhuri and H. D. Yang, Phys. Rev. B: Condens. Matter Mater. Phys., 2001, 64, 104428 CrossRef.
- F. B. Abdallah, A. Benali, S. Azizi, M. Triki, E. Dhahri, M. P. F. Graça and M. A. Valente, J. Mater. Sci. Mater. Electron., 2019, 30, 8457 CrossRef CAS.
- M. H. Dhaou, S. Hcini, A. Mallah, M. L. Bouazizi and A. Jemni, Appl. Phys. A, 2017, 123, 8 CrossRef.
- A. Benali, M. Bejar, E. Dhahri, M. F. P. Graça and L. C. Costa, J. Alloys Compd., 2015, 653, 506 CrossRef CAS.
- A. K. Roy, A. Singh, K. Kumari, K. Amar Nath, A. Prasad and K. Prasad, ISRN Ceram, 2012, 2012, 1–10 CrossRef.
- N. F. Mofft and E. A. Davis, Electronic Processes in Non-Crystalline Materials, Oxford, Great Britain, 1979 Search PubMed.
- J. C. Maxwell, Electricity and Magnetism, Oxford University Press, London, 1973 Search PubMed.
- K. W. Wagner, Ann. Phys., 1913, 40, 817 CrossRef.
- J. H. Joshi, G. M. Joshi, M. J. Joshi and K. D. Parikh, Ionics, 2019, 25, 3245 CrossRef.
- P. A. Jadhav, R. S. Devan, Y. D. Kolekar and B. K. Chougule, J. Phys. Chem. Solids, 2009, 70, 396 CrossRef CAS.
- J. C. Giuntini, J. V. Zanchetta, D. Jullien, R. Eholie and P. Houenou, J. Non-Cryst. Solids, 1981, 45, 57 CrossRef CAS.
- J. R. Macdonald, Impedance Spectroscopy Emphasizing Solid Materials and Systems, 1987 Search PubMed.
- J. H. Joshi, D. K. Kanchan, M. J. Joshi, H. O. Jethva and K. D. Parikh, Mater. Res. Bull., 2017, 93, 73 CrossRef.
- H. Ye and R. B. Jackman, J. Appl. Phys., 2003, 94, 7878 CrossRef CAS.
- P. B. Macedo, C. T. Moynihan and R. Bose, Phys. Chem., 1972, 13, 171 CAS.
- J. H. Joshi, G. M. Joshi, M. J. Joshi, H. O. Jethvaa and K. D. Parikh, New J. Chem., 2018, 42, 17249 Search PubMed.
- V. Provenzano, L. P. Boesch, V. Volterra, C. T. Moynihan and P. B. Macedo, J. Am. Ceram. Soc., 1972, 55, 492 CrossRef CAS.
- H. Jain and C. H. Hsieh, J. Non-Cryst. Solids, 1994, 172, 1408 CrossRef.
- A. K. Jonscher, The ‘universal’ dielectric response, Nature, 1977, 267, 673–679 CrossRef CAS.
- M. A. Valente, M. Peres, C. Nico, T. Monteiro, M. P. F. Graça, A. S. B. Sombra and C. C. Silva, Opti. Mat., 2011, 33, 1964 CrossRef CAS.
- D. C. Sinclair and A. R. West, J. Appl. Phys., 1989, 66, 3850 CrossRef CAS.
- M. A. L. Nobre and S. Lanfredi, J. Appl. Phys., 2003, 93, 5557 CrossRef CAS.
- S. K. Rout, S. Parida, E. Sinha, P. K. Barhai and I. W. Kim, Curr. Appl. Phys., 2010, 10, 917 CrossRef.
- K. S. Cole and R. H. Cole, J. Chem. Phys., 1941, 9, 341 CrossRef CAS.
- J. R. Macdonald, Impedance Spectroscopy Emphasizing Solid Materials and Systems, 1987 Search PubMed.
- J. H. Joshi, D. K. Kanchan, H. O. Jethva, M. J. Joshi and K. D. Parikh, Ionics, 2018, 24, 2016 CrossRef.
- B. Behera, P. Nayak and R. N. P. Choudhary, Mater. Res. Bull., 2008, 43, 401–410 CrossRef CAS.
- N. H. Vasoya, P. K. Jha, K. G. Saija, S. N. Dolia, K. B. Zankat and K. B. Modi, J. Electron. Mater., 2016, 45, 917 CrossRef CAS.
- B. Behera, P. Nayaka and R. N. P. Choudhary, Mater. Chem. Phys., 2007, 106–193 Search PubMed.
- C. B. Mohamed, K. Karoui, S. Saidi, K. Guidara and A. B. Rhaiem, Physica B, 2014, 451, 87 CrossRef CAS.
- N. Sivakumar, A. Narayanasamy, N. Ponpandian and G. Govindaraj, J. Appl. Phys., 2007, 101, 084116 CrossRef.
- S. Hcini, A. Omri, M. Boudard, M. L. Bouazizi, A. Dhahri and K. Touileb, J. Mater. Sci.: Mater. Electron., 2018, 29, 6879 CrossRef CAS.
| This journal is © The Royal Society of Chemistry 2022 |


