 Open Access Article
Near-perfect spectrally-selective metasurface solar absorber based on tungsten octagonal prism array†
Mingpan Xua,
Lin Guo b,
Pengfei Zhanga,
Yu Qiu
 *a,
Qing Li
 *a and
Jikang Wanga
aSchool of Energy Science and Engineering, Central South University, Changsha, Hunan 410083, China. E-mail: yu.qiu@csu.edu.cn; qingli@csu.edu.cn
bEnergy Research Institute, Qilu University of Technology, Jinan, 250014, P. R. China
First published on 7th June 2022
Abstract
Solar selective absorbers influence the photothermal efficiency of high-temperature solar thermal applications directly and significantly. In present work, a metasurface absorber consisting of an octagonal prism array is proposed, optimized and analyzed. Firstly, the structure parameters of the absorber are optimized, finding the optimal absorber achieves near-perfect spectrally-selectivity compared with the perfect solar absorber. The high solar absorptivity of 0.9591, low emissivity of 0.1594–0.3694, and high photothermal efficiency of 94.72–83.10% are achieved at 1073–1573 K and 1000 suns. Then, the mechanisms leading to the excellent spectral selectivity are investigated, suggesting that the coupling effects of multi-plasmon resonance modes and the impedance matching lead to the high solar absorptivity. Meanwhile, the impedance mismatching is the mechanism to minimize the emissivity in the mid-IR region. Moreover, whether the spectral absorptivity can be changed by structural parameters is investigated, suggesting that the excircle diameter of the first tungsten octagonal prism and the height of SiO2 under the octagonal prism can influence the spectral absorptivity obviously. Finally, the metasurface absorber is demonstrated to be highly insensitive to both polarization and incident angles. These results suggest that the proposed metasurface absorber should be suitable for high-temperature solar thermal devices.
1. Introduction
Solar energy, as an abundant, clean, and sustainable renewable energy, has gained much attention in recent years because of its ability to alleviate energy shortage and reduce environmental pollution from fossil fuels.1–3 Concentrated solar power is a promising technology that generates electricity through solar-thermal conversion and thermal-driven power cycle.4 To improve the power cycle efficiency, the temperature of the solar–thermal conversion has been increased continuously during the last two decades.55 Recently, a solar power tower system with graphite-based receiver has even been proposed to operate at above 1300 °C.5,54 However, the radiative thermal loss from the solar absorber increases with the fourth power of temperature, reducing the photothermal efficiency of the absorber significantly.56,57 To ensure that the solar-electric efficiency, which is the product of the photothermal efficiency and the power cycle efficiency, can be improved effectively under high temperature, the photothermal efficiency is necessary to be as high as possible.To enhance the photothermal efficiency, the absorber should exhibit high absorptivity in the solar spectrum and low emissivity in the mid-IR region (i.e. good spectral selectivity).6 However, there are two problems with present state-of-the-art commercial Pyromark absorber when the temperature rises to 1300 °C. Firstly, the solar absorptivity of this commercial absorber is as high as 0.965 within the solar spectrum, but its spectral emissivity also can be as high as ∼0.85 within the mid-IR region.53 Meanwhile, this absorber cannot withstand the high temperature of above 1100 °C.
To solve the two problems, many absorbers have been proposed in the literature, which can be roughly divided into multilayered absorbers and metasurface absorbers (MAs).
The multilayered absorbers were usually designed to utilize the interference effects among different layers to achieve good spectral selectivity.7 For example, He et al. designed a SiO2/AlCrTaTiZrN absorber, obtaining the high solar absorptance (αsol) of 0.928 and high photothermal efficiency (η) of 87.7% at 873 K, when the solar concentration ratio is 100.8 Qiu et al. fabricated a HfB2/TiB2 absorber, which could achieve a high αsol of 0.932 and a high η of 68.6% at 1073 K, when the solar concentration ratio is 100.9 Atasi et al. reported a W/WAlN/WAlON/Al2O3 absorber with the αsol of 0.90, and its εtot is as low as 0.15 at 773 K.10 Nuru et al. fabricated an AlxOy/Pt/AlxOy multilayer absorber, obtaining the αsol of 0.951, and the εtot is as low as 0.08 at 773 K.11 Tian et al. investigated a multilayered stack consisting of SiO2/Al2O3/W/Al2O3/W, founding that the αsol and the photothermal efficiency (η) of it are 0.881 and 82.3% at 673 K, respectively, when the solar concentration ratio is 100.12 Wang et al. demonstrated a SiO2–Si3N4 multilayer, which could obtain the spectral absorptivity (αλ) of 0.95 in the solar spectrum and the spectral emissivity of 0.1 in the mid-IR region.13 AL-Rjoub et al. deposited a WSiAlNx/WSiAlOyNx multilayer absorber with the αsol as high as 0.96 and the εtot as low as 0.11 at 673 K.14 Wang et al. developed a Cr/AlCrN/AlCrNO/AlCrO multilayer absorber, and the results showed that the αsol of 0.94 and the εtot of 0.25 at 773 K are obtained.15
The metasurface absorbers (MAs) were designed to obtain good spectral selectivity through exciting different resonance modes. The geometries of these MAs were designed to possess the sizes equivalent to incident wavelengths to obtain good spectral selectivity through the excitation of multi-plasmon resonance modes. For example, Zhao et al. designed a MA based on C–Si trapezoidal pyramids and Al pyramids, and the results indicated that the average αλ of 0.9316 within 0.3–1.4 μm was obtained owing to the excitation of Surface Plasmon Polaritons (SPPs).16 Zhou et al. proposed a MA consisting of SiO2/Si3N4/Ti substrate and Ti rings, which could achieve the average αλ of 0.9 within 0.3–4 μm and the αsol of 0.97 by enhancing the synergistic effects of the plasmon resonances.17 Liu et al. reported a MA based on a TiN disk array, achieving the αλ higher than 0.90 within 0.316–1.426 μm due to the excitation of plasmonic resonances and their hybrid coupling effects.18 Chen et al. investigated a MA consisting of Ni disks, obtaining the αsol of above 0.90 and the η of as high as 89.01% at 800 K by coupling the SPPs, Magnetic Polaritons (MPs), and the intrinsic absorption of Ni.19 Wu et al. proposed a MA based on nanoporous W/SiO2 film, and the results indicated that the η of 90.32% at 800 K is obtained owing to the impedance matching with the free space.20 Jiang et al. designed a MA by combining a planar multilayer system and a nanowire array, obtaining the average αλ of above 0.9 within the wavelength of 0.3–1.909 μm due to the coupling effects of multiple resonance modes.21 Hassan et al. designed a MA based on nanowire array, which could achieve the average αλ of 0.97 at the wavelength of 0.3–1.3 μm.22
To sum up, even though many solar selective absorbers have been proposed and investigated, however, there are still many problems with these absorbers. Firstly, the photothermal conversion performance of the absorbers has not reached the ideal value. Then, the thermal stability of the absorbers under high temperatures remains relatively low. Finally, the complex structures of some absorbers are difficult to manufacture. Therefore, designing a simple solar absorber that can be easily manufactured and can obtain excellent photothermal conversion performance, eminent thermal stability, incident and polarization angle insensitivity is still a challenging task.
In this article, a spectrally-selective metasurface absorber (MA) based on tungsten octagonal prisms was proposed and investigated. Firstly, structure parameters of the proposed MA were optimized to achieve good spectral selectivity and high photothermal efficiency. Next, a three-dimensional simulation of the electromagnetic fields revealed the physical absorption mechanisms of the MA. In addition, the influences of the structure parameters on the absorption performance were investigated. Finally, the influences of changes in polarization and incident angles were explored. The novelty of this work is that an absorber with simple structure was proposed, and it was proved to be able to achieve higher photothermal efficiency than ten new absorbers proposed within the last five years at various operating conditions. It is well known that 1% improved photothermal efficiency can improve the output of the plant by 0.9–1.4% while keeping investment constant.23 Thus, the proposed absorber is promising to improve the performance of the plant.
2. Design of the metasurface absorber
The metasurface absorber (MA) proposed for high-temperature solar applications is composed of many structural units which are arranged in a periodic way (see Fig. 1a and b). As illustrated in Fig. 1c, the components of the structural unit (see Fig. 1c) are the first and the second tungsten films, the first and the second SiO2 films, the first and the second tungsten octagonal prisms, and the SiO2 octagonal prism. Moreover, considerations for designing different components of the MA are detailed as follows.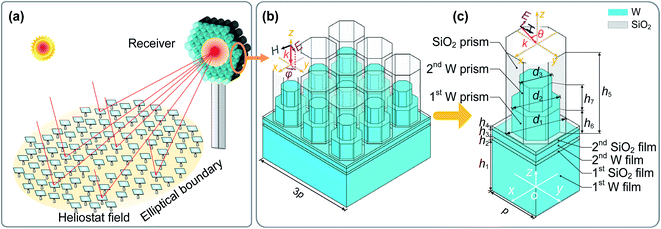 | ||
| Fig. 1 (a) Sketch of a concentrated solar collector; (b) 3D structure of the designed MA; (c) a structural unit. | ||
Firstly, the first SiO2 film between the first and the second tungsten films was designed to produce magnetic polaritons.24 Then, the tungsten octagonal prism array, the second SiO2 film, and the second tungsten film were constructed to excite magnetic polaritons as well. Then, localized surface plasmon resonances (LSPRs) will be excited at the vertex of the tungsten octagonal prism.25 Furthermore, at the upper surface of the first and the second tungsten octagonal prisms, surface plasmon polaritons were excited.25 In addition, the SiO2 octagonal prisms that wrap the tungsten octagonal prisms were constructed to prevent the tungsten from being oxidized and grain growth.26 Moreover, the melting points of the tungsten and SiO2 are 3673 K and 1996 K, respectively, which are much higher than 1573 K. Hence, the proposed absorber will possess excellent thermal stability. Finally, the designed structure can be fabricated by some mature techniques such as ICP etching, magnetic sputterings, atomic layer deposition, and electron-beam lithography.27
Besides, the structure parameters of the proposed MA are also shown in Fig. 1. Where h1, h2, h3, h4, h5, h6, and h7 are the heights of different components, and d1, d2, and d3 are the excircle diameters of the SiO2 octagonal prism, the first and the second tungsten octagonal prisms, respectively. p is the periodicity of the structural unit. In the following sections, firstly, the finite element method is used to calculate the spectral absorptivity of the MA under different structure parameters. Then, the structure parameters would be optimized based on orthogonal experiments to make the spectral selectivity reach the best at high temperature.
3. Simulation methods
A finite element model was developed by solving Maxwell's equations that can describe the solar radiation transport in the proposed MA.28 Owing to the symmetric structure of the MA, only a unit (seen in Fig. 1c) is simulated in the model. In the model, the effects of wavelength on the refractive indexes of the tungsten and SiO2 are considered,29,30 as shown in Fig. S1 in the ESI.†24,25 The transport process of the light in the MA can be described by the Maxwell's equations, which was solved by finite element method using a commercially available software package COMSOL Multiphysics 5.6.31The boundary conditions on the boundaries perpendicular to the x-axis and y-axis are Floquet periodicity boundary conditions. In addition, the boundary conditions on the top surface and bottom surface are port conditions. The port condition on the top surface is used to emit solar radiation into the MA, and the incident angle (θ) and polarization angle (φ) are shown in Fig. 1b and c. The port condition on the bottom surface is used to calculate the transmitted radiation. The height of the first tungsten film (h1) is set to be 150 nm, which exceeds the penetration depth of incident radiation. Therefore, solar radiation cannot penetrate the MA, which has the spectral transmittance (τλ) of zero. The spectral absorptivity (αλ) and spectral reflectance (ρλ) of the MA can be calculated by eqn (1) and (2).32,33
| ρλ = |S11|2 | (1) |
| αλ = 1 − ρλ | (2) |
Some parameters are defined for evaluating the performance of the MA. The solar absorptivity (αsol) equals the proportion of the absorbed solar radiation in the incident solar radiation, as shown in eqn (3).34 The total emissivity (εtot) equals to the ratio of the radiative power values radiated by the MA and blackbody, as illustrated in eqn (4).23 The photothermal efficiency (η) equals the ratio of solar radiation transformed into thermal energy and the incident solar radiation, as shown in eqn (5).35
 | (3) |
 | (4) |
 | (5) |
 | (6) |
To make sure that the simulation results are insensitive to the mesh number, grid independence tests have been performed as illustrated in Table S1 in the ESI.† To validate the current model, the model have been verified through comparing the results calculated by the present model and Han et al.'s model, as shown in Fig. S2 in the ESI.† The results indicate that the present model can be considered reliable.
4. Results and discussion
In the following paragraphs, firstly, a near-perfect metasurface absorber (MA) is designed by optimizing its structure parameters. Next, the underlying absorption mechanisms giving rise to the near-perfect spectrally-selectivity of the MA were revealed and analyzed. Then, the influences of structure parameters on the performance were illustrated. Finally, sensitivities of the MA to incident angle and polarization angle were studied. In addition, it is worth noting that the incident light defaults to be normally incident TM polarized wave.4.1 Near-perfect spectrally-selective metasurface absorber
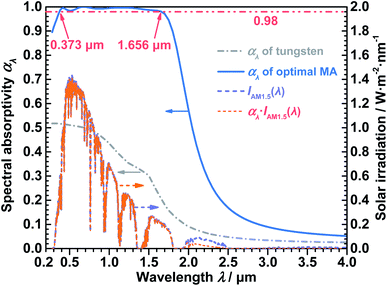
The structures of the metasurface absorber (MA) were optimized by orthogonal tests to obtain good spectral selectivity and solar-thermal conversion performance. In the optimization, the photothermal efficiency (η) under 1573 K and 1000 suns was selected as the object function. After the optimization, a optimal MA with the structure parameters of p = 155 nm, h1 = 150 nm, h2 = 10 nm, h3 = 20 nm, h4 = 10 nm, d1 = 150 nm, h5 = 240 nm, d2 = 130 nm, h6 = 70 nm, d3 = 80 nm and h7 = 70 nm was obtained.The AM1.5 solar spectrum and spectral absorptivity of the optimal MA are demonstrated in Fig. 2. It can be found that the αλ is above 0.9 at the wavelength of 0.285–1.8 μm. Specifically, the αλ even exceeds 0.98 at the wavelength of 0.373–1.656 μm. According to eqn (3), the optimal MA achieves an excellent solar absorptivity (αsol) of 0.9591. In addition, the αλ of a 150 nm tungsten film was also simulated and compared with the optimal MA. As shown in Fig. 2, the αλ of tungsten is 0.3773–0.7885 lower than that of the optimal MA within 0.285–1.8 μm. Meanwhile, the αsol of tungsten is 0.5189 lower than that of the optimal MA, indicating that the reasonable design of the optimal MA has improved the optical performance of tungsten greatly. It also can be found in Fig. 2 that the αλ drops sharply with increasing λ when λ > 1.8 μm, and therefore the αλ even becomes below 0.06 when λ > 3.616 μm. To sum up, the optimal MA exhibits high absorptivity in the solar spectrum and low emissivity in the mid-IR region.
In addition, the total emissivity (εtot) and photothermal efficiency (η) under different MA temperatures (Tabs) when Tamb = 300 K and C = 1000 suns were calculated through eqn (4) and (5) to further demonstrate the spectral selectivity of the optimal MA. It can be observed from Table 1 that the εtot increases with increasing Tabs, and εtot is within 0.1594–0.3694 when Tabs = 1073–1573 K. Besides, η decreases with increasing Tabs, and η is within 83.10–94.72% when Tabs = 1073–1573 K.
| C/suns | Tabs/K | Tamb/K | Current optimal MA | Perfect absorber | ||
|---|---|---|---|---|---|---|
| εtot | η | εtot | η | |||
| 1000 | 1073 | 300 | 0.1594 | 94.72% | 0.3487 | 96.39% |
| 1000 | 1173 | 300 | 0.1990 | 93.78% | 0.3753 | 94.72% |
| 1000 | 1273 | 300 | 0.2410 | 92.32% | 0.1813 | 92.85% |
| 1000 | 1373 | 300 | 0.2841 | 90.20% | 0.2214 | 91.07% |
| 1000 | 1473 | 300 | 0.3272 | 87.19% | 0.2564 | 88.54% |
| 1000 | 1573 | 300 | 0.3694 | 83.10% | 0.2907 | 85.08% |
For a perfect solar absorber, it should achieve the highest η under the corresponding working conditions.38 When the wavelength is smaller than a truncation wavelength, its αλ should be 1. When the wavelength is larger than the truncation wavelength, the its αλ should be 0.39 The εtot and η of the perfect absorber under different Tabs are also calculated when Tamb = 300 K and C = 1000 suns, and the results are shown in Table 1. As illustrated in Table 1, the εtot of the optimal MA is just 0.0597–0.0787 larger than that of the perfect absorber when Tabs = 1273–1573 K. Moreover, the η of the optimal MA is just 0.53–0.1.98% lower than that of the perfect absorber when Tabs = 1073–1573 K. Thus, it is concluded that the optimal MA can convert solar energy to thermal energy efficiently at high temperatures, and the spectral selectivity is almost the same as that of the perfect absorber. Hence, the optimal MA can be considered as a near-perfect spectrally-selective absorber.
Furthermore, the performance of the near-perfect MA was compared with that of some previously developed absorbers in Table 2. As can be seen in Table 2, Wu et al. designed a MA based on nanoporous W/SiO2 film, which can obtain the η of 90.32% that is 2.52% lower than the 92.84% of the near-perfect MA when C = 1 and Tabs = 373 K.20 Wang et al. reported an absorber using manganese-iron oxide nanoparticles, achieving the η of 89.30% that is 5.74% lower than the 95.04% of the present near-perfect MA under C = 1000 and Tabs = 1023 K.40 Niranjan et al. studied a W/WAlSiN/SiON/SiO2 multilayer, which can obtain the η of 89.50% that is 5.01% lower than the 94.51% of the near-perfect MA when C = 100 and Tabs = 773 K.41 He et al. studied an absorber based on alloy nitride MoTaTiCrN nanofilms, obtaining the η of 86.90% that is 6.92% lower than the 93.82% of the near-perfect MA under C = 100 and Tabs = 823 K.42 Ye et al. reported an absorber based on a tungsten sphere and cuboid array, which can achieve the η of 87.56% that is 0.81% lower than the 88.37% of the near-perfect MA when C = 100 and Tabs = 1000 K.43 Zhang et al. designed a chimney-like absorber, which can obtain the η of 91.62% that is 1.83% lower than the 93.45% of the near-perfect MA when C = 1000 and Tabs = 1200 K.44 Li et al. reported an absorber based on TiN particles, obtaining the η of 93.00% that is 1.12% lower than the 94.12% of the near-perfect MA when C = 1 and Tabs = 373 K.45 Zhao et al. proposed a Al0.4Hf0.6NbTaTiZrN MA, which can achieve the η of 74.90% that is 20.45% lower than the 95.35% of the near-perfect MA under C = 100 and Tabs = 673 K.46 Raza et al. designed an absorber using SiC–W nanoparticles, achieving the η of 82.68% that is 3.13% lower than the 85.81% of the near-perfect MA under C = 100 and Tabs = 1050 K.47 Qiu et al. studied an absorber based on TiB2–ZrB2 composite ceramic, which can obtain the η of 83.90% that is 10.61% lower than the 94.51% of the near-perfect MA when C = 100 and Tabs = 773 K.48 He et al. reported a double-layer alloy nitride HfNbTaTiZrN absorber, obtaining the η of 90.10% that is 3.75% lower than the 93.85% of the near-perfect MA under C = 100 and Tabs = 823 K.49 The above mentioned results demonstrate that the photothermal conversion performance of the present near-perfect MA is better than some previously absorbers.
| Absorber | C | Tabs/K | Tamb/K | αsol | εtot | η |
|---|---|---|---|---|---|---|
| Present | 1 | 373 K | 0 | 0.9591 | 0.2800 | 92.84% |
| Ref. 20 | 1 | 373 K | 0 | — | — | 90.32% |
| Present | 1000 | 1023 | 300 | 0.9591 | 0.1410 | 95.04% |
| Ref. 40 | 1000 | 1023 | 300 | 0.9270 | 0.5500 | 89.30% |
| Present | 100 | 773 | 0 | 0.9591 | 0.0693 | 94.51% |
| Ref. 41 | 100 | 773 | 0 | 0.9550 | 0.1570 | 89.50% |
| Present | 100 | 823 | 300 | 0.9591 | 0.0805 | 93.82% |
| Ref. 42 | 100 | 823 | 300 | 0.9230 | 0.0650 | 86.90% |
| Present | 100 | 1000 | 0 | 0.9591 | 0.1329 | 88.37% |
| Ref. 43 | 100 | 1000 | 0 | 0.9535 | 0.1375 | 87.56% |
| Present | 1000 | 1273 | 300 | 0.9591 | 0.2102 | 93.45% |
| Ref. 44 | 1000 | 1273 | 300 | 0.9457 | 0.2056 | 91.62% |
| Present | 1 | 373 | 300 | 0.9591 | 0.0280 | 94.12% |
| Ref. 45 | 1 | 373 | 300 | 0.9500 | 0.0300 | 93.00% |
| Present | 100 | 673 | 300 | 0.9591 | 0.0503 | 95.35% |
| Ref. 46 | 100 | 673 | 300 | 0.8600 | 0.1950 | 74.90% |
| Present | 100 | 1050 | 300 | 0.9591 | 0.1475 | 85.81% |
| Ref. 47 | 100 | 1050 | 300 | 0.9545 | 0.2000 | 82.68% |
| Present | 100 | 773 | 0 | 0.9591 | 0.0693 | 94.51% |
| Ref. 48 | 100 | 773 | 0 | 0.9340 | 0.2320 | 83.90% |
| Present | 100 | 823 | 300 | 0.9591 | 0.0805 | 93.85% |
| Ref. 49 | 100 | 823 | 300 | 0.9600 | 0.2250 | 90.10% |
4.2 Mechanisms for the spectrally-selective characteristics
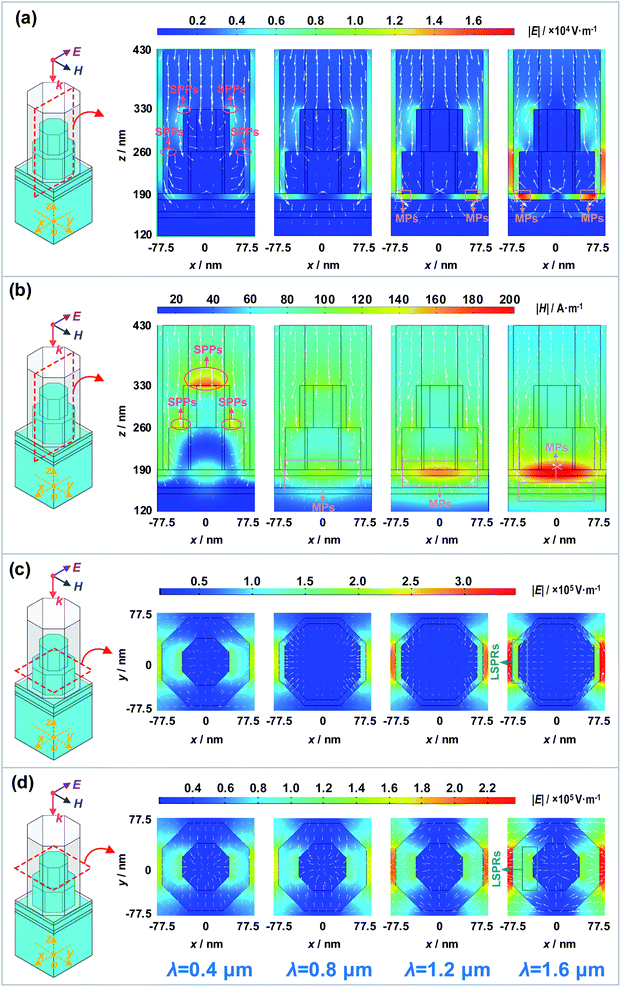
To reveal the mechanisms of the excellent spectral selectivity and the good photothermal performance of the near-perfect MA, the transmission and absorption of solar radiation in the near-perfect MA is simulated. The distributions of the magnitudes of electromagnetic fields and Poynting vectors, the impedance matching between the MA and the free space, and the spectral absorptivity of different components were studied, and the results are as follows.Firstly, to reveal the dissipation mechanisms of electromagnetic waves within the MA, the Poynting vectors and the distributions of the magnitudes of the electric field (|E|) and magnetic field (|H|) were illustrated in Fig. 3.
Fig. 3a and b describe the |E| and |H| distributions in the xz plane at y = 0, respectively. As shown in Fig. 3a and b, there are four regions with strong |E| at both sides of the first and second tungsten octagonal prisms, and three regions with strong |H| appear at the upper surface of the first and second tungsten octagonal prisms. These results suggest the excitation of surface plasmon polaritons (SPPs) at the top of the first and the second tungsten octagonal prisms. In addition, two regions with strong |E| arise at the edges of the bottom of the second tungsten octagonal prism, and two regions with strong |H| arise at the first and second SiO2 films. The |E| and |H| at these regions increase with rising wavelength. These results implicate that magnetic polaritons (MPs) are excited at the first and second SiO2 films, and the intensity of MPs increases with rising wavelength.
Then, because the xy planes at z = 255 nm and z = 295 nm are at the middle of the first and second tungsten octagonal prisms, they are suitable to be selected as the typical planes to illustrate the dissipation mechanisms of electromagnetic waves within the tungsten octagonal prisms. The |E| distributions in these two planes are shown in Fig. 3c and d, respectively. It can be seen in Fig. 3c and d that regions with strong |E| are strongly concentrated at the vertexes of the first and the second tungsten octagonal prisms, which suggests that the local surface plasmon resonances (LSPRs) are excited. In addition, the |E| increases with rising wavelength, indicating that the intensity of LSPRs increases with rising wavelength.
Finally, the energy transport and absorption of the electromagnetic waves are also visually presented in Fig. 3. As can be seen from Fig. 3, most of the Poynting vectors (white arrows) point to four components, including the two tungsten octagonal prisms, and the two tungsten films. This is because there are multiple plasmonic modes in these parts, efficiently converting solar radiation to thermal energy due to ohmic loss.
As discussed above, it can be concluded that the coupling of SPPs, MPs and the LSPRs leads to the good absorption of the radiation within the solar spectrum.
Then, to better explore the absorption mechanisms of the near-perfect MA, the impedance matching of the MA and the free space was studied. The relation between effective impedance (zλ) and S parameters can be described by eqn (7).50,51
 | (7) |
Furthermore, the relation between the zλ and the αλ can be expressed by eqn (8).44 According to eqn (8), perfect spectral absorptivity (αλ) can be achieved when the effective impedance zλ is matched to the impedance of the free space (z0), as shown in eqn (9). In addition, near-zero absorptivity will be achieved when eqn (10) is met.
 | (8) |
| Re(zλ) = Re(z0) = 1, Im(zλ) = Im(z0) = 0 | (9) |
| Re(zλ) = 0, Im(zλ) = 1 | (10) |
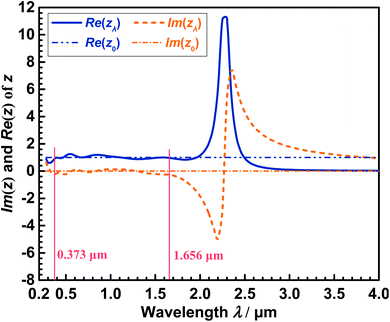
The imaginary part Im(zλ) and real part Re(zλ) of the effective impedance zλ of the near-perfect MA are calculated and illustrated in Fig. 4. It is manifest from the Fig. 4 that Im(zλ) and Re(zλ) are nearly 0 and 1 within λ = 0.373–1.656 μm, which agrees with the near-perfect αλ (>0.98) within this region in Fig. 4. Furthermore, the Im(zλ) and Re(zλ) appear dramatic changes within λ = 2–3.5 μm, which causes a rapid decrease in the αλ. Meanwhile, Im(zλ) and Re(zλ) are close to 1 and 0, respectively, when λ > 3.5 μm, which leads to almost 0 of the αλ. The above results indicate that the impedance of the near-perfect MA highly matches that of the free space within λ = 0.373–1.656 μm, but they doesn't match with each other at all when λ > 3.5 μm.
Then, to investigate the energy absorption capacities of different components in the near-perfect MA, the spectral absorptivity of the five components was studied. It can be observed from Fig. 5a that the prisms play significant roles in enhancing the absorption performance, and the first and the second tungsten films also contribute some αλ. This is because the prisms introduce multiple resonance modes which enhance the transports of the electromagnetic waves in the tungsten, where the electromagnetic waves are dissipated quickly due to ohmic loss. Meanwhile, the αλ curves of the first and the second SiO2 films are close to zero within the whole solar spectrum. However, the two films are still necessary for improving the αλ, because they can be combined with adjacent tungsten components to build a metal–dielectric–metal structure for exciting MPs, and also can protect the MA from being oxidized.
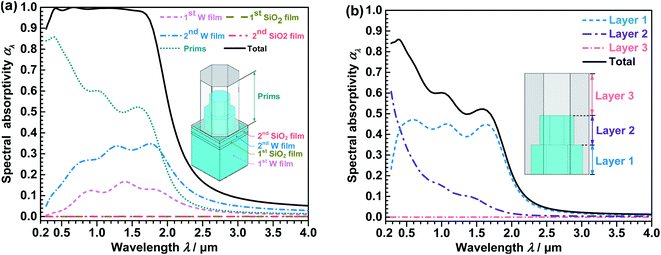 | ||
| Fig. 5 Spectral absorptivity (αλ) of different parts of the near-perfect MA. (a) αλ of different components; (b) αλ of different layers of the prims. | ||
In addition, to analyze the influences of the prisms in the near-perfect MA, the prisms are divided into three layers in Fig. 5b. It is manifest from the Fig. 5b that the αλ of the layer 1, layer 2 and layer 3 are approximately 0.9–47.1%, 0.3–60.7%, and ∼0 when λ = 0.28–4.0 μm, respectively. As the wavelength increases, the αλ of layer 2 decreases gradually, resulting in the decrease in the αλ of the prisms. However, the αλ values of the first and the second tungsten films are increased at the same time (see Fig. 5a), so the αλ of the MA is near perfect within λ = 0.373–1.656 μm. Meanwhile, the αλ of layer 3 is nearly zero, which suggests that this layer barely absorbs the electromagnetic waves. Nevertheless, layer 3 is also essential for the MA, because it can protect the MA from oxidation.
4.3 Influences of structure parameters on the spectral absorptivity
According to the analysis in the previous section, the excellent spectral selectivity of the near-perfect MA is due to the coupling effects of multi-plasmon resonance modes and the impedance matching with the free space at octagonal prisms and underneath films. However, the influences of their structure parameters on the absorption performance of the MA are still unclear. Therefore, geometric influences on the spectral absorptivity were analyzed in this section. Meanwhile, it should be noted that the other parameters remained identical to the optimal parameter values when one parameter was analyzed.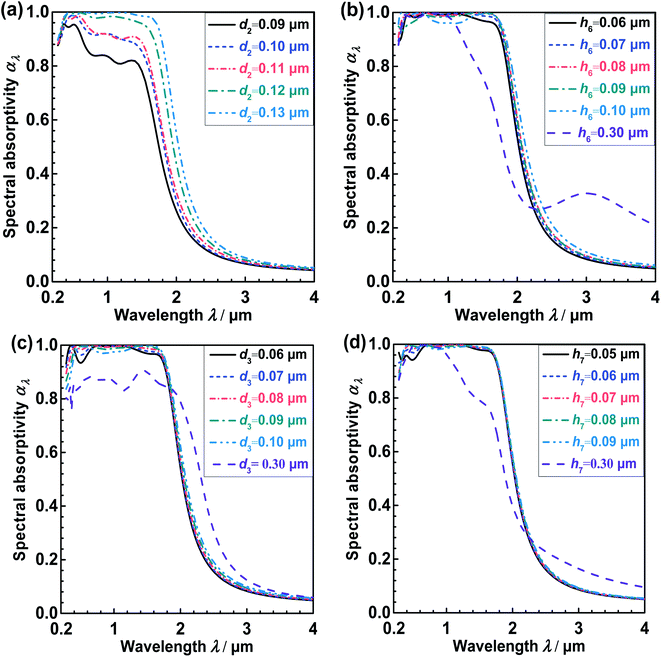 | ||
| Fig. 6 Spectral absorptivity (αλ) of the MA at different structure parameters of tungsten octagonal prisms. (a) Influences of d2; (b) influences of h6; (c) influences of d3; (d) influences of h7. | ||
It is manifest from the Fig. 6a that the αλ ascends obviously with increasing d2 in the whole solar spectrum region. This is because the first tungsten octagonal prism can not only excite SPPs and LSPRs, but also can excite MPs together with the second SiO2 film and the second tungsten film. Therefore, d2 has a great influence on the αλ of the MA. As shown in Fig. 6b, when h6 = 0.06–0.10 μm, the αλ varies irregularly and slightly within λ = 0.28–1.8 μm, however it increases slightly with increasing h6 when λ > 1.8 μm. In addition, when the h6 increases from 0.1 μm to 0.30 μm, the αλ declines sharply within λ = 1.0–2.2 μm but increases obviously within λ = 2.2–4.0 μm. As shown in Fig. 6c, when d3 = 0.06–0.10 μm, the αλ increases slightly when λ is around 0.4 μm but decreases appreciably within λ = 0.28–2.0 μm with increasing d3. Moreover, αλ increases significantly within λ = 2.2–4.0 μm when d3 increases from 0.10 μm to 0.30 μm. As is presented in Fig. 6d, the increase in h7 has a little influence on the αλ within λ = 0.28–4 μm when h6 = 0.05–0.09 μm. However, the αλ declines dramatically within λ = 0.8–2.2 μm and increases obviously within λ = 2.2–4.0 μm when the h7 increases to 0.30 μm.
To sum up, all the parameters related to the octagonal prisms will affect αλ of the MA. It is known that the fabrication uncertainties of the absorber are smaller than 0.01 μm.52 When the variations of these parameters are within the fabrication uncertainties, only the d2 has obvious influences on the αλ, indicating that d2 should be controlled carefully in the fabrication. However, h6, d3, and h7 influence αλ slightly, indicating that these geometries are able to sustain relatively large fabrication uncertainties.
 | ||
| Fig. 7 Spectral absorptivity (αλ) of the MA at different structure parameters of underneath films (a) influences of h2; (b) influences of h3; (c) influences of h4. | ||
It can be found from Fig. 8a that the αλ remains virtually unchanged within λ = 0.28–1.8 μm when h2 increases from 0.01 μm to 0.05 μm, but αλ declines obviously when h2 increases from 0.05 μm to 0.20 μm. In addition, the αλ exhibits an upward trend with the increase in h2 when λ is larger than 1.8 μm within h2 = 0.01–0.05 μm. Moreover, the increase in αλ is significant when the h2 increases to 0.20 μm within λ > 1.8 μm. As shown in Fig. 8b, the αλ varies slightly when h3 = 0.01–0.20 μm within λ = 0.28–4 μm, suggesting that this parameter has little influences on the absorption performance. It is manifest from the Fig. 8c that the αλ declines gradually with increasing h4 within 0.3–2 μm, but the αλ hardly changes as h4 changes when λ = 2–4 μm.
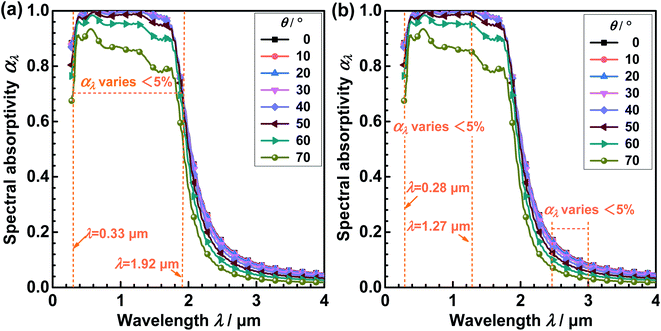 | ||
| Fig. 8 Spectral absorptivity (αλ) under various incident angles (θ). (a) αλ of TE wave. (b) αλ of TM wave. | ||
To sum up, the h4 has obviously influences on the αλ of the MA when λ = 0.35–2 μm, but the h2 has slight influences on the αλ within the fabrication uncertainty. And the h3 influences little on the αλ when h3 = 0.01–0.20 μm.
4.4 Influences of incident angle and polarization angle
The incident and polarization angles of realistic solar radiation are variational in practical applications, and the MA should be insensitive to these angles for converting radiation into heat effectively. Therefore, the sensitivities of the near-perfect MA to the incident angle θ and polarization angle φ (seen Fig. 1c) were studied within λ = 0.28–4.0 μm in this section.The influences of the θ of TE and TM polarized waves on the αλ of the near-perfect MA were evaluated, as shown in Fig. 8. It can be observed from Fig. 8a that the αλ of the near-perfect MA changes 5% or less when the θ of the TE polarized wave increases from 0° to 50° within λ = 0.33–1.92 μm. Moreover, as seen in Fig. 8b, the αλ changes 5% or less when the θ of the TM polarized wave increases from 0° to 50° within 0.28–1.27 μm and 2.44–3.00 μm.
Meanwhile, the solar absorptivity (αsol) of the near-perfect MA under TE and TM polarized waves with various incident angles are shown in Fig. 9. As can be seen in Fig. 9, when the θ is within 0–50°, the solar absorptivity (αsol) of 0.9591–0.9572 and 0.9591–0.9471 were achieved by the TE and TM polarized waves, respectively. These results suggest that the near-perfect MA presents excellent insensitivity when the incident angle is within 0–50°.
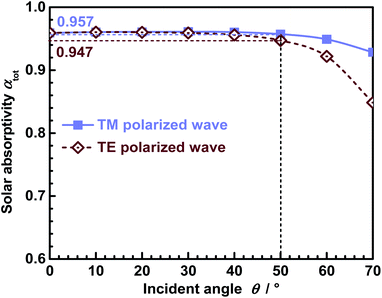 | ||
| Fig. 9 Solar absorptivity (αsol) of the MA under TE and TM polarized waves with various incident angles. | ||
In addition, it can be found from Fig. 10 that the αλ of the near-perfect MA is almost unchanged when the φ of the normally incident wave increases from 0° to 90°. The results indicate that the near-perfect MA is completely insensitive to the φ in Fig. 1c when λ = 0.28–4.0 μm. Moreover, because the near-perfect MA is rotationally symmetric, its αλ under normally incident TE polarized wave (i.e. the electric field is in the y direction) and TM polarized wave are the same. Additionally, the symmetric structure of the near-perfect MA is also the main reason to obtain excellent polarization insensitivity.17
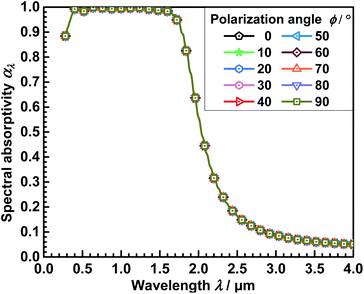 | ||
| Fig. 10 Spectral absorptivity (αλ) under normally incident wave with various polarization angles (φ). | ||
5. Conclusions
In this article, a near-perfect spectrally-selective metasurface solar absorber consisting of an octagonal prism array is designed and investigated for solar energy harvesting at high temperatures, and the following conclusions are obtained.(1) A near-perfect spectrally-selective absorber with p = 155 nm, h1 = 150 nm, h2 = 10 nm, h3 = 20 nm, h4 = 10 nm, d1 = 150 nm, h5 = 240 nm, d2 = 130 nm, h6 = 70 nm, d3 = 80 nm, and h7 = 70 nm was obtained after optimizing the metasurface structure. The high solar absorptivity of 0.9591 and a low emissivity of 0.1594–0.3694 were achieved by the near-perfect absorber, leading to high photothermal efficiency of 94.72–83.10% under 1000 suns and 1073–1573 K.
(2) The underlying absorption mechanisms leading to the spectral selective absorption of this near-perfect absorber were revealed. It is found that coupling effects of multi-plasmon resonance modes combined with the impedance matching with the free space lead to the high solar absorptivity. Moreover, the impedance mismatching is the mechanism to minimize the emissivity in the mid-IR region.
(3) Influences of the structure parameters of the absorber are studied. The results suggest that the excircle diameter of the first tungsten octagonal prism and the height of the SiO2 under the octagonal prism have stronger influences on the spectral absorptivity than other parameters within the fabrication uncertainty.
(4) Sensitivities of the near-perfect absorber to the incident angle (θ) and polarization angle (φ) are investigated. The solar absorptivity of 0.9591–0.9572 and 0.9591–0.9471 are achieved under TE and TM polarized waves within θ = 0–50°, respectively. And the αλ of the near-perfect MA is almost unchanged within φ = 0–90°. These results demonstrate that the near-perfect absorber is insensitive to the incident angle within θ = 0–50° and polarization angle within φ = 0–90°.
Abbreviations
| C | Solar concentration ratio |
| d1 | Excircle diameter of the SiO2 octagonal prism (nm) |
| d2 | Excircle diameter of the first tungsten octagonal prism (nm) |
| d3 | Excircle diameter of the second tungsten octagonal prism (nm) |
| E | Electric field (V m−1) |
| h1 | Height of the first tungsten film (nm) |
| h2 | Height of the first SiO2 film (nm) |
| h3 | Height of the second tungsten film (nm) |
| h4 | Height of the second SiO2 film (nm) |
| h5 | Height of the SiO2 octagonal prism (nm) |
| h6 | Height of the first tungsten octagonal prism (nm) |
| h7 | Height of the second tungsten octagonal prism (nm) |
| H | Magnetic field (A m−1) |
| Is | Solar flux intensity at AM1.5, 1000 W m−2 |
| IAM1.5(λ) | Spectral solar irradiance at AM1.5 (W m−2 m−1) |
| IB(λ, Tabs) | Spectral irradiance of blackbody (W m−2 m−1) |
| LSPRs | Local Surface Plasmon Resonances |
| MPs | Magnetic Polaritons |
| rdst | Destination origin |
| rsrc | Source origin |
| SPPs | Surface Plasmon Polaritons |
| S11, S21 | Scattering matrix coefficients |
| Tabs | Temperature of metasurface (K) |
| Tamb | Temperature of ambient (K) |
| zλ | Effective impedance of metasurface |
| xyz | Cartesian coordinates (nm) |
| αsol | Solar absorptivity |
| αλ | Spectral absorptivity |
| εtot | Total emissivity |
| η | Photothermal efficiency (%) |
| θ | Incident angle (°) |
| λ | Wavelength (μm) |
| ρλ | Spectral reflectance |
| φ | Polarization angle (°) |
Author contributions
Mingpan Xu: conceptualization, methodology, validation, investigation, visualization, writing – original draft; Lin Guo: methodology, validation, investigation, visualization, writing – original draft; Pengfei Zhang: methodology, validation, investigation, visualization, writing – original draft; Yu Qiu: conceptualization, methodology, investigation, writing – original draft, writing – review & editing, supervision; Qing Li: methodology, formal analysis, writing – review & editing, supervision; Jikang Wang: formal analysis, visualization.Conflicts of interest
The authors declare that they have no known competing financial interests or personal relationships that could have appeared to influence the work reported in this paper.Acknowledgements
This work was supported by the National Natural Science Foundation of China (No.52006247, No.52176093). The authors will also like to thank the Natural Science Foundation of Hunan Province (2021JJ40753), the Natural Science Foundation of Shandong Province (No. ZR2021QE078), and the Collaborative Innovation Project of Colleges in Jinan (No. 2021GXRC059).References
- X. Zheng, D. Qu, Y. Bao, G. Qin, Y. Liu and Q. Luo, J. Chem. Eng. Data, 2022, 67(1), 45–53 CrossRef CAS.
- Y. Dong, H. Han, Y. Qiu, F. Wang, Y. Zhang, Z. Cheng, X. Shi and Y. Yan, Renewable Energy, 2022, 192, 606–616 CrossRef.
- Q. Li, Y. Zhang, Z. Wen and Y. Qiu, Energy Convers. Manage., 2020, 214, 112911 CrossRef.
- K. Wang, P. S. Jia, Y. Zhang, Z. D. Zhang, T. Wang and C. H. Min, Sol. Energy, 2021, 223, 72–86 CrossRef CAS.
- Y. Zhang, Y. Qiu, Q. Li and A. Henry, Appl. Energy, 2021, 307, 118228 CrossRef.
- Y. Qiu, M. Xu, Q. Li, Y. Xu and J. Wang, Energy Convers. Manage., 2021, 227, 113589 CrossRef.
- Z. Wu, J. Wang, Y. Liu, S. Hou, X. Liu, Q. Zhang and F. Cao, Mater. Today Phys., 2021, 18, 100388 CrossRef CAS.
- C. Y. He, X. H. Gao, D. M. Yu, X. L. Qiu, H. X. Guo and G. Liu, J. Mater. Chem. A, 2021, 9, 6413–6422 RSC.
- X. L. Qiu, C. Y. He, P. Zhao, B. H. Liu, H. X. Guo, G. Liu and X. H. Gao, Mater. Today Phys., 2022, 24, 100690 CrossRef.
- A. Dan, A. Soum Glaude, A. Carling Plaza, C. K. Ho, K. Chattopadhyay, H. C. Barshilia and B. Basu, ACS Appl. Energy Mater., 2019, 2, 5557–5567 CrossRef CAS.
- Z. Nuru, M. Msimanga, C. Arendse and M. Maaza, Appl. Surf. Sci., 2014, 298, 176–181 CrossRef CAS.
- Y. Tian, X. Liu, A. Ghanekar and Y. Zheng, Appl. Energy, 2021, 281, 116055 CrossRef CAS.
- H. Wang, H. Alshehri, H. Su and L. Wang, Sol. Energy Mater. Sol. Cells, 2018, 174, 445–452 CrossRef CAS.
- A. AL-Rjoub, L. Rebouta, P. Costa and L. Vieira, Sol. Energy Mater. Sol. Cells, 2018, 186, 300–308 CrossRef CAS.
- X. Wang, X. Zhang, Q. Li, J. Min and X. Cheng, Sol. Energy Mater. Sol. Cells, 2018, 188, 81–92 CrossRef CAS.
- F. Zhao, J. Lin, Z. Lei, Z. Yi, F. Qin, J. Zhang, L. Liu, X. Wu, W. Yang and P. Wu, Phys. Chem. Chem. Phys., 2022, 24, 4871–4880 RSC.
- F. Zhou, F. Qin, Z. Yi, W. Yao, Z. Liu, X. Wu and P. Wu, Phys. Chem. Chem. Phys., 2021, 23, 17041–17048 RSC.
- Z. Liu, G. Liu, Z. Huang, X. Liu and G. Fu, Sol. Energy Mater. Sol. Cells, 2018, 179, 346–352 CrossRef CAS.
- M. Chen and Y. He, Sol. Energy Mater. Sol. Cells, 2018, 188, 156–163 CrossRef CAS.
- D. Wu, C. Liu, Y. Liu, Z. Xu, Z. Yu, L. Yu, L. Chen, R. Ma, J. Zhang and H. Ye, RSC Adv., 2018, 8, 21054–21064 RSC.
- X. Jiang, T. Wang, Q. Zhong, R. Yan and X. Huang, Nanotechnology, 2020, 31, 315202 CrossRef CAS PubMed.
- M. M. Hassan, F. Islam, M. Z. Baten and S. Subrina, RSC Adv., 2021, 11, 37595–37603 RSC.
- Y. Qiu, Y. Xu, Q. Li, J. Wang, Q. Wang and B. Liu, Appl. Energy, 2021, 299, 117290 CrossRef.
- Z. Liu, G. Duan, H. Duan and Z. Wang, Sol. Energy Mater. Sol. Cells, 2022, 240, 111688 CrossRef CAS.
- Z. Wang and P. Cheng, Int. J. Heat Mass Transfer, 2019, 140, 453–482 CrossRef CAS.
- Y. Qiu, P. Zhang, Q. Li, Y. Zhang and W. Li, Sol. Energy, 2021, 230, 1165–1174 CrossRef CAS.
- C. C. Chang, W. J. Kort Kamp, J. Nogan, T. S. Luk, A. K. Azad, A. J. Taylor, D. A. Dalvit, M. Sykora and H. T. Chen, Nano Lett., 2018, 18, 7665–7673 CrossRef CAS PubMed.
- J. C. Maxwell, A treatise on electricity and magnetism, Clarendon press, New York, 1873 Search PubMed.
- E. D. Palik, Handbook of optical constants of solids, Academic press, San Diego, California, 1998 Search PubMed.
- A. D. Rakić, A. B. Djurišić, J. M. Elazar and M. L. Majewski, Appl. Opt., 1998, 37, 5271–5283 CrossRef PubMed.
- COMSOL Multiphysics 5.6, COMSOL Inc, 2020, https://www.comsol.com/ Search PubMed.
- Z. Zheng, Y. Luo, H. Yang, Z. Yi, J. Zhang, Q. Song, W. Yang, C. Liu, X. Wu and P. Wu, Phys. Chem. Chem. Phys., 2022, 24, 8846–8853 RSC.
- Z. Zheng, Y. Zheng, Y. Luo, Z. Yi, J. Zhang, Z. Liu, W. Yang, Y. Yu, X. Wu and P. Wu, Phys. Chem. Chem. Phys., 2022, 24, 2527–2533 RSC.
- Y. Tian, X. Liu, F. Chen and Y. Zheng, OSA Continuum, 2019, 2, 3223–3239 CrossRef CAS.
- F. Cao, K. McEnaney, G. Chen and Z. Ren, Energy Environ. Sci., 2014, 7, 1615–1627 RSC.
- Air Mass 1.5 Spectra, American Society for Testing and Materials (ASTM), available from https://www.nrel.gov/grid/solar-resource/spectra.html.
- A. Narayanaswamy, S. Shen, L. Hu, X. Chen and G. Chen, Appl. Phys. A, 2009, 96, 357–362 CrossRef CAS.
- Q. Wang, H. Yang, M. Hu, J. Cao, G. Pei and H. Yang, J. Cleaner Prod., 2021, 278, 123407 CrossRef.
- Q. Wang, M. Hu, H. Yang, J. Cao, J. Li, Y. Su and G. Pei, Renewable Energy, 2019, 138, 793–804 CrossRef CAS.
- X. Wang, E. Lee, C. Xu and J. Liu, Mater. Today Energy, 2021, 19, 100609 CrossRef CAS.
- K. Niranjan, A. Soum Glaude, A. Carling Plaza, S. Bysakh, S. John and H. C. Barshilia, Sol. Energy Mater. Sol. Cells, 2021, 221, 110905 CrossRef CAS.
- C. He, X. Gao, D. Yu, H. Guo, S. Zhao and G. Liu, ACS Appl. Mater. Interfaces, 2021, 13, 16987–16996 CrossRef CAS PubMed.
- Q. Ye, M. Chen and W. Cai, Sol. Energy, 2019, 184, 489–496 CrossRef CAS.
- J. Qian, J. Zhou, Z. Zhu, Z. Ge, S. Wu, X. Liu and J. Yi, Nanomaterials, 2021, 11, 2709 CrossRef CAS PubMed.
- Y. Li, C. Lin, Z. Wu, Z. Chen, C. Chi, F. Cao, D. Mei, H. Yan, C. Y. Tso and C. Y. Chao, Adv. Mater., 2021, 33, 2005074 CrossRef CAS PubMed.
- S. s. Zhao, X. L. Qiu, C. Y. He, D. M. Yu, G. Liu and X. H. Gao, ACS Appl. Nano Mater., 2021, 4, 4504–4512 CrossRef CAS.
- A. Raza, A. S. Alketbi, R. Devarapalli, H. Li and T. Zhang, Adv. Opt. Mater., 2020, 8, 2000679 CrossRef CAS.
- X. L. Qiu, X. H. Gao, C. Y. He and G. Liu, Opt. Mater., 2020, 100, 109666 CrossRef CAS.
- C. Y. He, X. H. Gao, D. M. Yu, S. S. Zhao, H. X. Guo and G. Liu, J. Mater. Chem. A, 2021, 9, 21270–21280 RSC.
- X. Wu, Y. Zheng, Y. Luo, J. Zhang, Z. Yi, X. Wu, S. Cheng, W. Yang, Y. Yu and P. Wu, Phys. Chem. Chem. Phys., 2021, 23, 26864–26873 RSC.
- H. Chen, Z. Chen, H. Yang, L. Wen, Z. Yi, Z. Zhou, B. Dai, J. Zhang, X. Wu and P. Wu, RSC Adv., 2022, 12, 7821–7829 RSC.
- Y. Qiu, M. Xu, Q. Li, R. Huang and J. Wang, ES Energy Environ., 2021, 13, 77–90 CAS.
- W. Wang, M. Li, R. Jiang, Y. Hu and Y. He, Renewable Energy, 2022, 185, 159–171 CrossRef.
- Q. Li, E. E, J. Wang and Y. Zhang, Energy Convers. Manage., 2022, 260, 115618 CrossRef CAS.
- Y. L. He, Y. Qiu, K. Wang, F. Yuan, W. Q. Wang, M. J. Li and J. Q. Guo, Energy, 2020, 198, 117373 CrossRef CAS.
- Y. Qiu, Y. Zhang, Q. Li, Y. Xu and Z. X. Wen, Appl. Energy, 2020, 279, 115810 CrossRef.
- K. Wang, Z. D. Zhang, X. Y. Zhang and C. H. Min, Int. J. Heat Mass Transfer, 2021, 175, 121130 CrossRef CAS.
Footnote |
| † Electronic supplementary information (ESI) available. See https://doi.org/10.1039/d2ra02802f |
| This journal is © The Royal Society of Chemistry 2022 |

