 Open Access Article
A facile fluorescent sensor based on nitrogen-doped carbon dots derived from Listeria monocytogenes for highly selective and visual detection of iodide and pH†
Mingsha Jie ab,
Ruipeng Guoc,
Yanan Zhanga,
Jianing Huanga,
Gaigai Xua,
Min Liab,
Xiaoyue Yue
 ab,
Baocheng Jiab and
Yanhong Bai*ab
aCollege of Food and Bioengineering, Zhengzhou University of Light Industry, Zhengzhou, Henan Province 450001, P. R. China. E-mail: baiyanhong212@163.com; Fax: +86-28-82890825; Tel: +86-28-82890810
bHenan Key Laboratory of Cold Chain Food Quality and Safety Control, Zhengzhou, Henan Province 450001, P. R. China
cSchool of Mechanical and Electrical Engineering, Henan Vocational College of Applied Technology, Zhengzhou, Henan Province 450042, P. R. China
First published on 4th March 2022
Abstract
Sensitive and visual analysis of iodide (I−) and pH is significant in environmental and food applications. Herein, we present a facile fluorescent sensor for highly selective and visual detection of I− and pH based on nitrogen-doped carbon dots derived from Listeria monocytogenes (NCDs-LM). The NCDs-LM-based fluorescent sensor showed a good linear relationship to I− concentrations, and the detection limit was calculated as 20 nmol L−1. The developed sensor was successfully applied to the detection of I− in drinking water and milk samples. Meanwhile, the as-synthesized NCDs-LM sensor can be used to detect pH, achieving a wide linear pH range. Furthermore, fluorescent test papers based on NCDs-LM were designed for semi-quantitative detection of I− and pH via the naked-eye colorimetric assay. The present work indicates that the NCDs-LM-based fluorescent sensor has high potential for use in environmental monitoring and food analysis.
1. Introduction
Iodine, as an ingredient in human thyroids, plays a critical physiological role in thyroid functions.1,2 A deficiency or excess of iodine can lead to thyroid diseases. The World Health Organization (WHO) has recommended that the daily intake of iodine is 150 μg per day for adults and 250 μg per day for pregnant women.3–5 Commonly, iodine intake by humans is mostly through their diet and trace amounts from drinking water.6 The iodine concentration in water and foods is highly variable. The richest iodine sources are iodized salt (76 mg kg−1), marine products (160–3200 μg kg−1), eggs (93 μg kg−1), whole cow's milk (27–47 μg kg−1), and food products derived from them, and drinking-water (0–8 μg L−1).7 Iodine occurs in food and water mainly as iodide (I−). Measurements of I− in samples and drinking water are of considerable interest as they can be used as dietary iodine intake monitors.The low concentration of I− in most foods and drinking water,8 quantitative analysis of trace levels of I− present in the food and environmental samples is still a challenge. Thus, accurate and precise quantification of I− requires a sensitive analytical method to be applicable to a large range of food products. Thus far, several methods, including ion-selective electrodes,9,10 chromatography,11 mass spectrometry,12 capillary electrophoresis,13 electrochemical detection,14,15 and chemiluminescence detection16,17 have been used to analyze I−. Nevertheless, these methods are time-consuming, suffer from matrix effects, and are not applicable to all product types. On the other hand, the fluorescent sensors have been used to detect I−,18 because of their simplicity, fast response, and good selectivity.19,20 However, the fluorescent probes used by these sensors are generally expensive, difficult to manufacture, and poor photostability. Hence, it is needed to develop an economical, facile, and hydrophilic fluorescent nanomaterial for assembling sensitive and selective I− sensors.
As an essential measurement parameter, pH plays a vital role in environmental monitoring and food analysis.21,22 For instance, measuring the pH of water can rapidly assess water pollution. And, determining the pH of fruits and vegetables can accurately judge their maturity. Thus, accurate sensing of pH is of vital importance. Glass membrane electrodes (GMEs) have been widely used for pH detection.23 Nevertheless, GMEs has some shortcomings, such as mechanical fragility, temperature-dependent response, and the difficulty in the measurements of small-volume samples. Therefore, there is an imperative need for developing a cheap, stable, and small volume pH detector. Compared with the GMEs, the fluorescent pH sensor is a promising complementary strategy due to its good optical stability and advantages in low-concentration sample determination.24,25 Recently, organic fluorescent small molecules have found significant availability in pH sensing with adjustable structures and tunable fluorescence.26 In contrast, their chemical and photostability needs to be improved in practical applications. Therefore, it is necessary to develop a stable fluorescence sensing material with excellent optical properties, cheap to produce and easy to handle for pH detection.
Carbon dots (CDs) are novel fluorescent materials with excellent optical stability, biocompatibility, and surface functionalization,27,28 which is suitable to fabricate fluorescent sensors for I− and pH detection.29,30 For example, He et al. reported the CDs manufactured fluorescent ‘off–on’ sensors for detection of Hg2+ and I− in lake water and cattle urine.31 Shi et al. published a CDs-based ratiometric fluorescence sensor for intracellular pH detection.32 It was reported that nitrogen doping could endow CDs with new structural and photoluminescence properties.33 And, nitrogen-doped CDs (NCDs) have been used in the field of fluorescent sensors.34,35 Until now, various chemical and natural sources have been used as precursors to synthesize CDs/NCDs.36,37 Bacteria are abundant and low-cost precursors, and CDs/NCDs prepared from bacteria have been used in antibacterial and biological imaging fields.38,39 However, studies on the use of Listeria monocytogenes-derived NCDs as fluorescent probes for selective and visual detecting I− and pH are currently lacking. Thus, much effort is necessary to design a simple, low cost and environmentally-friendly sensor for the determination of I− and pH in food and environmental samples.
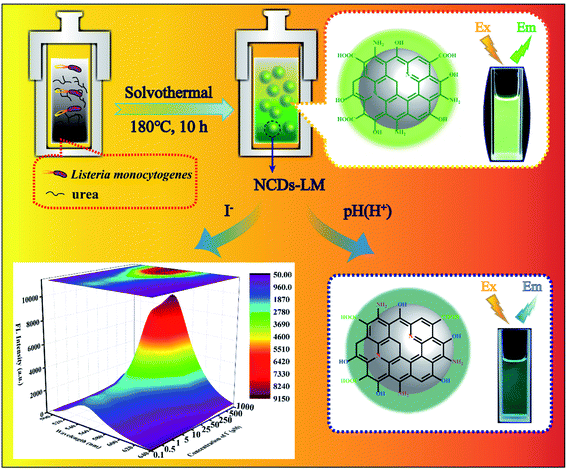
Driven by the demand, we herein report a facile, green, and turning wastes into wealth route using bacteria Listeria monocytogenes (LM) and urea to solvothermal synthesize typical material (denoted as NCDs-LM). As illustrated in Scheme 1, the obtained NCDs-LM was acted as the probes to fabricate fluorescent sensors towards I− and pH detections. On the one hand, a fluorescence “turn on” sensor was used to detect I− selectively and sensitively. At the same time, the NCDs-LM showed pH sensitivity and were successfully applied in wide-range pH detection. Notably, a portable NCDs-LM-based test paper was also prepared for visual and semi-quantitative detection of I− and pH in food and environmental samples. The as-prepared NCDs-LM-based sensor was demonstrated to be low-cost, convenient, rapid, and visual, making it attractive in I− and pH analysis in different kinds of samples.
2. Experimental section
2.1. Materials and apparatus
KI and Hg(NO3)2 were purchased from Aladdin Reagent Int (Shanghai, China). NaHSO4, NaNO2, Na2S, NaHSO3, CH3COONa, NaNO3, (NH4)2SO4, NaHCO3, KH2PO4, KCl, and KBr were obtained from Sinopharm Chemical Reagent Co., Ltd. (Shanghai, China). Bacterial cultures Listeria monocytogenes (ATCC 15313) were employed from American Type Culture Collection (ATCC). Trypticase soy broth (TSB) medium used for bacterial cultures was procured from Qingdao Hope Bio-Technology Co. Ltd (Qingdao, China). Microfiltration membrane (pore diameter: 0.22 μmol L−1) was ordered from Tianjin Jinteng Experimental Equipment Co., Ltd. (Tianjin, China). Ultrapure water (Millipore, 18.2 MΩ cm, MA, USA) was used in all experiments.2.2. Apparatus
UV-vis absorption spectra were measured on a TU-1810 Ultraviolet-visible spectrophotometer (PERSEE, China). Fluorescence spectra were recorded using a fluorescence spectrophotometer (Hitachi F-7000, Japan). Fourier transform infrared (FTIR) spectra were recorded on an FTIR spectrophotometer (Antaris II, America). Transmission electron microscopy (TEM) images were obtained using a JEM-2100 transmission electron microscope (JEOL, Japan). Transient fluorescence spectrometer was used to measure the fluorescence lifetime (FLS-1000, Edinburgh). Powder X-ray diffraction (XRD) spectra were collected on a D8 Advance Multifunctional X-ray diffractometer (Bruker Germany). X-ray photoelectron spectroscopy (XPS) data were collected by a Thermo ESCALAB 250Xi spectrometer (Thermo Fisher, USA).2.3. Synthesis of NCDs-LM
NCDs-LM were prepared synthesized by a recently reported method with a slight modification.40 Briefly, Listeria monocytogenes were cultured in 30 mL of TSB medium at 37 °C with shaking overnight. Then the cells were harvested by centrifugation at 4000×g for 3 min, washed three times with ultrapure water. After that, the resulting pellets were added 5 g of urea and then re-suspended in 20 mL of N,N-dimethylacetamide. The solution was evenly mixed, and then transferred into a 150 mL Teflon-lined stainless-steel autoclave for reaction at 180 °C for 10 h. Thereafter, the resulting dark-brown solution was centrifuged at 8000×g for 10 min, and the supernatant was filtered through a 0.22 μm filter membrane. Next, the products were purified by silica column chromatography with methanol and ethyl acetate as the eluent. Then, the collected eluate was dried with a vacuum rotary evaporator and was diluted with water to store at 4 °C for standby.2.4. Fluorescence detection of I−
For the I− detection, 400 μL of NCDs-LM dilute solution (100 μg mL−1), and 400 μL of Hg2+ stock solution of 8 μmol L−1 were added to 5 mL polypropylene centrifuge tubes. Then 400 μL of I− standard solutions with different concentrations (0, 0.1, 0.5, 1, 5, 10, 25, 50, 250, 500, 1000 μmol L−1) were subsequently added to the above mixtures. After incubation at room temperature for 10 min, the fluorescence (FL) spectra were monitored (λex = 490 nm). And, aqueous solutions were used in fluorescence detection of I− and all FL measurements were performed under the same conditions.2.5. FL detection of pH
The procedure of pH detection was according to previous literature.41 Specifically, 500 μL of Britton Robinson (BR) buffer at various pH values of 1.81, 1.98, 2.21, 2.87, 3.29, 3.78, 4.10, 4.78, 5.32, 5.72, 6.37, 6.80, 7.24, 7.96, 8.36, 8.69, 9.15, 9.62, 10.38, 10.88, 11.20 and 11.82 were prepared and then added 1.5 mL of the NCDs-LM dilute solution (100 μg mL−1), respectively. The obtained mixture was vortexed thoroughly to stand for 10 min at room temperature, and then transferred into the fluorescent cuvette for the FL measurement. The FL of the NCDs-LM-pH mixture was recorded by an FL spectrophotometer (λex = 490 nm) in the same parameters as Section 2.3 described above.2.6. Application in real samples
Drinking water, milk, and fruit samples were bought from a local supermarket. All the water samples were filtered through 0.22 μm filter membranes before I− and pH analysis. The pretreatment of milk samples was according to China's national standard (GB 5009.267–2020). Specifically, 0.5 mL of 1.0 mol L−1 zinc acetate solution and 0.5 mL of 0.3 mol L−1 potassium ferrocyanide were added into 2 mL of milk samples. After mixing thoroughly, the solution was centrifuged at 8000×g for 10 min. Subsequently, the supernatant was then filtered through 0.22 μm filters. Finally, the filtrate was collected used for I− analysis. Meanwhile, different drinking water and fruits (grape, watermelon, and cantaloupe) were used for pH analysis. Firstly, fruit juices were prepared using a plastic juicer and were centrifuged at 8000×g for 10 min. The resultant suspension was filtered through a 0.22 μm filter membrane and was diluted 10 times with ultrapure water before taking subsequent pH detection experiments. For evaluating the accuracy of pH detection, a commercial pH meter was used to measure the actual pH value of drinking water and fruit samples without the addition of NCDs-LM solution.2.7. Preparation of test papers
For the visual assay of I−, 100 μL of the mixed solution containing the dilute solution of NCDs-LM, Hg2+ solution and a varied concentration of I− solution was dropped on a tailored test paper (diameter of 0.6 cm), and then dried in air. For the naked-eye detection of pH, the dilute solution of NCDs-LM (100 μg mL−1) was firstly mixed with BR buffer solution at different pH values, then dropped 100 μL on the test paper and dried at room temperature. Finally, the test papers were observed under irradiation with the wavelength of 365 nm, and the corresponding fluorescent photos were taken by a smartphone under the same lighting condition.3. Results and discussion
3.1. Characterizations of NCDs-LM
The NCDs-LM were synthesized by a facile solvothermal method with Listeria monocytogenes and urea as the precursor, N,N-dimethylacetamide as the reaction media. The prepared NCDs-LM were analyzed by transmission electron microscopy (TEM), powder X-ray diffraction (XRD) spectra, Fourier transform infrared (FTIR) spectra, and X-ray photoelectron spectroscopy (XPS), respectively. As shown in Fig. 1a and b, the obtained NCDs-LM are regular well-dispersed spherical nanoparticles with the average diameter of 2.4 nm, without the lattice structure. XRD patterns of NCDs-LM display a broad peak centered around 22.8° (2θ) correlated to the amorphous carbon phase (Fig. 1c). The functionalities on the surface of the NCDs-LM were revealed using FTIR. As described in Fig. 1d, the broad band around 3408 cm−1 represents the strong N–H and O–H stretching vibrations. The sharp peaks located at 1261 cm−1, 1504 cm−1, 1629 cm−1, and 2935 cm−1 correspond to C–O–C stretching vibration, N–H bending vibration, C![[double bond, length as m-dash]](https://www.rsc.org/images/entities/char_e001.gif) C stretching vibration, and C–H stretching vibration, respectively. The sharp peaks at 1668 cm−1, 1398 cm−1, and 1190 cm−1 demonstrate the presence of asymmetric C
C stretching vibration, and C–H stretching vibration, respectively. The sharp peaks at 1668 cm−1, 1398 cm−1, and 1190 cm−1 demonstrate the presence of asymmetric C![[double bond, length as m-dash]](https://www.rsc.org/images/entities/char_e001.gif) O stretching vibration, C–N stretching vibration, and C–O stretching vibration.42 All the data clearly show that –OH, –COOH, and –NH2 are located on the surface of the as-prepared NCDs-LM.
O stretching vibration, C–N stretching vibration, and C–O stretching vibration.42 All the data clearly show that –OH, –COOH, and –NH2 are located on the surface of the as-prepared NCDs-LM.
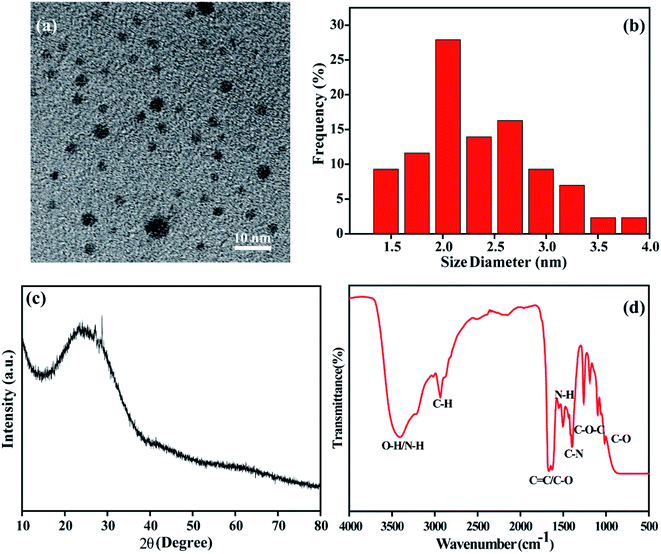 | ||
| Fig. 1 TEM image (a), the corresponding size distribution histograms (b), XRD patterns (c) and FTIR spectra (d) of the prepared NCDs-LM. | ||
XPS was used to further verify the elemental components and functional groups of the resultant NCDs-LM. As presented in Fig. 2a, the element C, N, and O can be obtained in XPS survey spectra of NCDs-LM at peaks of 285 eV, 400 eV, and 531 eV, respectively. The element proportions of NCDs-LM are 77.01% of carbon, 7.98% of nitrogen, and 15.01% of oxygen. Then, the C1s, N1s, and O1s spectra are deconvoluted into various peaks. In Fig. 2b, the C1s spectra can be deconvoluted into three peaks at 284.8, 286.1, and 288.3 eV, representing the C–C/C![[double bond, length as m-dash]](https://www.rsc.org/images/entities/char_e001.gif) C, C–O/C–N, and C
C, C–O/C–N, and C![[double bond, length as m-dash]](https://www.rsc.org/images/entities/char_e001.gif) O/C
O/C![[double bond, length as m-dash]](https://www.rsc.org/images/entities/char_e001.gif) N groups, respectively. The N1s spectra are divided into three peaks at 398.8, 399.8, 400.3 eV, which are assigned to C–N (pyridinic-N), C
N groups, respectively. The N1s spectra are divided into three peaks at 398.8, 399.8, 400.3 eV, which are assigned to C–N (pyridinic-N), C![[double bond, length as m-dash]](https://www.rsc.org/images/entities/char_e001.gif) N (pyrrolic-N), N–H (graphitic-N) bonds, respectively (Fig. 2c). The O1s peaks comprise two components centered at 531.2 and 532.4 eV, indicating that C
N (pyrrolic-N), N–H (graphitic-N) bonds, respectively (Fig. 2c). The O1s peaks comprise two components centered at 531.2 and 532.4 eV, indicating that C![[double bond, length as m-dash]](https://www.rsc.org/images/entities/char_e001.gif) O and C–OH/C–O–C groups are present on the surface of NCDs-LM (Fig. 2d). The XPS results evidence the existence of nitrogen-containing and oxygen-containing groups on the surface of NCDs-LM and support the result of the FTIR spectra.43
O and C–OH/C–O–C groups are present on the surface of NCDs-LM (Fig. 2d). The XPS results evidence the existence of nitrogen-containing and oxygen-containing groups on the surface of NCDs-LM and support the result of the FTIR spectra.43
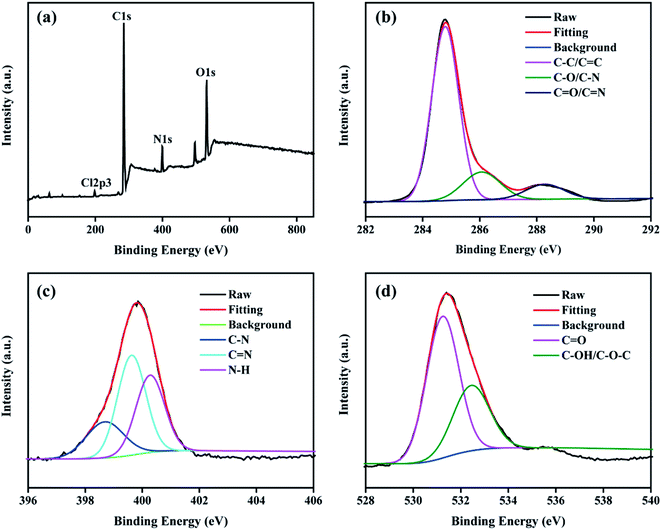 | ||
| Fig. 2 (a) XPS survey spectra of NCDs-LM. (b–d) The high resolution XPS spectra of C1s, N1s and O1s, respectively. | ||
3.2. Optical properties of NCDs-LM
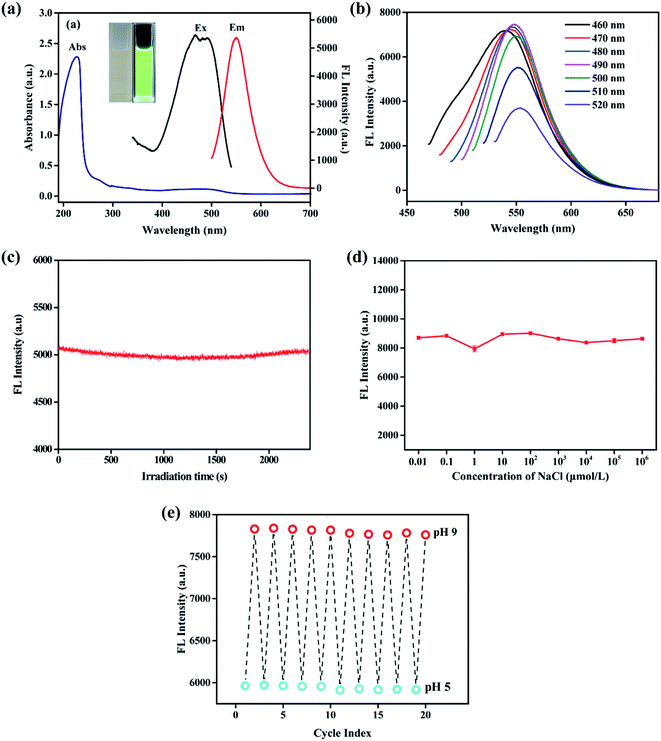
The UV-vis and FL spectra were measured to further explore the optical properties of NCDs-LM. From Fig. 3a, NCDs-LM (200 μg mL−1) solution shows a strong UV-vis absorption peak at 227 nm, attributed to the π–π* transition of the C![[double bond, length as m-dash]](https://www.rsc.org/images/entities/char_e001.gif) C bond. A strong FL emission centered at 550 nm was observed when the λex is 490 nm. And, there is a weak UV-vis absorption peak in the same position that the excitation spectrum. As seen in the inset of Fig. 3a, the resultant NCDs-LM exhibit a transparent brown color under natural light and emit bright green-yellow FL under 365 nm UV lamp. The FL emission spectra of the NCDs-LM (100 μg mL−1) were then measured under different excitation wavelengths (Fig. 3b). With the excitation wavelength increasing from 460 nm to 520 nm, the FL emission peak is red-shifted. And the FL intensity increases first and decreases afterward, and reaches the maximum at the excitation wavelength of 490 nm. The excitation-dependent FL emission and intensity behaviors of the as-prepared NCDs-LM may be related to different emissive sites on the surfaces or the sizes of the NCDs-LM.
C bond. A strong FL emission centered at 550 nm was observed when the λex is 490 nm. And, there is a weak UV-vis absorption peak in the same position that the excitation spectrum. As seen in the inset of Fig. 3a, the resultant NCDs-LM exhibit a transparent brown color under natural light and emit bright green-yellow FL under 365 nm UV lamp. The FL emission spectra of the NCDs-LM (100 μg mL−1) were then measured under different excitation wavelengths (Fig. 3b). With the excitation wavelength increasing from 460 nm to 520 nm, the FL emission peak is red-shifted. And the FL intensity increases first and decreases afterward, and reaches the maximum at the excitation wavelength of 490 nm. The excitation-dependent FL emission and intensity behaviors of the as-prepared NCDs-LM may be related to different emissive sites on the surfaces or the sizes of the NCDs-LM.
3.3. Stability study of NCDs-LM
The effects of irradiation time, ionic strength, and pH on NCDs-LM were evaluated. As described in Fig. 3c, the FL intensity shows negligible changes even after irradiation for over 40 min, suggesting excellent antiphotobleaching property of NCDs-LM. Moreover, the FL intensity only slightly changes even NaCl concentration is up to 1 mol L−1, indicating the high photostability of the NCDs-LM (Fig. 3d). Furthermore, to test the pH reversibility, the pH of NCDs-LM suspension was alternatively changed between 5 to 9 for 10 cycles. Reversible FL response curves of NCDs-LM were shown in Fig. 3e, and the NCDs-LM displayed excellent pH sensitivity and reversibility. All the results prove the feasibility of applying NCDs-LM as I− and pH sensors.3.4. FL sensor for detecting I−
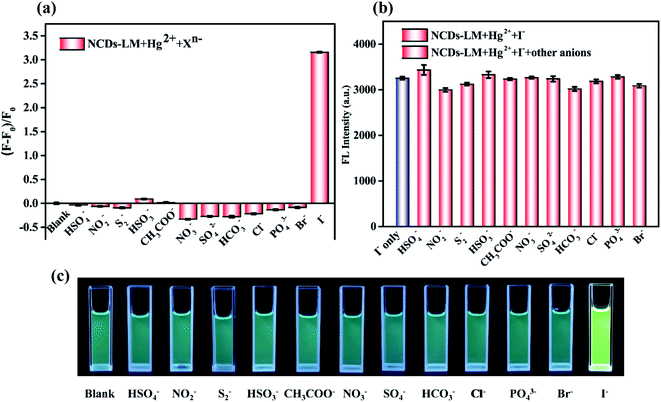
We further explore that the NCDs-LM-Hg2+ complex can be employed to probe I− selectively. As displayed in Fig. S1a,† Hg2+ (8 μmol L−1) can coordinate with NCDs-LM to form NCDs-LM-Hg2+ complex, causing the FL of NCDs-LM to be quenched. Since I− has a high affinity with Hg2+ and it can remove Hg2+ from the surface of NCDs-LM, the FL intensity of the NCDs-LM is significantly recovered to about 55%, upon addition of I− (50 μmol L−1) to the NCDs-LM-Hg2+ complex solution. Moreover, the quenching and recovery process is stable and maintained for more than 600 s (Fig. S1b†).To evaluate the selectivity of the NCDs-LM-based sensor towards I−, responses of diverse potential interference substances at the concentration of 20 μmol L−1 were investigated. As seen in Fig. 4a, I− can significantly recover the FL of the NCDs-LM-Hg2+ system. By contrast, the interferents only have a slight influence on FL recovery, which indicates that this FL sensor has good selectivity to determine I−. In the interference experiment, 20 μmol L−1 of I− alone (red bars, Fig. 4b) and the mixtures of 20 μmol L−1 of I− and 20 μmol L−1 the interference ions mentioned above (blue bars, Fig. 4b) were added into the NCDs-LM-Hg2+ solution, and respectively, then the recovery effects were evaluated. The results revealed that the influences of other coexisting ions were negligible. As depicted in Fig. 4c, under a 365 nm ultraviolet lamp, the fluorescent probe displayed an evident color change from light blue to green-yellow by adding I− to the sensing system. In contrast, the interference ions had no such phenomenon. These results confirmed that the developed FL sensor had excellent selectivity toward I− in the mixtures.
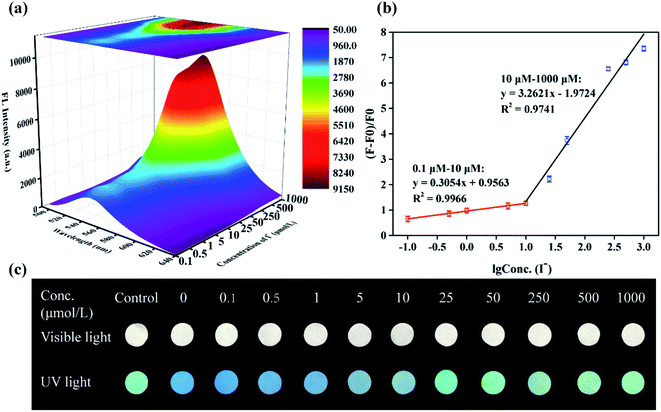
To gain more insight into the sensitivity of NCDs-LM-based sensors toward I−, an FL titration was carried out. As shown in Fig. 5a, the FL intensity gradually increases upon the incremental addition of I− into the NCDs-LM-Hg2+ mixture. The FL efficiency versus I− concentration gives a linear plot with a broad concentration in the range of 0.1 to 1000 μmol L−1. The fitted linear equations are y = 0.3054x + 0.9563 (R2 = 0.9966) at 0.1–10 μmol L−1 I−, and y = 3.2621x −1.9724 (R2 = 0.9741) at 10–1000 μmol L−1 I−, where x is log![[thin space (1/6-em)]](https://www.rsc.org/images/entities/char_2009.gif) 10 of I− concentration and y is the FL efficiency (F0–F)/F0 (Fig. 5b). Moreover, the low limit of detection (LOD) was calculated based on 3σ/slope (where σ is the standard deviation), suggesting that NCDs-LM-based sensor shows high sensitivity with a low LOD of 20 nmol L−1.
10 of I− concentration and y is the FL efficiency (F0–F)/F0 (Fig. 5b). Moreover, the low limit of detection (LOD) was calculated based on 3σ/slope (where σ is the standard deviation), suggesting that NCDs-LM-based sensor shows high sensitivity with a low LOD of 20 nmol L−1.
Further, an FL test paper based on NCDs-LM was used for the semi-quantitative and visual detection of I−. After 100 μL of the mixed solution containing the NCDs-LM-Hg2+ solution and different concentrations of I− (from 0.1 μmol L−1 to 1000 μmol L−1) are separately dropped onto the test paper, the variations of FL brightness and color can be observed under natural light and UV lamp by the naked eye. As displayed in Fig. 5c, with the increasing of I− concentration, the color of the test paper changed from light blue to bright green gradually upon exposure to UV light of 365 nm. These results demonstrate the feasibility of the semi-quantitative visualization of I− based on NCDs-LM FL sensor. Compared with previously reported methods (Table S1†), the developed FL sensor displayed comparable or better analytical performance. Moreover, it is relatively simple and cost-effective. Notably, with the NCDs-LM-based test paper, it is easy to semi-quantitatively detect I− concentrations using the naked eye.
3.5. Possible mechanism for detecting I−
Similar to the literature previously reported,31,44 the UV-vis spectral analysis showed that the UV-vis spectra had no significant change when Hg2+ (8 μmol L−1) were added into the NCDs-LM aqueous solutions (Fig. S2a†). The intensity and position of the absorbance bands centered at 227 nm did not change nearly. Besides, the fluorescence decay experiments showed that the fluorescence life time of the NCDs-LM decreased obviously in the process of fluorescence quenching with Hg2+ (from 7.63 ns to 6.02 ns). When I− (50 μmol L−1) was added into the NCDs-LM-Hg2+ system, the value of lifetime gradually increased to 7.04 ns (Fig. S2b†). Thus, we deduced that Hg2+ ions can be effectively carried off from the surface of the N-CQDs by I−, and then the fluorescence of the NCDs-LM was retrieved. These results indicated that the fluorescence quenching belonged to dynamic quenching process, and electron transfer process between the excited states of the NCDs-LM with Hg2+ ions may be the main reason for fluorescence quenching.45,463.6. Application in drinking water and milk samples
To demonstrate the practicability of the developed FL sensor, we further analyzed I− concentration in drinking water and milk samples after pretreatment. As listed in Table 1, the recovery range of drinking water and milk samples spiked with I− to varying concentrations was 90.9–115.5% with RSDs of 1.3–4.7%, implying that the developed sensor had good accuracy and precision. The obtained result in drinking water samples (48.60 μmol L−1, 543.85 μmol L−1) was in accordance with those obtained (56.50 μmol L−1, 428.2 μmol L−1) using ion chromatography, suggesting that the proposed sensor had good reliability. Furthermore, six different brands of water and milk samples were not detectable by the FL sensor, suggesting that the I− concentrations of these samples were below the LOD of the proposed method (20 nmol L−1). Notably, the color changes caused by I− from 5–500 μmol L−1 could be clearly visualized on the test paper and well distinguished by the naked eye. All the analyses confirm that the proposed method is promising for I− detection in environmental and food analysis.3.7. Fluorescent sensor for detecting pH
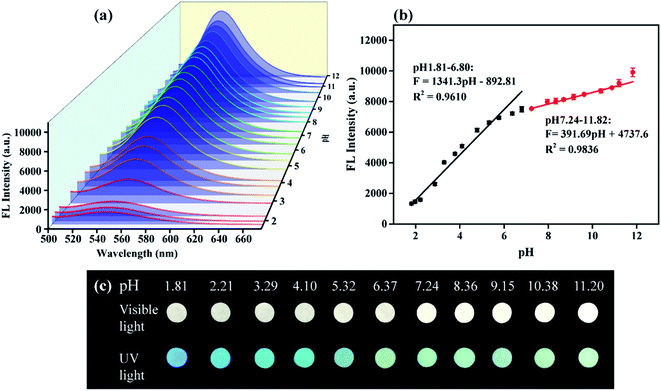
As we all know, CDs are sensitive to pH. In fact, the research reported that the sensitivity of CDs to pH depended on the functional groups on their surface.47 And, NCDs-LM is expected to have the same pH-sensing properties as CDs. Here, the influence of pH on the synthesized NCDs-LM in the pH range of 1.81–11.82 was studied. The FL intensity successively increased with pH increasing from 1.81 to 11.82 (Fig. 6a). As shown in Fig. 6b, good linearity was obtained between FL intensity and pH range (1.81–6.80 and 7.24–11.82) with the correlation coefficient R2 = 0.9610 and R2 = 0.9836. Moreover, under natural light and UV lamp, the FL images of NCDs-LM at various pH values on the test paper displayed photoluminescence color changes from dark blue to bright yellow-green (Fig. 6c), which could be readily distinguished by the naked eye. The results suggest that NCDs-LM can be used as sensitive pH sensors.3.8. Possible mechanism for detecting pH
Based on the previous reports, H+ can quench the FL of CDs by changing the surface state of CDs.30,48 Here, for better understanding of the unique pH-dependent phenomenon of NCDs-LM, the FL decay curves and UV-vis absorption spectra at various pH values were examined. Fig. 7a and Table S2† depicted the data of the fitted luminescence decays of NCDs-LM at various pH values. It was observed that the fluorescence lifetime (τ) of NCDs-LM increased from 5.1 ns to 7.68 ns with the increase of pH (1.81–11.82), suggesting that the fluorescence quenching may be dynamic. Further, it was clearly seen that on increasing the pH from 1.81 to 11.82, there were no significant changes in the absorption spectra of the NCDs-LM, demonstrating no ground-state complex formation (Fig. 7b). This result confirmed that the H+ quenches the FL of the NCDs-LM through a dynamic quenching process.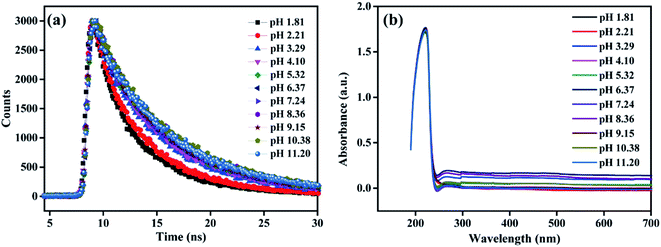 | ||
| Fig. 7 (a) Fluorescence decay curves of NCDs-LM at various pH values (λex = 490 nm, λem = 550 nm). (b) UV-vis absorption spectra of NCDs-LM (100 μg mL−1) at various pH values. | ||
3.9. Application in drinking water and fruit samples
To validate the proposed sensing strategy and confirm its feasibility application for pH sensing in environmental and food samples, different drinking water and fruit samples were performed by the proposed sensor. As shown in Table 2, the results were found in good agreement with the results measured from the pH meter, proving the practicability of the FL sensor for pH values in drinking water and fruits. Additionally, the color signal caused by drinking water and fruit samples could be well observed on the test paper by the naked eye. Compared with other pH sensors, our reported NCDs-LM-based pH sensor is relatively simple, cost-effective, and could realize visualization in a wide pH range, indicating its prospects as a portable analytical tool for environmental monitoring and food analysis (Table S3†).4. Conclusion
In summary, a fluorescent platform based on NCDs-LM was established for selective and visual sensing of I− and pH. The fluorescent NCDs-LM were successfully synthesized using Listeria monocytogenes as the carbon source via a one-step solvothermal method. The NCDs-LM-based fluorescent sensor can selectively detect I− with the LOD of 20 nmol L−1. Furthermore, the present sensor can sensitively sense pH, providing a wide linear range from 1.81 to 11.82. An NCDs-LM-based test paper was further fabricated for visual and semi-quantitative detection of I− and pH, indicating its great potential applications for on-site sensing of I− and pH. In addition, the present sensor exhibited highly selective sensing capability for I− and pH in real samples. Compared with those of previously reported methods, the NCDs-LM-based fluorescent sensor had the advantages of rapidness, good stability, and good anti-interference performance. This work unlocks vast possibilities for sensing trace I− and wide-range pH in various fields, especially for environmental and food analysis.Author contributions
Mingsha Jie: Methodology, Investigation, Funding acquisition, Writing-original draft. Ruipeng Guo: Conceptualization, Resources, Software, Writing-review & editing. Yanan Zhang: Data curation, Validation, Formal analysis. Jianing Huang: Investigation, Validation, Formal analysis. Gaigai Xu: Resources, Formal analysis. Min Li: Data curation, Formal analysis. Xiaoyue Yue: Data curation, Formal analysis. Baocheng Ji: Data curation, Formal analysis. Yanhong Bai: Methodology, Supervision, Funding acquisition.Conflicts of interest
There are no conflicts to declare.Acknowledgements
The authors acknowledge financial support from the Key Scientific and Technological Project of Henan Province (No. 202102110140, 212102310493), the National Natural Science Foundation of China (No. 31801630, 31901767), and the Major Special Project on Public Welfare of Henan Province (No. 201300110100).References
- Z. Chen, R. Sun, S. Feng, D. Wang and H. Liu, ACS Appl. Mater. Interfaces, 2020, 12(9), 11104–11114 CrossRef CAS PubMed.
- X. Huang, Z. Lu, Z. Wang, C. Fan, W. Fan, X. Shi, H. Zhang and M. Pei, Dyes Pigm., 2016, 128, 33–40 CrossRef CAS.
- M. Maruthupandi, M. Chandhru, S. Rani and N. Vasimalai, ACS Omega, 2019, 4(7), 11372–11379 CrossRef CAS PubMed.
- H. Cunha-Silva and M. Arcos-Martinez, Talanta, 2019, 199, 262–269 CrossRef CAS PubMed.
- World Health Organization, WHO/UNICEF/ICCIDD, WHO Publication, 2007, pp. 1–108 Search PubMed.
- Y. Shen, P. Hsu, B. Unnikrishnan, Y. Li and C. Huang, ACS Appl. Mater. Interfaces, 2014, 6(4), 2576–2582 CrossRef CAS PubMed.
- A. Moreda-Pineiro, V. Romaris-Hortas and P. Bermejo-Barrera, J. Anal. At. Spectrom., 2011, 26, 2107–2152 RSC.
- M. Haldimann, A. Blanc and K. Blondeau, J. Food Compos. Anal., 2005, 18(6), 461–471 CrossRef CAS.
- W. Zhang, A. Mnatsakanov, R. Hower, H. Cantor and Y. Wang, Front. Biosci.-Landmark, 2005, 10(1), 88–93 CrossRef CAS PubMed.
- J. Melichercik, L. Szijarto and A. Hill, J. Dairy Sci., 2006, 89(3), 934–937 CrossRef CAS PubMed.
- M. Tatarczak-Michalewska, J. Flieger, J. Kawka, W. Flieger and E. Blicharska, Molecules, 2019, 24(7), 1243–1256 CrossRef PubMed.
- U.-J. Kim and K. Kannan, Anal. Chem., 2018, 90(5), 3291–3298 CrossRef CAS PubMed.
- A. Macedo, K. Teo, A. Mente, M. Mcqueen, J. Zeidler, P. Poirier, S. Lear, A. Wielgosz and P. Britz-Mckibbin, Anal. Chem., 2014, 86(20), 10010–10015 CrossRef CAS PubMed.
- T. Cataldi, A. Rubino and R. Ciriello, Anal. Bioanal. Chem., 2005, 382(1), 134–141 CrossRef CAS PubMed.
- V. Khunseeraksa, S. Kongkaew, P. Thavarungkul, P. Kanatharana and W. Limbut, Microchim. Acta, 2020, 187(11), 591–601 CrossRef CAS PubMed.
- Y. Li and S. Han, Microchem. J., 2020, 154, 104638–104644 CrossRef CAS.
- S. Han, B. Liu, Z. Fan, L. Zhang and F. Jiang, Luminescence, 2017, 32(7), 1192–1196 CrossRef CAS PubMed.
- H. Su, L. Hao, W. Hussain, Z. Li and H. Li, CrystEngComm, 2020, 22, 2103–2109 RSC.
- X. Yue, Z. Zhou, M. Li, M. Jie, B. Xu and Y. Bai, Food Chem., 2022, 367, 130763–130770 CrossRef CAS PubMed.
- X. Yue, Y. Li, S. Xu, J. Li, M. Li, L. Jiang, M. Jie and Y. Bai, Food Chem., 2022, 371, 131164–131172 CrossRef CAS PubMed.
- L. Zhou, C. Cheng, X. Li, J. Ding and B. Su, Anal. Chem., 2020, 92(5), 3844–3851 CrossRef CAS PubMed.
- L. Dong, H. Xu, D. Li and Y. Wang, Talanta, 2017, 166, 54–62 CrossRef PubMed.
- M. Shamsipure, A. Barati and Z. Nematifar, J. Photochem. Photobiol., C, 2019, 39, 76–141 CrossRef.
- R. Tang, H. Lee and S. Achilefu, J. Am. Chem. Soc., 2012, 134(10), 4545–4548 CrossRef CAS PubMed.
- A. Orte, J. Alvarez-Pez and M. Ruedas-Rama, ACS Nano, 2013, 7(7), 6387–6395 CrossRef CAS PubMed.
- E. Evangelio, J. Hernando, I. Imaz, A. Ramón, B. Félix and R. Daniel, Chem. - Eur. J., 2008, 14(31), 9754–9763 CrossRef CAS PubMed.
- P. Chen, X. Xu, J. Ji, J. Wu, T. Lu, Y. Xia, L. Wang, J. Fan, Y. Jin, L. Zhang and S. Du, Anal. Chim. Acta, 2020, 1138, 99–107 CrossRef CAS PubMed.
- X. Yue, Z. Zhou, Y. Wu, M. Jie, Y. Li, H. Guo and Y. Bai, New J. Chem., 2020, 44, 8503–8511 RSC.
- F. Du, F. Zeng, Y. Ming and S. Wu, Microchim. Acta, 2013, 180(5), 453–460 CrossRef CAS.
- J. Zhao, Q. Luo, Q. Ruan, K. Chen, C. Liu, C. Redshaw and Z. Jin, Chem. Mater., 2021, 33(15), 6091–6098 CrossRef CAS.
- J. He, H. Zhang, J. Zou, Y. Liu, J. Zhuang, Y. Xiao and B. Lei, Biosens. Bioelectron., 2016, 79, 531–535 CrossRef CAS PubMed.
- W. Shi, X. Li and H. Ma, Angew. Chem., Int. Ed., 2012, 51(26), 6432–6435 CrossRef CAS PubMed.
- R. Atchudan, J. Nesakumar, S. Perumal and Y. Lee, ACS Omega, 2018, 3(12), 17590–17601 CrossRef CAS.
- F. Shan, H. Xia, X. Xie, L. Fu, H. Yang, Q. Zhou, Y. Zhang, Z. Wang and X. Yu, Microchem. J., 2021, 167, 106273–106282 CrossRef CAS.
- H. Zhang, Y. Li, X. Liu, P. Liu, Y. Wang, T. An, H. Yang, D. Jing and H. Zhao, Environ. Sci. Technol. Lett., 2014, 1(1), 87–91 CrossRef CAS.
- X. Pang, L. Li, P. Wang, Y. Zhang, W. Dong and Q. Mei, Microchem. J., 2021, 168, 106400–106406 CrossRef CAS.
- N.-M. Christopoulou, D. Kalogiannia and T. Christopoulos, Microchem. J., 2021, 161, 105787–105794 CrossRef CAS.
- S. Zhang, D. Zhang, Y. Ding, J. Hua and B. Li, Analyst, 2019, 144(18), 5497–5503 RSC.
- X. Hua, Y. Bao, H. Wang, Z. Chen and F. Wu, Nanoscale, 2017, 9(6), 2150–2161 RSC.
- K. Qin, D. Zhang, Y. Ding, X. Zheng, Y. Xiang, J. Hua, Q. Zhang, X. Ji, B. Li and Y. Wei, Analyst, 2020, 145(1), 177–183 RSC.
- X. Peng, C. Li, Y. Zhang, S. Chen and Y. Long, Luminescence, 2019, 34(3), 1–6 CrossRef PubMed.
- X. Yuan, Y. Tu, W. Chen, Z. Xu, Y. Wei, K. Qin, Q. Zhang, Y. Xiang, H. Zhang and X. Ji, Dyes Pigm., 2020, 175, 108187–108196 CrossRef CAS.
- D. Zhao, X. Liu, R. Zhang, X. Huang and X. Xiao, New J. Chem., 2021, 45(8), 1010–1019 RSC.
- H. Huang, Y. Weng, L. Zheng, B. Yao, W. Weng and X. Lin, J. Colloid Interface Sci., 2017, 506, 373–378 CrossRef CAS PubMed.
- S. Lu, Z. Li, X. Fu, Z. Xie and M. Zheng, Dyes Pigm., 2021, 187, 109126–109132 CrossRef CAS.
- L. Li, X. Jiao, Y. Zhang, C. Cheng, K. Huang and L. Xu, Sens. Actuators, B, 2018, 268, 84–92 CrossRef CAS.
- S. Pedro, A. Salinas-Castillo, M. Ariza-Avidad, A. Lapresta-Fernández, C. Sánchez-González, C. Martínez-Cisneros, M. Puyol, L. Capitan-Vallvey and J. Alonso-Chamarro, Nanoscale, 2014, 6(11), 6018–6024 RSC.
- Z. Song, F. Quan, Y. Xu, M. Liu, L. Cui and J. Liu, Carbon, 2016, 104, 169–178 CrossRef CAS.
Footnote |
| † Electronic supplementary information (ESI) available. See DOI: 10.1039/d2ra00826b |
| This journal is © The Royal Society of Chemistry 2022 |

