 Open Access Article
A portable visual coffee ring based on carbon dot sensitized lanthanide complex coordination to detect bisphenol A in water†
Yixiao Li,
Qi Min,
Yunfei Wang,
Xuming Zhuang *,
Xiaowen Hao,
Chunyuan Tian,
Xiuli Fu and
Feng Luan*
College of Chemistry and Chemical Engineering, Yantai University, Yantai, China. E-mail: xmzhuang@iccas.ac.cn; fluan@sina.com
First published on 4th March 2022
Abstract
In this work, a ratiometric fluorescence sensor along with a portable coffee ring visualized detection method for bisphenol A (BPA) was developed based on carbon dots. The probe was formed by the coordination polymerization of Eu3+ and 5′-adenosine monophosphate on the surface of carbon dots containing a large number of hydroxyl and carbonyl groups. The results showed that the fluorescence intensity ratio and the concentration of BPA had a good linear relationship in a wide range of 0.1–100 μM with a detection limit of 20 nM (S/N = 3). The recoveries of the added standard BPA in water samples ranged from 91.80 to 102.7% with relative standard deviation values no more than 1.84% (n = 3). In addition, the changes of the fluorescence color of the CDs@Eu–AMP suspension with different BPA concentrations can be easily visualized under a UV lamp by the naked eye, which highlights the great potential of the coffee ring detection method for the fast and convenient monitoring of BPA in real water samples.
1. Introduction
Bisphenol A (BPA) has been used for about 130 years since it was synthesized by Russian chemists in 1891.1 However, despite its wide application, BPA (Scheme 1) has gained much attention because of its toxicity to humans, animals and the environment. On one hand, BPA is an important precursor to plastics (polycarbonates, epoxy resins, polysulfones and niche materials), and has been found in various consumer products, such as plastic water bottles, children's suction cups, and inner coatings for food and beverage cans.2 In 2015, about 4 million tons of BPA-derived chemicals were produced worldwide.3 On the other hand, due to its potential risks to human health and the environment, BPA has been listed as a substance of very high concern by many governments and organizations worldwide, the first step in the procedure for restriction of its use, which was based on the concerns about BPA's toxicity for human reproduction.4 For example, in 2012, the Food and Drug Administration (FDA) banned the use of BPA in baby bottles and Sippy cups in the United States due to its neuro-toxic and reproductive effects.5 In 2017, the European Chemicals Agency also concluded that BPA should be listed as a substance of very high concern due to its endocrine disrupting effects.6BPA can be released into the environment by both pre-consumer and post-consumer leaching. The common pre-consumer leaching is directly from plastics, coat and staining manufacturers. The post-consumer leaching is from municipal wastewater treatment plants, agricultural irrigation pipes, plastic trash, indirect leaching from plastic, paper, and metal waste in landfills, and paper or material recycling companies.7–9 BPA can enter the aquatic environment in many ways. Direct discharge of low-concentration BPA in the production has been proved to be the main source of BPA in the aquatic environment.10 BPA can be accumulated in aquatic organisms through the food chain, ultimately affecting human health.11 Therefore, it is important to develop an easy and sensitive method for rapid naked-eye detection of BPA in water.
There are many traditional methods for BPA detection, such as gas chromatography,12 gas chromatography-mass spectrometry, liquid chromatography-mass spectrometry,13 high-performance liquid chromatography,14 and fluorescence analysis.15 Many analytical methods for the detection of BPA are seriously restricted because of their tedious operation or high cost of instruments. It is necessary to develop a fast, convenient, sensitive method for BPA detection. Among these methods, fluorescence analysis methods for BPA detection have received extensive attention due to their simple operation, high sensitivity, real-time measurement and low cost.16 However, there are still some problems with these methods. For example, fluorescence sensors are easily affected by external factors, such as probe concentration and excitation intensity,17 unobvious color change which is difficult to be observed with the naked eye,18 etc. These problems might be caused by the single emission spectrum of a fluorophore.19 Thus, a dual-emission radiometric fluorescent sensor has been considered as a better choice.20 This kind of fluorescent sensors is usually composed of dual-emitting fluorophores, which are used as reference units or response parts.21 To solve the problem of weak fluorescent signals, new materials such as nanocomposites can be introduced to the sensors.
In the past few years, nanocomposites have been increasingly developed and used in biosensors and color based assays.22–34 For example, nanocomposites have been utilized to detect toxic inorganic ions.35–44 Different from traditional colorimetric methods, the nanocomposites -based colorimetric sensor is based on catalytic reaction, which can amplify the fluorescent signals to increase sensitivity for the detection of low-level targets.45 For example, the nanocomposites prepared by the coordination polymerization of Eu3+ and 5′-adenosine monophosphate (Eu–AMP) has been used in a visual ratiometric probe for the determination of OTC.46 AMP (Scheme 1) consists of a molecule of adenine, a molecule of adenosine, a molecule of ribose, and a molecule of phosphoric acid. It is formed in the body after the release of energy from adenosine diphosphate (ADP) and adenosine triphosphate (ATP). It can continue to bind phosphate groups to form ATP and ADP. It's an incomplete hydrolysis of ATP.47 However, some shortcomings, such as low response signal strength and slow reaction time, need to be improved.
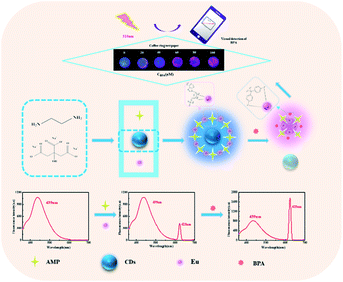
As one of the most popular new luminescent materials, carbon dots (CDs) possess many advantages, such as high dispersity, excellent light stability, low toxicity, high stability, and size-adjustable emission spectrum.48 It can make up for the low response strength and slow reaction time of pure infinite coordination polymer. Therefore, in this work, CDs were used to sensitize Eu–AMP. As shown in Scheme 2, a ratiometric fluorescent probe based on CDs wrapped Eu–AMP with nanocomposites (CDs@Eu–AMP) was developed to rapidly detect BPA in environmental water. Furthermore, a coffee ring on the slow filter paper was also developed to achieve the visual and rapid detection of BPA by naked eyes.
2. Experimental section
2.1 Materials and reagents
All chemicals used in this study were purchased from Aladdin Reagent Co., Ltd. (Shanghai, China), including europium nitrate (Eu(NO3)3·6H2O, 99.99%), AMP, BPA, sodium citrate, ethylenediamine, tris(hydroxymethyl)aminomethane (Tris), ascorbic acid (AA), glucose, uric acid (UA), resorcinol (RC), hydroquinone (HQ) and phenol. All of them were analytical grade and used without further purification. Distilled water was obtained from a Millipore water purification system (18 MΩ, Milli-Q, Millipore).2.2 Instruments
The morphologies of CDs and CDs@Eu–AMP nanomaterials were characterized by Transmission Electron Microscopy (TEM, JEM-2100, Japan) and Scanning Electron Microscopy (SEM, Su8220 Hitachi, Japan). The spectroscopic characteristics were obtained by UV-visible absorption spectroscopy (PerkinElmer, U.K.) and Fourier Transform Infrared (FT-IR) spectroscopy (Nicolet, USA). The X-ray diffraction (XRD) spectrum was performed with AXS-D8 X-ray diffraction (Bruker, Germany). The elemental composition of prepared samples was characterized by X-ray photoelectron spectroscopy (XPS, ESCALAB 250xi). Fluorescent measurements were carried out on an F-4700 fluorescence spectrometer (Hitachi, Japan). The centrifugal process was used by Xiangyi H1650 table top highspeed centrifuge (maximum centrifugal acceleration 18![[thin space (1/6-em)]](https://www.rsc.org/images/entities/char_2009.gif) 930×g). The photographs were taken with a smartphone under a 310 nm UV lamp.
930×g). The photographs were taken with a smartphone under a 310 nm UV lamp.
2.3 Preparation of CDs, Eu–AMP and CDs@Eu–AMP nanocomposites
In the present study, CDs were synthesized using the one-step hydrothermal method according to a reported method with minor modifications.49 Briefly, 25 mL of sodium citrate solution (0.1 M) and 300 μL of ethylenediamine were mixed in a 50 mL Teflon-lined stainless steel autoclave and kept at 180 °C for 6 h. Then, crude carbon dot products were filtered through a cylinder membrane filter (0.22 μM). Finally, the filtered CDs solution was rotated to a solid and then grounded into powder for use.Eu–AMP nanocomposites were synthesized according to the method reported elsewhere.50 Briefly, 5 mL of Eu(NO3)3·6H2O (10 mM) aqueous solution was added into 5 mL of Tris buffer solution (0.1 M, pH 7.4) containing AMP (10 mM), mixed and reacted for 1 h at room temperature with vigorous stirring. Then, the white precipitates were centrifuged at a speed of 8000 rpm for 5 min and washed with ultrapure water several times, and dried at room temperature for later use.
To prepare CDs@Eu–AMP nanocomposites, 4.0 mL of 10 mM AMP stock solution, 4.0 mL Eu(NO3)3·6H2O solution (10 mM) and 500 μL CDs solution (0.4 g L−1) were mixed and reacted under magnetic stirring for 24 h at room temperature. Then the precipitates were centrifuged at a speed of 8000 rpm for 8 min and washed with ultrapure water several times. Finally, the solid products were dried under vacuum at 60 °C for 6 h.46 The CDs@Eu–AMP suspension was prepared by dissolving 6.0 mg of CDs@Eu–AMP powder into 3.0 mL of ultrapure water and sonicated for 10 min.51
2.4 Preparation of coffee ring paper ratiometric fluorescent probe
The coffee ring detection tool was prepared as follows. A filter paper was cut into several circular paper with a diameter of 3 mm using a punch tool. The circular filter papers were soaked in the CDs@Eu–AMP nanocomposites suspension for 20 min. Then, they were taken out and dried at room temperature. The paper rings with CDs and Eu–AMP were prepared by the same method.In the following steps, 5 μL of different concentrations of BPA (0, 20, 40, 60, 80 and 100 μM) were dropped onto the circular filter papers. After 3 min, the color changes of the impregnation were observed under ultraviolet light. The fluorescent color of the paper strips and the coffee ring deposition patterns were recorded by a smartphone with an image analysis application. Then, these data were transmitted to a computer and analyzed using a professional image analysis software.
2.5 Detection of BPA in environmental water samples
The environmental water samples were collected from the river, lake and tap water. All water samples were filtered with a 0.22 μM filter membrane 3 times to remove impurities. The contents of BPA in real water samples were determined using the standard addition method. Briefly, the standard BPA solutions (0.5, 5.0, 10.0, 50.0 μM) were added to the real water samples. At last, the fluorescence signal intensity of the water samples was detected at the excitation wavelength of 310 nm by fluorescence spectrophotometer. To evaluate visual detection, another 5 μL of BPA solutions with different concentrations listed above were added onto the pre-prepared filter paper to observe its immersion. Both of the tests were repeated three times.3. Results and discussion
3.1 Characterization of CDs, Eu–AMP and CDs@Eu–AMP nanocomposites
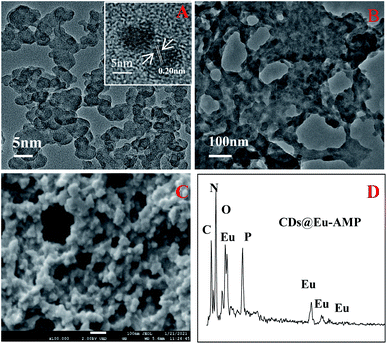
The structures of CDs, Eu–AMP and CDs@Eu–AMP nanocomposites were characterized in the present study. The TEM images of CDs showed that the average particle size of CDs was about 4 nm. The HRTEM image (inset of Fig. 1A) showed that the lattice spacing of CDs was 0.20 nm, which is consistent with that of graphene carbon (100 facet).52 In addition, the particle size distribution of CDs was also shown in Fig. S1.† The TEM images of CDs@Eu–AMP showed that CDs@Eu–AMP nanocomposites were reticular complex structure (Fig. 1B), with the same size and shape as that of the Eu–AMP hosts (Fig. S2†). The SEM images revealed that CDs@Eu–AMP formed a 3D nanoparticle network structure (Fig. 1C), which provided a larger specific surface area and thus larger adsorption capability. The morphological characterizations demonstrated that CDs@Eu–AMP was successfully synthesized and could be used for the detection of BPA. The EDS spectra revealed the presence of C, N, O, P and Eu elements in the CDs@Eu–AMP nanocomposites (Fig. 1D). As can be seen from the figure, Eu elements were distributed in the nanocomposites, which further confirmed the successful synthesis of CDs@Eu–AMP.The XRD pattern showed that the CDs@Eu–AMP nanocomposites were amorphous (Fig. 2A), which is consistent with the peak shape of the material reported previously.46 This result also showed the successful synthesis of CDs@Eu–AMP. The FTIR spectra of CDs, CDs@Eu–AMP and CDs@Eu–AMP-BPA were shown in Fig. 2B. The FTIR spectra of Eu–AMP was shown in Fig. S3.† In the spectrum of CDs, there were three characteristic peaks at 3408, 1734 and 1639 cm−1, which were attributed to the stretching vibration of OH, C![[double bond, length as m-dash]](https://www.rsc.org/images/entities/char_e001.gif) O, and C
O, and C![[double bond, length as m-dash]](https://www.rsc.org/images/entities/char_e001.gif) C, respectively.46 Compared with the FTIR spectrum of CDs, the peak of C
C, respectively.46 Compared with the FTIR spectrum of CDs, the peak of C![[double bond, length as m-dash]](https://www.rsc.org/images/entities/char_e001.gif) O of CDs@Eu–AMP shifted from 1734 to 1705 cm−1, indicating that Eu–AMP were combined with CDs through C
O of CDs@Eu–AMP shifted from 1734 to 1705 cm−1, indicating that Eu–AMP were combined with CDs through C![[double bond, length as m-dash]](https://www.rsc.org/images/entities/char_e001.gif) O groups. The vibration peaks of P–O and C–N of AMP appeared at 1063 and 1369 cm−1, respectively. The changes above suggest that Eu3+ had been coordinated with AMP, and the CDs@Eu–AMP nanocomposites had been successfully synthesized.50 The infrared spectra of CDs@Eu–AMP-BPA showed two strong peaks at 1580 cm−1 and 3404 cm−1, respectively, and there was no C
O groups. The vibration peaks of P–O and C–N of AMP appeared at 1063 and 1369 cm−1, respectively. The changes above suggest that Eu3+ had been coordinated with AMP, and the CDs@Eu–AMP nanocomposites had been successfully synthesized.50 The infrared spectra of CDs@Eu–AMP-BPA showed two strong peaks at 1580 cm−1 and 3404 cm−1, respectively, and there was no C![[double bond, length as m-dash]](https://www.rsc.org/images/entities/char_e001.gif) O peak at 1705 cm−1, which might overlap with the peak at 1580 cm−1, indicating that hydrogen bonds were formed between CDs and OH groups of BPA. The formation of hydrogen bonds causes the shift of the C
O peak at 1705 cm−1, which might overlap with the peak at 1580 cm−1, indicating that hydrogen bonds were formed between CDs and OH groups of BPA. The formation of hydrogen bonds causes the shift of the C![[double bond, length as m-dash]](https://www.rsc.org/images/entities/char_e001.gif) O adsorption band from high to low frequencies.50
O adsorption band from high to low frequencies.50
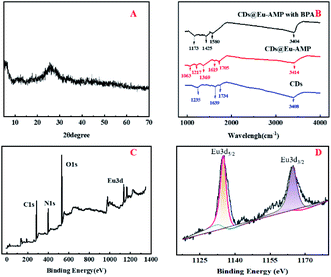 | ||
| Fig. 2 (A) XRD spectra of CDs@Eu–AMP from this work; (B) FTIR spectra of CDs, CDs@Eu–AMP and CDs@Eu–AMP with BPA; (C)XPS spectra of CDs@Eu–AMP; (D) XPS spectra of Eu from CDs@Eu–AMP. | ||
The XPS spectra of CDs@Eu–AMP showed four peaks at 1164.9, 536.9, 399.4 and 286.55 eV (Fig. 2C), which were attributed to Eu3d, O1s, N1s, and C1s, respectively. The 3D spectra of Eu showed two peaks at 1134.8 and 1163.2 eV (Fig. 2D), which corresponded to the Eu3d5/2 and Eu3d3/2 components of Eu(III) ions, respectively. The results showed that Eu was in a trivalent state and bound to the external oxygen-containing groups of CDs@Eu–AMP.52 The results of X-ray photoelectron spectroscopy (XPS) and EDS were consistent, confirming the successful preparation of CDs@Eu–AMP. We carried out the experimental test of fluorescence decay curve of CDs@Eu–AMP, and the results were shown in Fig. S4.† The average fluorescence lifetime was calculated as 76.22 μs, indicating the optical property improved.
3.2 Optical feasibility properties of CDs and of CDs@Eu–AMP nanocomposites
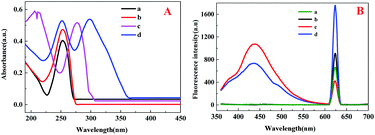
The ultraviolet and fluorescent properties of BPA, CDs, CDs@Eu–AMP and CDs@Eu–AMP with BPA were shown in Fig. 3A. The characteristic peak of CDs appeared at 254 nm. The main UV-vis absorption peaks of BPA appeared at 277 nm, respectively. The characteristic peak of CDs@Eu–AMP appeared at 253 nm. If BPA was adsorbed onto CDs@Eu–AMP, the peak of BPA was red-shifted by about 20 nm from 277 nm to 298 nm, indicating the high-affinity binding between BPA and CDs@Eu–AMP. In addition, two characteristic peaks of CDs@Eu–AMP with BPA exist in 251 nm and 305 nm, respectively.Fluorescence spectra of Eu–AMP, Eu–AMP with BPA, CDs@Eu–AMP and CDs@Eu–AMP with BPA are illustrated in Fig. 3B. The correction lines of Eu–AMP and Eu–AMP with BPA showed that there was only one fluorescence emission peak at 623 nm whether BPA was added or not. However, there were two fluorescence emission peaks in CDs@Eu–AMP and CDs@Eu–AMP with BPA at 439 and 623 nm, respectively. The fluorescence peak at 439 nm was attributed to the encapsulated CDs, and the emission peak at 623 nm was attributed to Eu3+. After adding BPA to CDs@Eu–AMP nanocomposites, the emission peak of CDs at 439 nm decreased, and the emission peak of Eu3+ at 623 nm increased. Upon the addition of 100 μM BPA, the fluorescence intensity of CDs@Eu–AMP at 623 nm was about 2-folds higher than that of Eu3+in Eu–AMP. In contrast, the fluorescence intensity of CDs at 439 nm decreased by almost 50%. The result was possibly after binding CDs to Eu3+ and AMP, CDs is wrapped by Eu3+ and AMP, resulting in enhanced fluorescence intensity, while Eu3+ is wrapped in CDs with weakened fluorescence intensity. After the addition of BPA, BPA strongly binds to Eu3+, which sensitizes Eu and enhances the fluorescence intensity at 623 nm. However, the fluorescence intensity of CDs originally bound to Eu3+ and AMP decreases due to the competition of BPA.46
3.3 Performance of CDs@Eu–AMP ratiometric probe
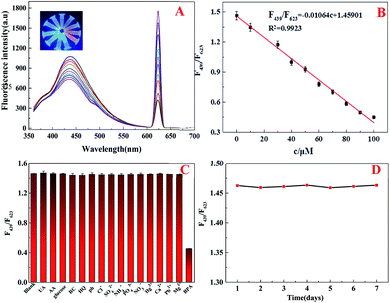
A ratiometric fluorescent probe was developed to detect BPA. Firstly, the sensitivity of the CDs@Eu–AMP ratiometric fluorescence probe was evaluated. As shown in Fig. 4A, the fluorescence intensity of CDs at 439 nm decreased gradually while the intensity at 623 nm increased gradually in the concentration range of 0–100.0 μM. The inset of Fig. 4A showed that the fluorescent color of CDs@Eu–AMP could be clearly observed under UV light, which gradually changed from blue to red with BPA concentrations ranging from 0 to 100.0 μM. The intensity ratio of F439/F623 shows good linear relationship with the BPA concentration (0.1–100 μM) and the linear equation is F439/F623 = −0.01064c + 1.4590. The intensity ratio of F439/F623 had a good correlation coefficient (R2 = 0.9923) and a low limit of detection (LOD) of 20 nM (S/N = 3) (Fig. 4B). Compared to other methods for the determination of BPA (Table S1†), the CDs@Eu–AMP platform prepared in this work is sensitive and acceptable in BPA detection.The selectivity of the probe was also evaluated. Since the real water samples might contain many substances, such as metal ions, inorganic and organic substances, which could affect the measurement ability of the CDs@Eu–AMP ratiometric probe. Therefore, the possible coexisting substances, including UA, AA, glucose, RC, HQ, phenol, and some metal ions, such as Ca2+, Mg2+, K+, and Na+, were used to test the probe's specificity. As shown in Fig. 4C, most of these substances did not significantly change the fluorescence intensity of the probe. However, the fluorescence intensity of were changed by the same concentration (100 μM) of BPA significantly indicating that fluorescence change occurred after the addition of BPA. Therefore, we concluded that this method had good selectivity for bisphenol A, and it had strong anti-interference ability.
The probe's stability was evaluated at different pH values and temperatures. It is found that fluorescence intensity (F439/F623) was nearly unchanged over a wide pH range of 3–11 (Fig. S5†), indicating that CDs@Eu–AMP were stable in both acidic and alkaline conditions. In addition, over the temperature range of 10–50 °C, the fluorescence intensity of the probe did not change significantly in seven days (Fig. S6† and 4D), suggesting that CDs@Eu–AMP had good stability.
3.4 Determination of BPA in environmental water samples
The applicability of the CDs@Eu–AMP ratiometric probe for the detection of BPA in environmental water samples was investigated using the standard addition method. Various concentrations of BPA were added to three kinds of water samples (0.5, 10.0, 50.0, 100.0 μM). The results were shown in Table 1, the recoveries of the added standard BPA in water samples ranged from 91.80 to 102.7% with relative standard derivation (RSD) values no more than 1.84% (n = 3). The results suggest that CDs@Eu–AMP ratiometric probe possesses more advantages and could provide accurate and credible detection of BPA in water.| Samples | Spiked (μM) | Detected (μM) | Recovery (%) | RSD (%) |
|---|---|---|---|---|
| River water | 0.50 | 0.51 | 102.07 ± 0.59 | 0.49 |
| 5.00 | 5.11 | 102.20 ± 0.39 | 0.39 | |
| 10.00 | 10.12 | 101.20 ± 0.40 | 0.40 | |
| 50.00 | 50.88 | 101.76 ± 1.15 | 0.41 | |
| Lake water | 0.50 | 0.46 | 92.33 ± 2.17 | 1.84 |
| 5.00 | 4.59 | 91.80 ± 0.65 | 0.65 | |
| 10.00 | 9.19 | 91.90 ± 0.57 | 0.60 | |
| 50.00 | 46.06 | 92.13 ± 0.41 | 0.50 | |
| Tap water | 0.50 | 0.47 | 94.47 ± 1.06 | 1.59 |
| 5.00 | 4.80 | 95.93 ± 1.88 | 1.77 | |
| 10.00 | 9.87 | 98.70 ± 0.51 | 0.56 | |
| 50.00 | 48.63 | 97.27 ± 0.71 | 0.61 |
3.5 Visual determination of BPA using the test paper
Moreover, a simple, convenient portable paper-based visual ratiometric probe was developed by using CDs@Eu–AMP immobilized on the test paper for BPA detection. In the present study, the coffee ring paper ratio fluorescence for BPA detection was performed (Fig. 5) at different concentrations of BPA (0, 20, 40, 60, 80 and 100 μM). As shown in Fig. 5, Eu–AMP (Fig. 5A) and CDs (Fig. 5C) presented the original red and dark blue at different concentrations of BPA under the excitation of a 310 nanometer ultraviolet lamp. However, for the CDs@Eu–AMP (Fig. 5B), in the presence of BPA, a ring structure with strong red fluorescence emission appeared on the periphery of the pattern. With the increasing concentrations of BPA, the fluorescent red region of the spots gradually became larger. At the same time, the size of blue spots became smaller, and the size of rings became larger as the width increased. The reason might be that the reticular structure of CDs@Eu–AMP was reduced to form a small Eu–BPA complex. However, the same operation for Eu–AMP (Fig. 5A) and CDs (Fig. 5C) did not show the coffee ring and still presented the original color, suggesting that CDs@Eu–AMP can be used for the visual detection of BPA (color processing software used CIE-1931). This phenomenon could be explained as follows: in the evaporation-induced enrichment of CDs@Eu–AMP nanocomposites, the increasing concentrations of BPA could not only significantly change the fluorescence color of the kit, but also significantly change the pattern of the coffee ring.50 The deposition pattern of CDs@Eu–AMP nanocomposites was a spot covering the entire drop-casting area. The prepared paper was further used to determine BPA (40 and 80 μM) in environmental water samples and the results were shown in Table 2. The results were basically satisfactory, indicating that the test paper has a certain application prospect for the detection of BPA in environmental samples.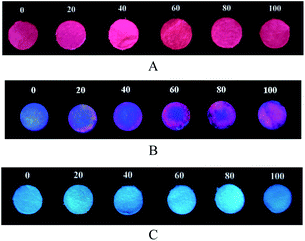 | ||
| Fig. 5 Multichannel coffee ring test paper based on the stimulus response of (A) Eu–AMP; (B) CDs@Eu–AMP nanocomposites and (C) CDs at different concentrations of BPA (0, 20, 40, 60, 80 and 100 μM). | ||
4. Conclusions
In summary, a highly selective, high sensitivity ratio fluorescent probe for BPA determination was successfully developed. With the increase of BPA concentration, fluorescence decreased at 439 nm and increased at 623 nm. The CDs@Eu–AMP ratiometric fluorescent probe showed a sensitive response to BPA in a wide range of 0.1–100.0 μM with a low detection limit of 20 nM. More importantly, a visible paper-based ratio probe coffee ring based on CDs@Eu–AMP nanocomposites had been manufactured, which was used to monitor BPA under a portable ultraviolet lamp. The visual paper-based colorimetric probe is convenient, fast, and inexpensive, and can meet the requirements for the accurate monitoring of BPA concentrations in real water samples.Conflicts of interest
There are no conflicts to declare.Acknowledgements
This work was financially supported by the National Natural Science Foundation of China (21778047, 21675138, 21705139) and Natural Science Foundation of Shandong Province (grant no. ZR2021MB024).References
- A. V. Krishnan, P. Stathis, S. F. Permuth, L. Tokes and D. Feldman, Endocrinology, 1993, 132, 2279 CrossRef CAS PubMed.
- C. A. Staples, P. B. Dome, G. M. Klecka, S. T. Oblock and L. R. Harris, Chemosphere, 1998, 36, 2149 CrossRef CAS PubMed.
- G. R. Marchesini, E. Meulenberg, W. Haasnoot and H. Irth, Anal. Chim. Acta, 2005, 528, 37 CrossRef CAS.
- J. Michalowicz, Environ. Toxicol. Pharmacol., 2014, 37, 738 CrossRef CAS PubMed.
- J. R. Rochester, Reprod. Toxicol., 2013, 42, 132 CrossRef CAS PubMed.
- J. Ruta, S. Perrier, C. Ravelet, J. Fize and E. Peyrin, Anal. Chem., 2009, 81, 7468 CrossRef CAS PubMed.
- J. Corrales, L. A. Kristofco, W. B. Steele, B. S. Yates, C. S. Breed, E. S. Williams and B. W. Brooks, Dose-Response, 2015, 13, 1 CrossRef CAS PubMed.
- S. Wei, W. Duan, Y. Shi, Q. Chang and S. Wang, Anal. Methods, 2018, 10, 5313 RSC.
- Z. G. Sheng, C. Wang, F. R. Ren, Y. X. Liu and B. Z. Zhu, J. Environ. Sci., 2019, 75, 1 CrossRef PubMed.
- B. L. L. Tan, D. W. Hawker, J. F. Mueller, F. D. L. Leusch and L. A. Tremblay, Chemosphere, 2007, 69, 644 CrossRef CAS PubMed.
- J. Oehlmann, U. Schulte-Oehlmann and J. Bachmann, Ecotoxicol. Environ. Saf., 2008, 69, 577 CrossRef CAS PubMed.
- M. A. Farajzadeh, M. Abbaspour, M. R. A. Mogaddam and A. A. A. Nabil, Food Anal. Methods, 2015, 8, 2035 CrossRef.
- N. E. A. M. Subuhi, S. M. Saad, N. N. M. Zain, V. Lim, M. Miskam, S. Kamaruzaman, M. Raoov and N. Yahaya, J. Sep. Sci., 2020, 43, 3294 CrossRef CAS PubMed.
- D. Kim, J. Han and Y. Choi, Anal. Bioanal. Chem., 2013, 405, 377 CrossRef CAS PubMed.
- P. N. Huang, S. Q. Zhao, S. A. Eremin, S. W. Zheng, D. Lai, Y. S. Chen and B. Guo, Anal. Methods, 2015, 7, 4246 RSC.
- W. L. Hu, J. Y. Liu and Q. Zhang, J. Health Inspection, 2011, 21, 530 Search PubMed.
- J. L. Bricks, A. Kovalchuk, C. Trieflinger, M. Nofz and K. Rurack, J. Am. Chem. Soc., 2005, 127, 13522 CrossRef CAS PubMed.
- A. S. Klymchenko and A. P. Demchenko, J. Am. Chem. Soc., 2002, 124, 12372 CrossRef CAS PubMed.
- Y. W. Li, J. R. Li and L. F. Wang, J. Mater. Chem. A, 2013, 1, 495 RSC.
- M. K. R. Mudiam, R. Jain, V. K. Dua, A. K. Singh, V. P. Sharma and R. C. Murthy, Anal. Bioanal. Chem., 2011, 401, 1695 CrossRef PubMed.
- A. Zhu, Q. Qu, X. Shao, B. Kong and Y. Tian, Angew. Chem., 2012, 51, 7185 CrossRef CAS PubMed.
- N. Singh, N. Kaur, R. C. Mulrooney and J. F. Callan, Tetrahedron Lett., 2018, 49, 6690 CrossRef.
- Y. Z. Yang, Y. Z. Fan, J. Zhou, X. Y. Zhang, N. Li and H. Q. Luo, J. Mater. Chem. C, 2020, 8, 13063 RSC.
- P. Y. Lv, Y. Y. Xu, Z. Liu, G. P. Li and B. X. Ye, Microchem. J., 2020, 152, 104255 CrossRef CAS.
- D. Duana, K. L. Fan, D. X. Zhang, S. G. Tan, M. F. Liang, Y. Liu, J. L. Zhang, P. H. Zhang, W. Liu, X. G. Qiu, G. P. Kobinger, G. F. Gao and X. Y. Yan, Biosens. Bioelectron., 2015, 74, 134 CrossRef PubMed.
- Y. F. He, F. Qi, X. H. Niu, W. C. Zhang, X. F. Zhang and J. M. Pan, Anal. Chim. Acta, 2018, 1021, 113 CrossRef CAS PubMed.
- Y. J. Chen, H. Y. Cao, W. B. Shi, H. Liu and Y. M. Huang, Chem. Commun., 2013, 49, 5013 RSC.
- Y. F. He, X. H. Niu, L. B. Shi, H. L. Zhao, X. Li, W. C. Zhang, J. M. Pan, X. F. Zhang, Y. S. Yan and M. B. Lan, Microchim. Acta, 2017, 184, 2181 CrossRef CAS.
- Q. Q. Wang, H. Wei, Z. Q. Zhang, E. K. Wang and S. J. Dong, Trends Anal. Chem., 2018, 105, 218 CrossRef CAS.
- S. Q. Li, X. D. Liu, H. X. Chai and Y. M. Huang, Trends Anal. Chem., 2018, 105, 391 CrossRef CAS.
- F. He, X. Li, X. C. Xu, J. M. Pan and X. H. Niu, J. Mater Chem. B, 2018, 6, 5750 RSC.
- H. W. Song, H. Y. Wang, X. Li, Y. X. Peng, J. M. Pan and X. H. Niu, Anal. Chim. Acta, 2018, 1044, 154 CrossRef CAS PubMed.
- X. Y. Wang, L. Qin, M. Zhou, Z. P. Lou and H. Wei, Anal. Chem., 2018, 90, 11696 CrossRef CAS PubMed.
- H. Qiu, F. Pu, X. Ran, C. Q. Liu, J. S. Ren and X. G. Qu, Anal. Chem., 2018, 90, 11775 CrossRef CAS PubMed.
- W. Li, B. Chen, H. X. Zhang, Y. H. Sun, J. Wang, J. L. Zhang and Y. Fu, Biosens. Bioelectron., 2015, 66, 251 CrossRef CAS PubMed.
- W. C. Zhang, X. H. Niu, S. C. Meng, X. Li, Y. F. He and J. M. Pan, Sens. Actuators B: Chem., 2018, 273, 400 CrossRef CAS.
- Y. F. He, X. H. Niu, L. H. Li, X. Li, W. C. Zhang, H. L. Zhao, M. B. Lan, J. M. Pan and X. F. Zhang, ACS Appl. Nano Mater., 2018, 30, 1 Search PubMed.
- X. H. Niu, Y. F. He, X. Li, H. L. Zhao, J. M. Pan, F. X. Qiu and M. B. Lan, Sens. Actuators B: Chem., 2019, 281, 445 CrossRef CAS.
- X. H. Niu, Y. F. He, X. Li, H. W. Song, W. C. Zhang, Y. X. Peng, J. M. Pan and F. X. Qiu, ChemistrySelect, 2017, 2, 10854 CrossRef CAS.
- Y. Li, Y. Q. Wang, D. Liu, Y. Gao, S. N. Wang and H. X. Qiu, ACS Omega, 2021, 6, 14629 CrossRef CAS PubMed.
- S. T Zhang, D. X. Zhang, X. H. Zhang, D. H. Shang, Z. H. Xue, D. L. Shan and X. Q. Lu, Anal. Chem., 2017, 89, 3538 CrossRef PubMed.
- Y. Fu, H. X. Zhang, S. D. Dai, X. Zhi, J. L. Zhang and W. Li, Analyst, 2015, 140, 6676 RSC.
- B. W. Liu, Z. C. Huang and J. W. Liu, Nanoscale, 2016, 8, 13562 RSC.
- H. Liao, G. J. Liu, Y. Liu, R. Li, W. S. Fu and L. Z. Hu, Chem. Commun., 2017, 53, 10160 RSC.
- H. W. Song, Z. B. Li, Y. X. Peng, X. Li, X. C. Xu, J. M. Pan and X. H. Niu, Analyst, 2019, 144, 2416 RSC.
- L. L. Chen, H. Xu, L. Wang, Y. Li and X. K. Tian, Microchim. Acta, 2020, 187, 1 CrossRef PubMed.
- H. Y. Hu, D. Xie, Y. Wu, N. G. Lin, A. X. Song and J. C. Hao, Chem.–Eur. J., 2017, 23, 15721 CrossRef PubMed.
- X. Li, L. J. Wang, D. Du, L. Ni, J. M. Pan and X. H. Niu, Trends Anal. Chem., 2019, 120, 115653 CrossRef CAS.
- Q. Xu, J. Zhao, Y. Liu, P. Pu, X. Wang, Y. Chen, C. Gao, J. Chen and H. Zhou, J. Mater. Sci., 2015, 50, 2571 CrossRef CAS.
- C. Y. Huang, R. X. Ma, Y. X. Luo, G. Y. Shi, J. J. Deng and T. S. Zhou, Anal. Chem., 2020, 92, 12934 CrossRef CAS PubMed.
- M. C. Rong, X. Z. Deng, S. T. Chi, L. Z. Huang, Y. B. Zhou, Y. E. Shen and X. Chen, Microchim. Acta, 2018, 185, 1302 CrossRef PubMed.
- J. C. He, G. K. Li and Y. L. Hu, Microchim. Acta, 2017, 184, 2365 CrossRef CAS.
Footnote |
| † Electronic supplementary information (ESI) available. See DOI: 10.1039/d2ra00039c |
| This journal is © The Royal Society of Chemistry 2022 |


