 Open Access Article
Utility of green chemistry for native spectrofluorimetric quantification of darolutamide as a modern anti-neoplastic drug in its market form and biological fluids
Hesham Salem *a,
Amany Abdelaziza,
Mai R. Mekawyb,
Mohamed M. Mahmoudb,
Kerolos Wissab,
Doaa Fisalb and
Mahmoud A. Abdelmajeda
aPharmaceutical Chemistry Department, Faculty of Pharmacy, Deraya University, New Minia, Egypt. E-mail: h_salem_eg@yahoo.com; hesham.salem@deraya.edu.eg
bFaculty of Pharmacy, Deraya University, New Minia, Egypt
First published on 31st March 2022
Abstract
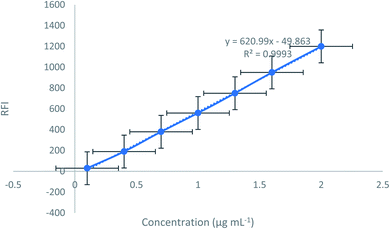
A simple, new, green, and sensitive approach was established and validated for assay of the recently approved antineoplastic medication; darolutamide (DAR) in its authentic form, pharmaceutical formulation, and biological fluids fluorimetrically. This experiment relied on the native fluorescence of the cited drug and detects the ideal solvent utilized throughout the approach. The proposed approach was validated regarding linearity, accuracy, and precision. The calibration graph showed linearity over the range of 0.1–2.0 μg mL−1. The limit of detection and quantitation (LOD and LOQ) were 0.032 μg mL−1 and 0.09 μg mL−1, respectively. Because of the approach's high sensitivity, it was decided to spike the mentioned drug in plasma and urine samples. At last, checking for content uniformity was performed regarding the United States Pharmacopoeia (USP) by adjusting the proposed approach.
1. Introduction
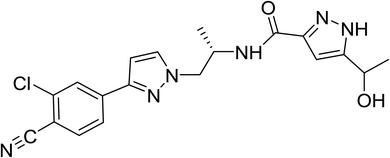
Prostatic cancer (PC) is the second most frequent solid cancer in males and the fifth-biggest cause of cancer-related mortality in men. PC tumor advancement and progression are helped by androgen receptor (AR) signaling, with androgens promoting PC multiplication and survival.1,2 It has been detected that androgen stimulation is a cause for up to 80% of prostate carcinomas. Androgen deprivation treatment or surgical castration is the most common therapy for metastatic prostate cancer. DAR is a recently developed drug that is recommended for that type of tumor. Darolutamide (DAR) is chemically N-[(2S)-1-[3-(3-chloro-4-cyanophenyl)pyrazol-1-yl]propan-2-yl]-5-(1-hydroxyethyl)-1H-pyrazole-3-carboxamide (Fig. 1), its brand name is Nubeqa, and is a novel second-generation orally active nonsteroidal antiandrogen for the treatment of castrate-resistant, non-metastatic prostate cancer.In the literature review, DAR has only a few reported approaches with certain techniques, such as chromatographic techniques3–12 and recently only one spectrofluorimetric technique,13 in which depends on quantitative fluorescence quenching of mercurochrome reagent with the studied drug. Chromatographic techniques such as LC-MS and HPLC have many requirements as, sample pretreatments, including protein precipitation and solid-phase extraction, which drain huge volumes of solvents, which raise costs and have a bad effect on the environment and are hard to get, so they may not be useable in numerous laboratories. On the other hand, spectrofluorimetric approaches are generally utilized in quality control and other research because of their high sensitivity, selectivity, simplicity, and wide application. As mentioned previously, only one spectrofluorimetric approach for the estimation of DAR is present. As a result, this work aims to establish a new, non-extractive, sensitive, and cost-effective fluorimetric approach for quantification of the cited drug in its authentic, pharmaceutical form, and biological fluids to meet the green chemistry requirements. Using ethanol as a diluent without further extraction and disuse of hazard solvents makes this approach environmentally friendly without any harmful impact. As a consequence, this approach can be considered for that moment the method of choice for quantification of DAR in pure form, dosage form, and biological fluids due to its simplicity, environmentally friendly, and sensitivity than the reported one.
2. Experimental
2.1 Apparatus
A 150 W xenon streak lamp and a 1 cm quartz cell were used in Agilent Cary Overshadow Fluorescence Spectrofluorimeter (USA). The excitation and emissions opening slits were 10 nm in diameter, and the Cary overshadow search program software version 1.2 was used. To assess pH, a HANNA pH 211 chip pH meter with double intersection glass anode was employed, A 4000 rpm (Bramsen ECCO, Germany) centrifuge was also utilized.2.2 Materials and dosage forms
DAR was kindly supplied by Bayer HealthCare; Dana-Farber Cancer Institute; Latin American Cooperative Oncology Group; Orion. Its purity was found to be 99.75% according to its comparison spectrofluorimetric approach.13 Nubeqa® oral tablets, as a dosage form is claimed to contain 300 mg of DAR (Bayer Co., USA).Phosphoric acid, citric monohydrate acid, sodium hydroxide, disodium hydrogen phosphate, hydrochloric acid, sodium dodecyl sulfate (SDS), Tween 80, ethanol, methanol, acetonitrile, and dimethylformamide (DMF) were among the other chemicals used, all of which were purchased from the ELNasr Chemical Co. (Cairo, Egypt). McIlvaine buffer was produced by combining various amounts of 0.2 M disodium dihydrogen phosphate and 0.1 M citric acid to yield a set of buffers with a pH range of (3.0–7.0). To produce solutions with a pH ranging from 7 to 12, Teorell & Steinhagen buffer was employed. Hence, 1 M sodium hydroxide, 1 M phosphoric acid, and 1 M citric acid were mixed, then adjusted with 0.1 M HCl. Plasma and urine samples were obtained from Minia University Hospital, blood bank, Minia, Egypt, and were kept in solid form until use after careful defrosting.
2.3 Standard solution
In a volumetric flask, 10.0 mg of DAR was dissolved in 100 mL ethanol to provide a stock solution of 100 μg mL−1. Further dilutions of the used stock were made using the same diluent to give concentrations within the range of 1–20.0 μg mL−1 to output the working solutions. When kept at 4 °C, the solutions stayed stable for about a couple of weeks.2.4 Procedure
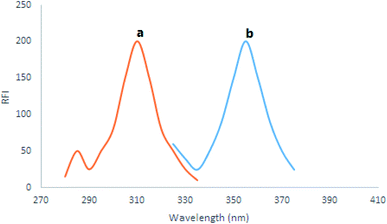
Using a set of 10.0 mL volumetric flasks, further dilutions of 1.0 mL of DAR's working solutions were performed using ethanol as the diluent. Each flask's content showed native fluorescence intensity, which was observed at λem 355 nm following excitation at 310 nm for the cited drug. In addition, ethanol was tested individually to illustrate the blank experiment.2.5 Quantification of the medication in the market formula
A certain weight of the mixed fine authentic powder from 20 tablets of Nubeqa® tablets was dissolved in ethanol that was equivalent to 10.0 mg of DAR. The solution was then filtered into a volumetric flask with a capacity of 100.0 mL, and ethanol was added up to the mark. This filtrate was diluted via the same diluent to finally make working solutions with a concentration range of 1–20 μg mL−1, then followed by the previously mentioned procedure.2.6 Quantification of the investigated medication in biological fluids
2.7 Test of tablet content uniformity
To get a workable concentration of 10 μg mL−1, ten individually crushed (Nabeqa® 300) mg tablets were dissolved and filtered using the suggested solvent. Within the prescribed technique, 1.0 mL of this solution was used to allow the final working concentration of 1 μg mL−1, which was within the linear range of the suggested experiment. The content uniformity testing was connected to understanding the United States Pharmacopoeia (USP) rules.14 After individually assessing ten pills, the acceptability value (AV) was evaluated.3. Discussion and approach's results
DAR displayed native fluorescence at (355 nm) after excitation at 310 nm (Fig (2)). Our technique presented a simple, green as well as fast spectrofluorimetric measurement method for the recently approved studied drug, DAR, in its market formulation and biological fluids.3.1 Optimization
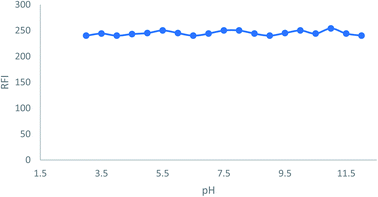
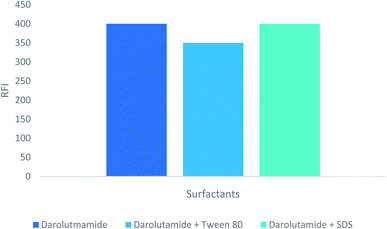
In order to find the optimum conditions, the experimental factors that may influence the native fluorescence or its stability were studied. The values of each of these parameters were altered independently, while the values of the other parameters remained constant.3.2 Assay validation
The suggested technique was validated using the International Council for Harmonization (ICH) criteria,16 and the results were as follows.| Item | Proposed method | Reported method13 |
|---|---|---|
| Reagent | Absent | Present (mercurochrome) |
| Linear range | 0.1–2.0 μg mL−1 | 0.4–10.0 μg mL−1 |
| Correlation coefficient | 0.9992 | 0.9990 |
| Wavelength | λex 310 nm, λem 355 nm | λex 350 nm, λem 583 nm |
| Heating | Absent | Absent |
| Extraction step | Absent | Present |
| Buffer | Absent | Present |
| Surfactant | Absent | Absent |
| Application | Dosage form, content uniformity testing, spiked human plasma and urine sample | Dosage form, spiked human plasma and urine sample |
3.3 Application of the prescribed approach
| Dosage form | Labeled content | Mean of % recoverya ± SD | t-valueb | F-valueb | |
|---|---|---|---|---|---|
| Proposed method | Reported method | ||||
| a Mean of five replicate determinations.b The tabulated t-value and F-value at the 95% confidence limit are 2.78 and 6.39, respectively. | |||||
| Nubeqa® tablet | 300 mg | 99.65 ± 0.88 | 100.21 ± 1.44 | 0.609 | 2.677 |
4. Conclusion
The new approach was shown to be more sensitive, simple, and fast than the only published fluorimetric paper for the investigated drug without uasgae of either reagents, buffers or surfactants. Moreover, utilizing a single excitation step with green solvent may be conveniently employed in quality control laboratories because it takes less time and effort. Other methodologies with comparable sensitivity, such as LC and HPLC, used more complicated steps, very costly equipment, complex instrumentation, expensive organic solvents, and time-consuming procedures.Ethical statement
All experiments were performed in accordance with the Guidelines “Ethics Requirements”, and approved by the ethics committee at Deraya university. Informed consents were obtained from human participants of this study.Author contributions
All authors contributed to the study's conception and design. Data collection and analysis were performed by all authors. The first draft of the manuscript was written by Hesham Salem and all authors commented on previous versions of the manuscript. All authors read and approved the final manuscript.Conflicts of interest
The authors declare that they have no competing financial interests.References
- R. L. Siegel, S. A. Fedewa, K. D. Miller, A. Goding-Sauer, P. S. Pinheiro, D. Martinez-Tyson and A. Jemal, Ca-Cancer J. Clin., 2015, 65, 457–480 CrossRef PubMed.
- J. Ferlay, E. Steliarova-Foucher, J. Lortet-Tieulent, S. Rosso, J. W. W. Coebergh, H. Comber, D. Forman and F. Bray, Eur. J. Cancer, 2013, 49, 1374–1403 CrossRef CAS PubMed.
- V. Kiran, A. Dixit, B. B. Gabani, N. R. Srinivas and R. Mullangi, Biomed. Chromatogr., 2020, 34 DOI:10.1002/BMC.4938.
- N. Balaji, S. P. Sulochana, N. K. Saini, A. Siva Kumar and R. Mullangi, Biomed. Chromatogr., 2018, 32, e4173, DOI:10.1002/BMC.4173.
- S. P. Sulochana, N. K. Saini, P. Daram, S. B. Polina and R. Mullangi, J. Pharm. Biomed. Anal., 2018, 156, 170–180 CrossRef CAS PubMed.
- A. Zakkula, V. Kiran, U. Todmal, S. P. Sulochana and R. Mullangi, Drug Res., 2019, 69, 537–544 CrossRef CAS PubMed.
- N. K. Saini, S. P. Sulochana, M. Zainuddin and R. Mullangi, ADMET DMPK, 2018, 6, 242–257 CrossRef.
- K. Fizazi, M. R. Smith and B. Tombal, Clin. Genitourin. Cancer, 2018, 16, 332–340 CrossRef PubMed.
- S. Dittakavi, P. K. V. S. P. Nagasuri, S. P. Sulochana, S. M. Saim, S. R. Mallurwar, M. Zainuddin, P. Dewang, S. Rajagopal and R. Mullangi, J. Pharm. Biomed. Anal., 2017, 145, 454–461 CrossRef CAS PubMed.
- N. Matsubara, H. Mukai, A. Hosono, M. Onomura, M. Sasaki, Y. Yajima, K. Hashizume, M. Yasuda, M. Uemura and C. Zurth, Cancer Chemother. Pharmacol., 2017, 80, 1063–1072 CrossRef CAS PubMed.
- K. Fizazi, L. Albiges, Y. Loriot and C. Massard, ODM-201, Expert Rev. Anticancer Ther., 2015, 15, 1007–1017 CrossRef CAS PubMed.
- K. Mori, H. Mostafaei, B. Pradere, R. S. Motlagh, F. Quhal, E. Laukhtina, V. M. Schuettfort, M. Abufaraj, P. I. Karakiewicz, T. Kimura, S. Egawa and S. F. Shariat, Int. J. Clin. Oncol., 2020, 25, 1892–1900 CrossRef CAS PubMed.
- H. Salem, N. Abdal-Karim, B. Omran, A. R. Abdel-Gayed, M. Atef and M. Abdelgaleel, Luminescence, 2022, 1–9, DOI:10.1002/bio.4206.
- The National Formulary 25 US Pharmacopeial convention, Electronic version, 2007 Search PubMed.
- M. Pesez and J. Bartos, Colorimetric and Fluorimetric Analysis of Organic Compounds and Drugs, Marcel Dekker, Madison Avenue, New York, 1974 Search PubMed.
- ICH Harmonized Tripartite Guideline, Validation of Analytical Procedures: Text and Methodology, Q2 (R1), Current Step 4 Version, Parent Guidelines on Methodology, Dated 6 November 1996, Incorporated, 2005 Search PubMed.
- M. Rockville, The United States Pharmacopoeia 30, The National Formulary 25 US Pharmacopeial Convention, Electronic version, 2007 Search PubMed.
| This journal is © The Royal Society of Chemistry 2022 |

