 Open Access Article
Creative Commons Attribution 3.0 Unported Licence
Comparative study of the elimination of copper, cadmium, and methylene blue from water by adsorption on the citrus Sinensis peel and its activated carbon
Wassim El Malti *a,
Akram Hijazib,
Zahraa Abou Khalilb,
Zahraa Yaghib,
Mohamad Kazem Medlej
 b and
Mohamad Redab
aCollege of Engineering and Technology, American University of the Middle East, Kuwait. E-mail: Wassim.elmalti@aum.edu.kw
bResearch Platform for Environmental Science (PRASE), Doctoral School of Science and Technology, Lebanon
First published on 31st March 2022
Abstract
The accumulation of heavy metals and dyes in wastewater is a persistent environmental threat with serious hazards consequences affecting all living organisms. Their removal has become a challenging environmental requirement. Adsorption using agricultural waste is one of the cost-effective removal techniques in which the biomass can be valorized. In this study, two adsorbents were prepared and compared in removing copper, cadmium, and methylene blue from water: citrus Sinensis peel (CP) and its activated carbon (AC). Many physical and chemical properties of the prepared adsorbents were investigated using several techniques. Various operational parameters such as initial adsorbate concentration, contact time, pH, adsorbent mass, and temperature were examined. The optimum uptake of Cd, Cu, and MB was obtained after 2 h contact time by using 0.25 g of adsorbent and 400 mg L−1 metal ions or 100 mg L−1 MB initial concentration at pH 5 (for metal ions only) and temperature of 25 °C. Slight superiority for the CP was seen. Furthermore, isothermal models were resolved in all the studied cases. Unlike for MB, the Langmuir model is more applicable for the adsorption of the cations on both adsorbents with maximum adsorption of 80 mg g−1 of Cd(II) on CP. Finally, the adsorbents achieved good reuse performance, especially for CP which can be used up to 4 times to remove the metal ions, proving that they are low-cost and environmentally friendly materials able to remove inorganic and organic contaminants from water.
Introduction
The excessive emission of organic and inorganic pollutants in water by various industrial, medical, and agricultural activities is a critical global environmental problem.1 Inorganic contaminants, mainly heavy metals such as copper (Cu) and cadmium (Cd), are not susceptible to biological degradation and accumulate in living tissues through the food chain, causing harmful and severe health issues.2 Similarly, the released organic contaminants, such as dyes, can accumulate in the environment generating aesthetic pollution and causing a detrimental effect on photosynthesis.3 Furthermore, methylene blue (MB) ingestion can produce severe health conditions.Several conventional techniques were used to remove heavy metals and dyes from wastewater, including precipitation, ion exchange, membrane separation, coagulation–flocculation. However, most of these techniques encounter drawbacks such as high cost, production of sludge, low selectivity, and other operational complications.4,5
Due to its easy handling and simplicity in design, the adsorption process has been widely developed in treating wastewater for heavy metal ions and dyes removal.6 Many studies consisting of implementing highly efficient, eco-friendly, and low-cost adsorbents were reported in the literature.7 Recently, with the significant increase in environmental awareness, modified or unmodified agriculture waste and its activated carbon have been valorized and used as adsorbents for removing organic and inorganic contaminants from wastewater.8 Banana peel, papaya wood, waste tea leaves, spent coffee ground,9 coconut husk,10 pea shells activated carbon, and palm fruit activated carbon are examples of adsorbents that showed encouraging results in the sorption process. Table 1 includes significant results obtained by removing Cd, Cu, and MB from water using a few of the listed agriculture waste and its activated carbon in the literature. The efficiency of the metal uptake and the adsorption of the dyes depended on the surface properties of the adsorbent.
| Adsorbent | Adsorbate | Adsorption capacity (%) | Reference |
|---|---|---|---|
| Banana peel | Cd | 89.2% | 11 |
| Cu | 88.0% | 12 | |
| MB | 90.0% | 13 | |
| Papaya wood | Cd | 94.9% | 14 |
| Cu | 97.8% | 14 | |
| Waste tea leaves | Cd | 99.5% | 15 |
| Coconut husk | Cd | 95.2–98.8% | 16 |
| Cu | 75.0–98.5% | 16 | |
| Pean shells activated carbon | Cd | 95.6% | 17 |
| Cu | 96.4% | 17 | |
| MB | 99.7% | 18 | |
| Palm shells activated carbon | Cd | 90.0% | 19 |
| Cu | 95.0% | 19 | |
| MB | 97.1% | 20 |
Usually, agriculture waste includes diverse organic compounds, such as phenols, cellulose, hemicellulose, and pectin, and has several functional groups on its surface. Hydroxyl, carboxyl, and carbonyl groups are the main surface functional groups with a good tendency for metal ion complexation and electrostatic interactions.21
Citrus Sinensis is one of the most fruit collections globally available, popular, and consumed. It grows worldwide in more than 140 countries in tropical and subtropical regions, with an annual production of approximately 110 million tons.22,23 Citrus Sinensis peels (CP) represent almost 44% of the fruit body, producing an enormous by-products mass which is usually discarded as waste. Thus, these peels represent an excellent potential to be valorized. The activated carbon (AC) derived from the peels can be produced by pyrolysis and chemical activation using an oxidizing agent, such as hydrogen peroxide (H2O2), penetrating the interface through the CP porous surface.
This work aimed to compare the adsorption performance of the valorized CP and its AC in removing Cu(II), Cd(II), and MB. The AC was synthesized by pyrolysis of CP and activation using an H2O2 aqueous solution. Different chemical and physical properties of both adsorbents were determined using several techniques, including particle size analysis, scanning electron microscopy (SEM), Brunauer–Emmett–Teller (BET), energy-dispersive X-ray analysis (EDS), Fourier transform infrared spectroscopy (FTIR), and zeta potential. A batch of adsorption experiments was performed to investigate the adsorption performance by varying diverse experimental parameters such as initial adsorbate concentration, contact time, pH, adsorbent mass, and temperature. Langmuir and Freundlich adsorption isotherms were built at optimum conditions and sufficient contact time to understand the interaction of the different studied adsorbates with the implemented adsorbents. Finally, reusability tests were conducted to examine the regeneration performance of both implemented adsorbents.
Materials and methods
Preparation of citrus Sinensis peel (CP) powder
The citrus Sinensis peel was collected from a local Lebanese region, washed with deionized water, cut into small pieces, then left to dry at 25 °C for 48 hours. After complete drying, they were ground to 1 mm particles, and the resulting powder was washed with deionized water and dried at 60 °C for 24 hours.Preparation of the citrus Sinensis activated carbon (AC)
The dried CP powder was placed in crucibles to undergo pyrolysis in a furnace (Wise-Therm, 4 °C min−1) at 300 °C for 2 hours. The resulting biochar was washed with deionized water and dried at 100 °C for 2 hours.The chemical activation was executed by adding 500 mL of H2O2 (15%) to a 50 g biochar sample and stirring at 25 °C for 24 hours. The resulting AC powder was filtered and dried at 100 °C for 24 hours.
Adsorbent characterization
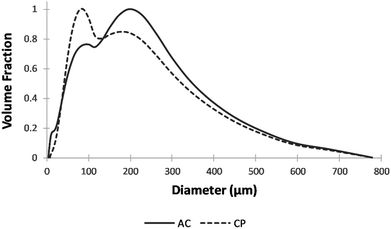
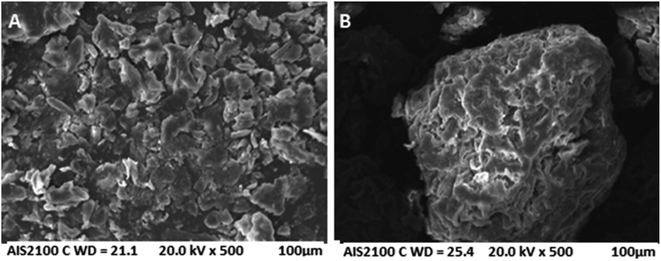
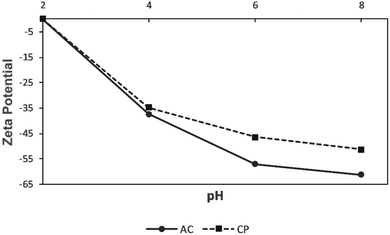
The prepared CP and AC adsorbents were characterized using several techniques. The particle size analysis was conducted using Partica LA-950 Laser Diffraction Particle Size Distribution Analyzer-HORIBA. The SEM images were taken on an AIS 2100C microscope (20 kV) with an ASID scanning accessory and EDAX analyzer. The BET analysis was conducted on a Micromeritics ASAP 2010. The EDS was conducted using energy-dispersive X-ray spectroscopy on X'Pert PRO MPD diffractometer. The FTIR was performed on the JASCO FTIR-6300 spectrometer (400–4000 cm−1). The zeta potential was measured using Zeta-Meter 4.0.Adsorption experiments of metal ions
A batch of sorption experiments of Cu(II) and Cd(II) on CP and AC particles was carried out. The experiments were conducted in 50 mL Erlenmeyer flasks containing CuCl2 or CdCl2·H2O (Sigma-Aldrich, analytical grade without further purification) solution with different initial concentrations (100–600 mg L−1). Various masses (0.25–2 g) of CP or AC were added at different temperatures (25–100 °C). The initial pH (1–6) was adjusted by adding HNO3 (1 M) or NaOH (1 M) solution, and the mixture was continuously stirred. Various samples were then taken at different times (0–180 min) using a micropipette and filtered to 0.45 μm. The filtrate was then analyzed by Atomic Absorption Spectroscopy (AAS; BRAIC spectrophotometer, air–acetylene flame), 324.8 nm wavelength for Cu(II), and 228.8 nm for Cd(II) to determine the final concentration of the metal ion.The adsorption capacity, Qe (mg g−1), was calculated by applying eqn (1):
 | (1) |
Adsorption experiments of methylene blue (MB)
A batch of sorption experiments of MB on CP and AC particles was conducted. The experiments were running in 50 mL Erlenmeyer flasks containing MB solution with different initial concentrations (20–100 mg L−1). Various masses (0.25–2 g) of CP or AC were added at different temperatures (25–100 °C), and the mixture was continuously stirred. Various samples were then taken at different times (0–120 min) using a micropipette.The adsorption capacity, Qe (mg g−1), was determined by Ultraviolet-Visible spectroscopy (UV-Vis; U-2900, dual-beam spectrometer, 200 V, 664 nm wavelength) by referring to eqn (1), where C0 and Ce (mg L−1) are the initial and equilibrium MB concentration in solution, respectively.
Adsorption isotherm models
 | (2) |
Then, RL, the separation factor constant derived from the Langmuir equation, was calculated as per eqn (3):
 | (3) |
 | (4) |
Reusability tests
These tests were performed on dried CP and AC samples already loaded by Cu(II), Cd(II), and MB at optimum conditions. Each sample loaded with heavy metals was placed in a 150 mL Erlenmeyer flask containing 100 mL of 1 M HCl solution, and the mixture was then stirred at 25 °C for 2 hours. Then, the solution containing the desorbed ions was checked by AAS, and the adsorbent was washed with deionized water and dried at 60 °C for 24 hours. After that, another adsorption experiment was performed on the dried adsorbent at optimum conditions. The same procedure was applied for the CP and AC loaded by MB but with 90% ethanol as eluant. The solutions containing the desorbed MB were investigated using the UV-Vis. 4 reuse cycles of adsorption–desorption were performed (in total, 5 uses of each adsorbent).All the studies were repeated three times with a standard deviation of 2% and reproducibility of 0.5%.
Results and discussion
Adsorbent characterization
| Adsorbent | Specific surface area (m2 g−1) | Total pore volume (cm3 g−1) | Average pore size (nm) |
|---|---|---|---|
| CP | 1.90 | 0.130 | 1.30 |
| AC | 96 | 3.70 | 12.1 |
| Adsorbent | Element | Mass (%) | Atom (%) |
|---|---|---|---|
| CP | C | 54.08 | 71.44 |
| O | 25.19 | 24.98 | |
| K | 1.68 | 0.68 | |
| Ca | 4.34 | 1.72 | |
| AC | C | 47.32 | 64.61 |
| O | 31.9 | 32.7 | |
| K | 1.15 | 0.48 | |
| Ca | 1.75 | 0.72 |
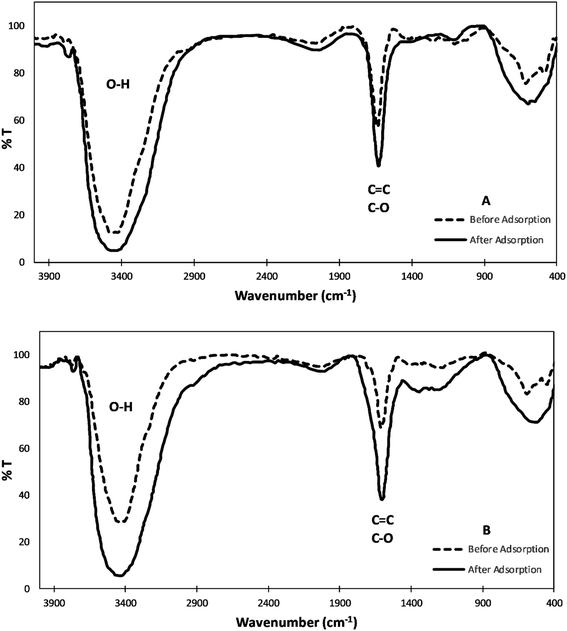
![[double bond, length as m-dash]](https://www.rsc.org/images/entities/char_e001.gif) C– stretches in the aromatic rings.29–31 After adsorption, both FTIR spectra show that the O–H band shifted at around 3440 cm−1 which signifies the involvement of the hydroxyl group in binding to the metal ion. Also, the peak emerging at about 1635 cm−1 is shifted to 1629 cm−1. These slight shifts can be attributed to the surface functional groups' energy changes upon binding to the heavy metals.4,32
C– stretches in the aromatic rings.29–31 After adsorption, both FTIR spectra show that the O–H band shifted at around 3440 cm−1 which signifies the involvement of the hydroxyl group in binding to the metal ion. Also, the peak emerging at about 1635 cm−1 is shifted to 1629 cm−1. These slight shifts can be attributed to the surface functional groups' energy changes upon binding to the heavy metals.4,32
Adsorption experiments
Effect of initial adsorbate concentration and contact time. A comparison between the adsorption capacity of CP and AC in removing Cu(II) and Cd(II) ions from water at different initial concentrations and contact times is presented in Fig. 5. The presented data shows that the adsorption capacity (Qe) increases as the initial adsorbate concentration and contact time increase in all the studied cases. Furthermore, the adsorption capacity of both ions on the CP is slightly higher than the adsorption data obtained on the AC. This may be due to the higher accessibility to the CP pores compared to the AC.
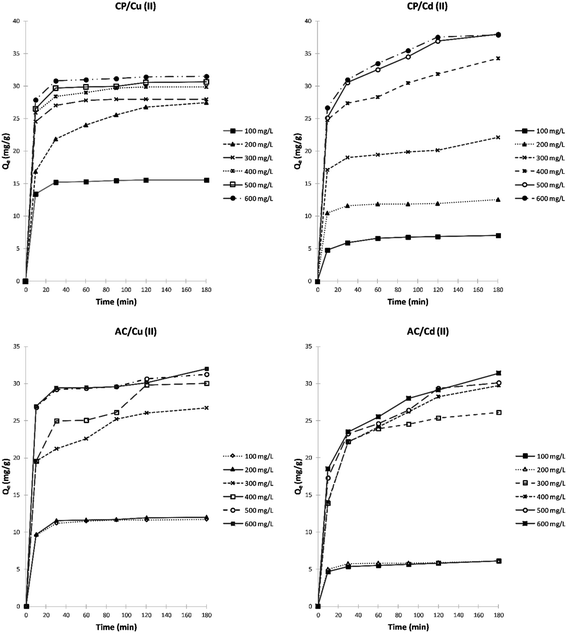 | ||
| Fig. 5 Effect of initial adsorbate (Cu2+, Cd2+) concentration and contact time on the adsorption capacity (Qe) of CP and AC particles (1 g of adsorbent, pH 3–4, 25 ± 2 °C). | ||
In the case of CP, and after 30 min of contact time, the adsorption capacity reaches almost the maximum and remains constant starting from an initial concentration of 400 mg L−1 for Cu2+. However, the adsorption capacity for Cd2+ keeps rising with increasing initial concentration and time until it reaches almost the maximum after 2 hours at 500 mg L−1. On the other hand, the adsorption capacity stays almost constant from 400 mg L−1 for Cu2+ and Cd2+ after 2 hours of stirring using the AC adsorbent. The high ratio of active surface sites to total metal ions in the solution at low concentrations can explain the obtained results; the adsorbent can retain most metal ions and remove them from the water. However, due to the stronger concentration gradient and the greater quantity of ions adsorbed per unit mass of adsorbent, the driving force causes the saturation of the adsorbent. Thus, the ions remain free in the solution.
Effect of pH. The pH of the aqueous solution is a crucial controlling parameter in the adsorption process. It directly influences the adsorbent surface charge and the ionic nature of the metal species. The results of the initial pH effect on the adsorption of both metal ions by CP and AC are presented in Fig. 6. It shows that the adsorption capacity increases as the pH becomes more basic. The maximum adsorption capacity was obtained at pH 5, where 33.3 mg g−1 of Cu2+ and 71.7 mg g−1 of Cd2+ were adsorbed by CP. Moreover, a slightly lower maximum adsorption capacity was obtained at pH 5 by the AC particles for both metal ions.
 | ||
| Fig. 6 Effect of pH on the adsorption capacity (Qe) of Cu2+ and Cd2+ on CP and AC particles (1 g of adsorbent, 400 mg L−1 adsorbate initial concentration, 25 ± 2 °C, 2 hours). | ||
The low adsorption capacities obtained at lower pH values can be attributed to the higher protonation present at the adsorbent surface. Higher pH values yield more significant metal adsorption due to fewer protons, more substantial negative ligands on the surface, and decreased competition between the H+ and metal cations.35
At higher pH (>5), the insoluble copper and cadmium hydroxide salts begin to precipitate in solution in addition to the adsorption mechanism.36,37
Effect of adsorbent mass. For both metal ions and using any of the studied adsorbents, Fig. 7 shows that the adsorption capacity decreases with increasing the mass of the dried powder. These capacities drop is assigned to the rise in unsaturated adsorption sites accompanying the relatively large surface area of the solids, which promotes lowering the mass of ions adsorbed relative to the initial mass of dried adsorbent.
 | ||
| Fig. 7 Effect of adsorbent mass on the adsorption capacity (Qe) of Cu2+ and Cd2+ on CP and AC particles (400 mg L−1 adsorbate initial concentration, pH 5 ± 0.1, 25 ± 2 °C, 2 hours). | ||
Effect of temperature. The adsorption of Cu2+ and Cd2+ by the different studied adsorbents was subjected to various temperatures by setting up all other parameters. As shown in Fig. 8, the adsorption capacity of copper ions on the CP slightly increases with increasing the temperature until it reaches a maximum value of 40.1 mg g−1 at 75 °C. This slight rise in adsorption capacity can be linked to the increasing number of functional groups on the biomass surface resulting from the higher hydrolysis rate. However, it can be seen in Fig. 8 that the temperature has almost no significance on the adsorption of cadmium ions on CP, and it slightly increases from 77.4 mg g−1 to 78 mg g−1 at 25 °C and 100 °C, respectively. On the other hand, Fig. 8 shows that the adsorption of Cu2+ and Cd2+ on the AC particles lessens with increasing the temperature. This can be explained by the fact that the adsorbed species gain enough energy by increasing the temperature so that the desorption rate becomes higher than that of the adsorption.
Langmuir isotherm model. The Langmuir isotherms of the adsorption of Cu2+ and Cd2+ on the CP and AC particles are shown in Fig. 9. In addition, the data obtained from the Langmuir isotherms and the RL calculated values are presented in Table 4. The RL values were used as the primary indicator of the Langmuir isotherm quality. The described sorption is favorable if RL lies between 0 and 1.
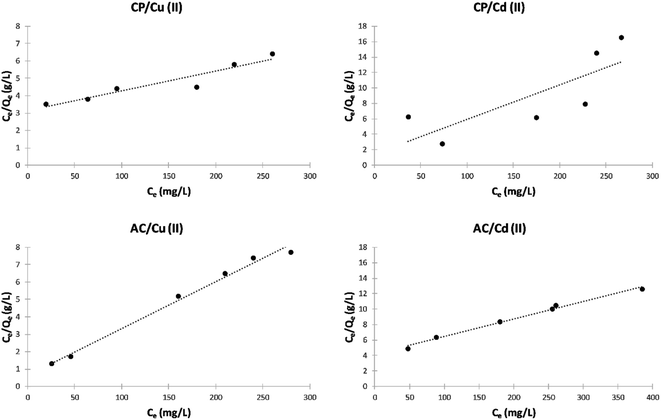 | ||
| Fig. 9 Langmuir isotherm plots of the adsorption of Cu2+ and Cd2+ on CP and AC particles (0.25 g adsorbent, pH 5 ± 0.1, 25 ± 2 °C, 2 hours). | ||
| Adsorbate | Adsorbent | KL | Qm | RL | R2 | Adsorption |
|---|---|---|---|---|---|---|
| Cu(II) | CP | 0.0390 | 40.00 | 0.985 | 0.9889 | Favorable |
| Cu(II) | AC | 0.0068 | 38.90 | 0.997 | 0.9935 | Favorable |
| Cd(II) | CP | 0.0041 | 80.00 | 0.997 | 0.9005 | Favorable |
| Cd(II) | AC | 0.0196 | 26.88 | 0.992 | 0.5623 | Favorable |
The RL values obtained in this study are smaller than 1, indicating that the adsorption is favorable for the four different studied cases.4 By comparing the maximum adsorption at monolayer (Qm) values in Table 4, it can be noticed that the adsorption by CP is more efficient than by its derived AC.
Freundlich isotherm model. The Freundlich isotherms of the adsorption of Cu2+ and Cd2+ on the CP and AC particles are shown in Fig. 10. Meanwhile, the data obtained from the Freundlich isotherms and the nF determined values are presented in Table 5. The nF values were determined to be used as a primary indicator of the adsorption intensity. In general, a favorable sorption is characterized by 1 < nF < 10 and a linear sorption is characterized by nF = 1. All the nF values determined by applying the Freundlich isotherm model lie between 1 and 10, indicating that the adsorption was favorable either by CP or AC for both metal ions. However, the adsorption of Cu2+ on CP particles is the most favored.4
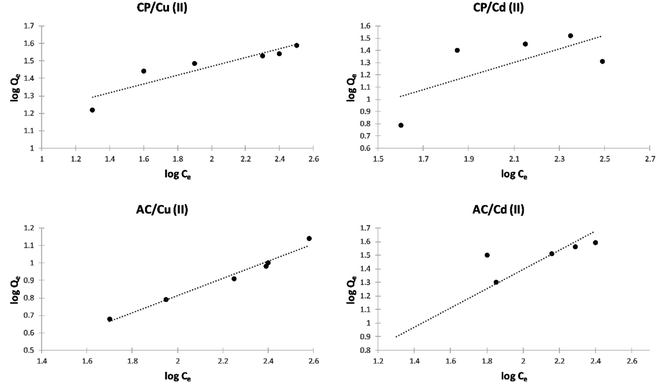 | ||
| Fig. 10 Freundlich isotherm plots of the adsorption of Cu2+ and Cd2+ on CP and AC particles (0.25 g adsorbent, pH 5 ± 0.1, 25 ± 2 °C, 2 hours). | ||
| Adsorbate | Adsorbent | KF | nF | R2 |
|---|---|---|---|---|
| Cu(II) | CP | 8.6200 | 3.595 | 0.8462 |
| Cu(II) | AC | 0.6860 | 2.058 | 0.9723 |
| Cd(II) | CP | 0.9641 | 1.417 | 0.8144 |
| Cd(II) | AC | 1.2290 | 1.842 | 0.4863 |
Finally, by comparing the correlation coefficients (R2) resulting from the Langmuir (Table 4) and Freundlich (Table 5) isotherm models, it can be noticed that the Langmuir model is more applicable for the adsorption of both cations on CP and AC, forming a monolayer. This may be due to a homogeneous distribution of active sites on the adsorbents' surface.29
Effect of initial adsorbate concentration and contact time. Fig. 11 shows the variation of the adsorption capacity as a function of contact time with both types of adsorbent using various initial concentrations of MB. The adsorption capacity of CP particles increases by increasing the initial MB concentration and reaching the maximum after 20 min. However, the adsorption capacity keeps rising with MB concentration and time using the AC adsorbent. By comparing the performance of both adsorbents, it can be noticed that the adsorption capacity and rate are higher using CP.
Langmuir isotherm model. Fig. 12 shows the Langmuir isotherms of the adsorption of MB by CP and AC particles. The calculated separation factor (RL) values in Table 6 elucidate that the adsorption is favorable in both cases since they lie between 0 and 1.
 | ||
| Fig. 12 Langmuir isotherm plots of the adsorption of MB on CP and AC particles (0.25 g adsorbent, 25 ± 2 °C, 2 hours). | ||
| Adsorbate | Adsorbent | KL | Qm | RL | R2 | Adsorption |
|---|---|---|---|---|---|---|
| MB | CP | 0.031 | 56.81 | 0.997 | 0.752 | Favorable |
| MB | AC | 0.400 | 11.36 | 0.961 | 0.985 | Favorable |
Freundlich isotherm model. The Freundlich isotherms of the adsorption of MB on the CP and AC particles shown in Fig. 13, and their related data and the nF determined values shown in Table 7 indicate that the adsorption was favorable for both solids, especially for CP.
 | ||
| Fig. 13 Freundlich isotherm plots of the adsorption of MB on CP and AC particles (0.25 g adsorbent, 25 ± 2 °C, 2 hours). | ||
| Adsorbate | Adsorbent | KF | nF | R2 |
|---|---|---|---|---|
| MB | CP | 2.070 | 1.266 | 0.9931 |
| MB | AC | 7.379 | 10.99 | 0.9960 |
Furthermore, the correlation coefficients (R2) yielding from the Langmuir (Table 6) and Freundlich (Table 7) isotherm models designate that the Freundlich model is preferred for the adsorption of MB on CP and AC. This can be attributed to the initial sites saturation resulting from stronger adsorption of MB, and then the adsorption strength decreases when the adsorbent's site occupation increases.38
Reusability tests
The use of adsorption in treating wastewater has a significant advantage over the traditional methods since it allows adsorbent regeneration. A reuse study was carried out in this work by exposing the used CP and AC adsorbents (considered as the first use cycle) to 2 different eluents up to 4 reuse cycles; 1 M HCl solution was used in the desorption of heavy metals, and ethanol solvent was implemented for the MB. As illustrated in Fig. 14, the CP loses almost 13% and 9% only of its original adsorption capacity for Cu and Cd ions, respectively, after 3 reuse cycles (4 uses in total). However, it cannot be used more than 2 times to remove MB from water since it loses around 43% of its adsorption capacity starting from the third use. | ||
| Fig. 14 Plots of adsorption capacity of Cu(II), Cd(II), and MB versus no. of uses of CP and AC adsorbents (optimum conditions). | ||
In the case of AC, only 2 reuse cycles are recommended since the adsorbent loses 41 to 75% of its original adsorption capacity for heavy metals after the fourth use. For the MB, similar to the CP results were obtained.
Conclusions
This work highlighted the main characteristics of the low-cost biosorbents, citrus Sinensis fruit peel and its activated carbon, and their potentialities and efficiencies in removing Cu and Cd ions and MB from water. The prepared porous solids, presenting hydroxyl surface groups, showed optimum adsorption for organic and inorganic species using 0.25 g of adsorbent at pH 5 (for metal ions only) and 25 °C. The optimum dosage of the initial adsorbate was 400 mg L−1 for metal ions and 100 mg L−1 for methylene blue with a 2 h contact time needed. In general, in most adsorption studies, the removal process was fast in the early stages, then became slower to reach a maximum. Langmuir and Freundlich's isotherms indicated that the metal ions were adsorbed at a monolayer, covering a concentration range from 20 to 267 mg L−1. In comparison, heterogeneous adsorption was expectedly occurring for the MB molecules covering a concentration range of up to 100 mg L−1. Furthermore, CP showed slightly better adsorption capacity than activated carbon in removing the studied organic and inorganic species. Good reuse performance was exhibited by both adsorbents that can be used up to 2–4 times depending on the nature of the adsorbent and contaminants. Finally, this study positively impacts controlling water contamination, leading to the subsequent assessment of the removal efficiency of the CP and its AC from natural wastewater and industrial effluents treatment.Author contributions
Conceptualization, formal analysis, methodology, and supervision: WEM, AH, MM, and MR; investigation and validation: ZAK and ZY; funding acquisition and project administration: AH and MR; writing and editing: WEM, ZAK, and ZY.Conflicts of interest
There are no conflicts to declare.Acknowledgements
The authors wish to thank the Lebanese University – research program for its financial support.References
- A. Inyinbor, B. Adebesin, A. Oluyori, T. Adelani-Akande, A. Dada and T. Oreofe, Water Pollution: Effects, Prevention, and Climatic Impact, IntechOpen, 2018 Search PubMed.
- H. Ali, E. Khan and I. Ilahi, Environmental Chemistry and Ecotoxicology of Hazardous Heavy Metals: Environmental Persistence, Toxicity, and Bioaccumulation, J. Chem., 2019, 2019, e6730305 Search PubMed.
- B. Lellis, C. Z. Fávaro-Polonio, J. A. Pamphile and J. C. Polonio, Effects of textile dyes on health and the environment and bioremediation potential of living organisms, Biotechnol. Res. Innov., 2019, 3, 275–290 CrossRef.
- T. F. Akinhanmi, E. A. Ofudje, A. I. Adeogun, P. Aina and I. M. Joseph, Orange peel as low-cost adsorbent in the elimination of Cd(II) ion: kinetics, isotherm, thermodynamic and optimization evaluations, Bioresour. Bioprocess., 2020, 7, 34 CrossRef.
- A. Bódalo-Santoyo, J. L. Gómez-Carrasco, E. Gómez-Gómez, F. Máximo-Martín and A. M. Hidalgo-Montesinos, Application of reverse osmosis to reduce pollutants present in industrial wastewater, Desalination, 2003, 155, 101–108 CrossRef.
- N. A. A. Qasem, R. H. Mohammed and D. U. Lawal, Removal of heavy metal ions from wastewater: a comprehensive and critical review, npj Clean Water, 2021, 4, 1–15 CrossRef.
- M. Bilal, I. Ihsanullah, M. Younas and M. Ul Hassan Shah, Recent advances in applications of low-cost adsorbents for the removal of heavy metals from water: a critical review, Sep. Purif. Technol., 2021, 278, 119510 CrossRef.
- S. De Gisi, G. Lofrano, M. Grassi and M. Notarnicola, Characteristics and adsorption capacities of low-cost sorbents for wastewater treatment: a review, Sustainable Mater. Technol., 2016, 9, 10–40 CrossRef CAS.
- N. E. Davila-Guzman, F. J. Cerino-Córdova, M. Loredo-Cancino, J. R. Rangel-Mendez, R. Gómez-González and E. Soto-Regalado, Studies of Adsorption of Heavy Metals onto Spent Coffee Ground: Equilibrium, Regeneration, and Dynamic Performance in a Fixed-Bed Column, Int. J. Chem. Eng., 2016, 2016, e9413879 Search PubMed.
- A. M. Aljeboree, A. F. Alkaim and A. H. Al-Dujaili, Adsorption isotherm, kinetic modeling and thermodynamics of crystal violet dye on coconut husk-based activated carbon, Desalin. Water Treat., 2015, 53, 3656–3667 CrossRef CAS.
- J. Anwar, U. Shafique, W. u. Zaman, M. Salman, A. Dar and S. Anwar, Removal of Pb(II) and Cd(II) from water by adsorption on peels of banana, Bioresour. Technol., 2010, 101, 1752–1755 CrossRef CAS PubMed.
- M. Hossain, Removal of Copper from Water by Adsorption onto Banana Peel as Bioadsorbent, Int. J. GEOMATE, 2012, 2, 227–234 Search PubMed.
- M. Faical, R. Atmani, I. Maghri, M. Elkouali, M. Talbi, M. Bouamrani, M. Salouhi and A. Kenz, Elimination of Methylene Blue Dye with NaturalAdsorbent ≪ Banana Peels Powder ≫, Global Journal of Science Frontier Research B, 2014, 14, 39–44 Search PubMed.
- A. Saeed, M. W. Akhter and M. Iqbal, Removal and recovery of heavy metals from aqueous solution using papaya wood as a new biosorbent, Sep. Purif. Technol., 2005, 45, 25–31 CrossRef CAS.
- H. Çelebi, G. Gök and O. Gök, Adsorption capability of brewed tea waste in waters containing toxic lead(II), cadmium(II), nickel(II), and zinc(II) heavy metal ions, Sci. Rep., 2020, 10, 17570 CrossRef PubMed.
- I. E. Agbozu and F. O. Emoruwa, Batch adsorption of heavy metals (Cu, Pb, Fe, Cr and Cd) from aqueous solutions using coconut husk, Afr. J. Environ. Sci. Technol., 2014, 8, 239–246 CrossRef CAS.
- D. K. Venkata Ramana and K. Min, Activated carbon produced from pigeon peas hulls waste as a low-cost agro-waste adsorbent for Cu(II) and Cd(II) removal, Desalin. Water Treat., 2016, 57, 6967–6980 CrossRef CAS.
- Ü. Geçgel, G. Özcan and G. Ç. Gürpınar, Removal of Methylene Blue from Aqueous Solution by Activated Carbon Prepared from Pea Shells (Pisum sativum), J. Chem., 2012, 2013, e614083 Search PubMed.
- S. Abdulrazak, K. Hussaini and H. M. Sani, Evaluation of removal efficiency of heavy metals by low-cost activated carbon prepared from African palm fruit, Appl. Water Sci., 2017, 7, 3151–3155 CrossRef CAS.
- N. R. Nik Yusoff, S. J. Mohamed Jefry, Y. T. Lai, N. S. Abdul Halim and N. S. Subki, Methylene Blue Removal Using Foxtail Palm Fruits as Potential Activated Carbon, Mater. Sci. Forum, 2020, 1010, 477–482 Search PubMed.
- D. Sud, G. Mahajan and M. P. Kaur, Agricultural waste material as potential adsorbent for sequestering heavy metal ions from aqueous solutions – a review, Bioresour. Technol., 2008, 99, 6017–6027 CrossRef CAS PubMed.
- J. M. J. Favela-Hernández, O. González-Santiago, M. A. Ramírez-Cabrera, P. C. Esquivel-Ferriño and M. D. R. Camacho-Corona, Chemistry and Pharmacology of Citrus sinensis, Molecules, 2016, 21, 247 CrossRef PubMed.
- Y. Liu, E. Heying and S. A. Tanumihardjo, History, Global Distribution, and Nutritional Importance of Citrus Fruits, Compr. Rev. Food Sci. Food Saf., 2012, 11, 530–545 CrossRef CAS.
- M. Thirumavalavan, Y.-L. Lai and J.-F. Lee, Fourier Transform Infrared Spectroscopic Analysis of Fruit Peels before and after the Adsorption of Heavy Metal Ions from Aqueous Solution, J. Chem. Eng. Data, 2011, 56, 2249–2255 CrossRef CAS.
- A. Tomczyk, Z. Sokołowska and P. Boguta, Biochar physicochemical properties: pyrolysis temperature and feedstock kind effects, Rev. Environ. Sci. Biotechnol., 2020, 19, 191–215 CrossRef CAS.
- P. Putnik, D. Bursać Kovačević, A. Režek Jambrak, F. J. Barba, G. Cravotto, A. Binello, J. M. Lorenzo and A. Shpigelman, Innovative “Green” and Novel Strategies for the Extraction of Bioactive Added Value Compounds from Citrus Wastes—A Review, Molecules, 2017, 22, 680 CrossRef PubMed.
- B. Zapata, J. Balmaseda, E. Fregoso-Israel and E. Torres-García, Thermo-kinetics study of orange peel in air, J. Therm. Anal. Calorim., 2009, 98, 309 CrossRef CAS.
- M. Boumediene, H. Benaïssa, B. George, S. Molina and A. Merlin, Characterization of two cellulosic waste materials (orange and almond peels) and their use for the removal of methylene blue from aqueous solutions, Maderas: Cienc. Tecnol., 2015, 17, 69–84 CAS.
- M. E. Fernandez, G. V. Nunell, P. R. Bonelli and A. L. Cukierman, Activated carbon developed from orange peels: batch and dynamic competitive adsorption of basic dyes, Ind. Crops Prod., 2014, 62, 437–445 CrossRef CAS.
- Y. Li, J. Liu, Q. Yuan, H. Tang, F. Yu and X. Lv, A green adsorbent derived from banana peel for highly effective removal of heavy metal ions from water, RSC Adv., 2016, 6, 45041–45048 RSC.
- B. DeMessie, E. Sahle-Demessie and G. A. Sorial, Cleaning Water Contaminated With Heavy Metal Ions Using Pyrolyzed Biochar Adsorbents, Sep. Sci. Technol., 2015, 50, 2448–2457 CAS.
- N. N. N. A. Rahman, M. Shahadat, C. A. Won and F. M. Omar, FTIR study and bioadsorption kinetics of bioadsorbent for the analysis of metal pollutants, RSC Adv., 2014, 4, 58156–58163 RSC.
- G. Annadurai, R. S. Juang and D. J. Lee, Adsorption of heavy metals from water using banana and orange peels, Water Sci. Technol., 2003, 47, 185–190 CrossRef CAS.
- H. Tibolla, F. M. Pelissari and F. C. Menegalli, Cellulose nanofibers produced from banana peel by chemical and enzymatic treatment, LWT–Food Sci. Technol., 2014, 59, 1311–1318 CrossRef CAS.
- M. Iqbal, A. Saeed and I. Kalim, Characterization of Adsorptive Capacity and Investigation of Mechanism of Cu2+, Ni2+ and Zn2+ Adsorption on Mango Peel Waste from Constituted Metal Solution and Genuine Electroplating Effluent, Sep. Sci. Technol., 2009, 44, 3770–3791 CrossRef CAS.
- J. D. Cuppett, S. E. Duncan and A. M. Dietrich, Evaluation of Copper Speciation and Water Quality Factors That Affect Aqueous Copper Tasting Response, Chem. Senses, 2006, 31, 689–697 CrossRef CAS PubMed.
- L. Z. Zapién Serrano, N. O. Ortiz Lara, R. R. Ríos Vera and D. Cholico-González, Removal of Fe(III), Cd(II), and Zn(II) as Hydroxides by Precipitation–Flotation System, Sustainability, 2021, 13, 11913 CrossRef.
- D. Ramutshatsha-Makhwedzha, R. Mbaya and M. L. Mavhungu, Application of Activated Carbon Banana Peel Coated with Al2O3-Chitosan for the Adsorptive Removal of Lead and Cadmium from Wastewater, Materials, 2022, 15, 860 CrossRef CAS PubMed.
| This journal is © The Royal Society of Chemistry 2022 |

