 Open Access Article
In-depth study of bio-oil and biochar production from macroalgae Sargassum sp. via slow pyrolysis†
Obie Farobie *ab,
Apip Amrullahc,
Asep Bayud,
Novi Syaftikae,
Latifa Aisya Anisb and
Edy Hartulistiyosoab
aDepartment of Mechanical and Biosystem Engineering, Faculty of Agricultural Engineering and Technology, IPB University (Bogor Agricultural University), IPB Darmaga Campus, Bogor, West Java 16002, Indonesia. E-mail: obiefarobie@apps.ipb.ac.id
bSurfactant and Bioenergy Research Center (SBRC), IPB University (Bogor Agricultural University), Jl. Pajajaran No. 1, IPB Baranangsiang Campus, Bogor, West Java 16144, Indonesia
cDepartment of Mechanical Engineering, Lambung Mangkurat University, Banjarmasin, South Kalimantan, Indonesia
dResearch Center for Biotechnology, Research Organization for Life Sciences, National Research and Innovation Agency (BRIN), Jl. Raya Jakarta-Bogor KM 46 Cibinong, Bogor, West Java 16911, Indonesia
eCenter for Energy Resource and Chemical Industry Technology, Research Organization for Assessment and Application of Technology, National Research and Innovation Agency (BRIN), Kawasan PUSPITEK Serpong, Tangerang Selatan, Indonesia
First published on 28th March 2022
Abstract
Sargassum is undoubtedly one of the most predominant brown macroalgae, posing a significant disposal problem for coastal areas worldwide. The effective valorization of Sargassum sp. would be beneficial not only for environmental mitigation but also for producing high-value chemicals. However, the valorization of Sargassum sp. for bio-oil and biochar production via slow pyrolysis has not been well studied yet. Hence, this study aimed to conduct a comprehensive investigation into bio-oil and biochar production from Sargassum sp. via slow pyrolysis to provide valuable data for further valorization. A batch reactor was employed, and the pyrolysis of Sargassum sp. was conducted in a temperature range of 400–600 °C and with retention times of 10–50 min. The results showed significant compounds could be identified in bio-oil from Sargassum sp., including carboxylic acids, furan derivatives, aliphatic hydrocarbons, and N-aromatic compounds. Based on the ultimate analysis, the H/C and O/C atomic ratios of biochar were lower than the feedstock, reflecting the occurrence of dehydration and decarboxylation reactions throughout the pyrolysis. Biochar exhibited calorific values in the range of 23.12–25.89 MJ kg−1, indicating it has more potential to be used as a solid fuel than low-ranked coals. Surface morphological analysis was performed by scanning electron microscopy (SEM) and showed a larger surface area in biochar than in the algal feedstock. Furthermore, a reaction model was deduced, and it was confirmed that the pyrolysis reaction obeyed the Arrhenius behaviour. Overall, the slow pyrolysis of Sargassum sp. provides an opportunity to obtain value-added chemicals and biochars, which could be further utilized for other applications.
Introduction
Our planet faces unprecedented challenges due to the rapid population growth and global development, which implies a growing energy demand. Currently, the primary energy sources used for daily life are derived chiefly from petroleum-based fossil fuels.1 The massive consumption of petroleum fuels is exhausting these energy sources and causing environmental problems due to the augmented emissions of pollutants from burning these fuels (SO2, NOx, and CO2). Even though several severe environmental challenges have been reported due to the extensive consumption of petroleum fuels, their use still serves as the most attractive and viable source for transportation fuel.2 However, the endless consumption of fossil fuels will lead to the eventual exhaustion of petroleum sources after 2042 worldwide even without considering the projected growth of petroleum fuel consumption.3Several attempts are currently underway to mitigate the energy crisis and control pollutant emissions to search for eco-friendly energy sources for future generations. One of the most promising and environmentally friendly alternative energy sources is biomass since it is abundantly available, renewable, and is considered CO2 neutral.4 Moreover, biomass ranks fourth as the most significant energy resource after coal, oil, and natural gas.5 In terms of its source and utilization, biomass is categorized into four classifications: first -, second-, third, and fourth-generation. Several ways have evolved to produce biomass energy, including biochemical and thermochemical conversions. Although the biochemical conversion of biomass is less energy-intensive than the thermochemical process, the biochemical route is not cost-effective since it solely needs cellulose and hemicellulose in biomass.6 The thermochemical route of biomass into energy is considered favourable due to its more efficient and cost-effective process.7 The thermochemical route of biomass into energy can be performed by liquefaction,8,9 gasification,10–13 and pyrolysis.14,15 Among the thermochemical processes, the most common method for biomass conversion into valuable chemicals and biofuels is pyrolysis owing to its energy-efficient and economical nature.16 Basically, pyrolysis is conducted under an inert atmosphere at 300–600 °C, generating bio-oil, biochar, and syngas.
Recently, extensive research has been carried out to produce bio-oil and biochar from biomass through pyrolysis, showing that biofuels can be generated from first- and second-generation biomass, such as palm,17 rice straw,18 corn stover,19 and sugarcane bagasse.20 Yet, the massive use of first-generation biofuel feedstock may lead to competition between food and fuel, consequently increasing food prices.21 Additionally, even though second-generation biomass does not compete with food, fresh water, fertilizer, and arable land are still required to produce biomass. To address this issue, third-generation biomass, such as macroalgae, have prospects to be used as feedstock for biofuels production. In fact, macroalgae have several advantages, including a faster growth rate, higher biomass yield, and shorter harvesting cycles than terrestrial plants.1 Moreover, macroalgae are able to grow in seawater, freshwater, and wastewater.22
Among several species of macroalgae, the brown macroalgae Sargassum sp. is considered one of the most promising feedstocks for biofuels generation since it contains significant biomass resources and is globally abundant.23 Sargassum typically contains a significant amount of carbohydrate (40–66% dry weight), followed by proteins (10–13%) and lipids (0.8–1.6%).24 However, this biomass possesses a problem due to its unusual bloom and eutrophication in tropical seashores.25 It has been reported that Sargassum can release large amounts of toxic gases, such as ammonia and hydrogen sulphide, raising human health concerns.26 Furthermore, Sargassum decomposition results in the mortality of marine biota, including neritic fish and crustacea.27 In this sense, valorizing Sargassum sp. as a third-generation biomass can offer a promising solution to solve the drawbacks of utilizing first- and second-generation biomass while overcoming marine pollution problems at the same.
In the context of the pyrolysis process, few studies regarding bio-oil production from Sargassum sp. have been reported.28–30 Biswas et al.28 found that the yield of a liquid product as high as 43.4% could be achieved at 450 °C. Furthermore, Cao et al.29 reported that ZSM-5 could remarkably suppress the contents of N-containing and organic acid compounds, thus improving the algal bio-oil quality. Recently, Li et al.30 performed the fast-pyrolysis of Sargassum horneri at 700–900 °C. Their results showed that the most prominent content in the liquid products of S. horneri pyrolysis was the N-containing compounds (up to 38.5%), which was a significant contrast with the liquid products from the pyrolysis of terrestrial plants.
Nevertheless, most of the previous studies only focused on the characteristics of bio-oil. A comprehensive study not only focusing on bio-oil but also biochar is thus necessary since biochar has great potential as a carbon material for energy storage, catalysis, wastewater treatment, supercapacitors, and microbial fuel cell electrodes.31 Hence, the novelty of this study is emphasized as follows: (1) performing a comprehensive study for bio-oil and biochar production from Sargassum sp., including their characteristics that have not been reported previously and (2) providing the detailed reaction pathway for the conversion of Sargassum sp. into high-value compounds identified in bio-oil. This study thoroughly investigated the slow pyrolysis of Sargassum sp. for bio-oil and biochar production. More specifically, the objectives of this study were: (1) to examine the temperature effect on the product distribution of Sargassum sp.'s pyrolysis, (2) to investigate the effect of temperature on the chemical composition identified in bio-oil from the slow pyrolysis of Sargassum sp., (3) to study the characteristics of biochar, and (4) to determine the reaction kinetics of the slow pyrolysis of Sargassum sp.
Experimental
Feedstock preparation and analysis
The feedstocks of Sargassum sp. were collected from Ekas beach, Lombok Island, Indonesia. The samples were cleaned from sand/debris using tap water and deionized water. Afterwards, the cleaned samples were dried in an oven at 105 °C for 24 h. The dried macroalgae were subsequently ground and sieved to achieve a particle size of 0.25 mm.Proximate analysis of the sample was determined using a thermogravimetric analyzer TGA 4000 (PerkinElmer, United States) following ASTM E1131-08. The mass loss determined the moisture content of the feedstock after the sample was heated at 110 °C using N2 as a carrier gas. Meanwhile, the mass loss determined the volatile matter after the sample was heated to 900 °C. Afterwards, the N2 was switched with air. The final amount of the sample remaining after being kept isothermally at 900 °C for 45 min was recorded as the ash content. The fixed carbon (FC) value was determined using the following formula:
| FC (wt%) = 100 – (volatile matter wt% + moisture wt% + ash wt%). |
Higher heating values (HHV) of feedstock were calculated using a bomb-calorimeter (Parr 6200 Isoperibol) according to ASTM D 5865-04. Furthermore, ultimate analysis of the carbon (C), hydrogen (H), and nitrogen (N) was determined using a CHN628 analyzer (Leco). Meanwhile, sulfur (S) analysis was carried out using a CHN632 analyzer (Leco). The oxygen (O) content was calculated using the formula as follows, O (%) = 100 – (%C + %H + %N + %S). All the analyses were conducted at least three times to obtain the reproducible data. Furthermore, the chemical constituents of the dried Sargassum sp. were analyzed by PT. Saraswanti Indo Genetech (SIG)-Bogor, a laboratory service in Indonesia accredited to ISO/IEC 17025. The chemical constituent, proximate, and ultimate analyses of Sargassum sp. are summarized in Table S1.†
Pyrolysis of Sargassum sp.
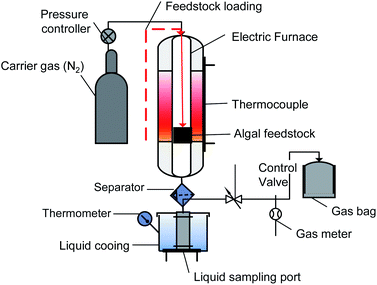
The macroalgae Sargassum sp. was pyrolyzed in a batch reactor made of stainless steel (Fig. 1). The apparatus consisted of an electric furnace, thermocouple, a condenser, and a temperature controller. The thermocouple was installed to measure the actual temperature inside the reactor. This reactor allowed a maximum operating temperature up to 1000 °C to be regulated using a proportional integral derivative (PID) temperature controller. Briefly, 50 g of dried sample was placed in the reactor and purged with N2 three times at a flow rate of 100 mL min−1 to ensure an oxygen-free atmosphere. The reactor was then heated at a heating rate of 30 °C min−1 from ambient temperature to the final temperature (400 °C, 500 °C, and 600 °C). The reactor was maintained at the final temperature for 10, 30, and 50 min. The vapour-phase products produced during the pyrolysis were condensed and collected in a liquid sampling port. The biochar was weighed via gravimetry and stored in a ziplock plastic bag for further analysis. All the experiments were conducted in duplicate to ensure reproducibility. The following equations were employed for the calculation of the yields of the products.
 | (1) |
 | (2) |
| Gas yield (%) = 100 + (Ybio-oil + Ybio-char) | (3) |
Characterization of the bio-oil and biochar
A gas chromatography/mass spectrometry (GC/MS-QP2010 SE–Shimadzu, Japan) system equipped with an Rtx®-5MS capillary column was used to characterize the bio-oil. The details of the bio-oil analysis using GC/MS have been reported in our previous studies.32,33 Determination of the compounds in the bio-oil was conducted by comparing with the recorded mass spectra provided in the NIST2008 c2.0/Xcalibur data library.Biochars obtained from the pyrolysis of Sargassum sp. were characterized by elemental (C, H, N, S) analysis, Fourier transform infrared spectroscopy (FTIR), scanning electron microscopy (SEM), and Brunauer–Emmett–Teller (BET) porosimetry. The biochar products' elemental composition (C, H, N, S, O) was determined with the same methods used for the feedstock. FTIR analysis was conducted using an infrared spectrometer Spectrum Two Universal ATR–FT-IR (PerkinElmer, United States) to evaluate the appearance of functional groups in the biochar. FTIR analysis was conducted in the 400–4000 cm−1 wavelength. The biochar morphology was also examined by SEM (Hitachi, SU 3500), operated using an electron acceleration of 20 kV. The images were captured at magnifications of 1000 and 2500×. The surface area, total pore volume, and mean pore diameter of the macroalgal biochar were characterized using a BET surface area and pore size analyzer with nitrogen adsorption at 77 K (Quantachrome Nova 4200e).
Results and discussion
Effect of temperature on the product distribution
To investigate the temperature effect on the product distribution during the pyrolysis of Sargassum sp. in more detail, the pyrolysis was performed in the temperature range of 400–600 °C. It was observed that the biochar yield remarkably decreased with the increase in pyrolysis temperature from 400 °C to 600 °C (Fig. 2). This could be explained as due to the more significant primary decomposition of macroalgae biomass at higher temperatures. It is worth noting that the yield of bio-oil increased as the temperature increased from 400 °C to 500 °C, but the bio-oil yield decreased once the temperature increased further to 600 °C. The increase in bio-oil yield as the pyrolysis temperature increased from 400 °C to 500 °C could be attributed to an increase in the primary decomposition reactions of the algal biomass, such as from dehydration and thermal cracking. Meanwhile, the decrease in bio-oil yield as the pyrolysis temperature increased further to 600 °C was due to the further cracking of the products at a temperature above 500 °C, generating non-condensable gases, such as CH4, CO, and CO2, as reported in the previous study.34,35 This was supported by the fact that the gas yield significantly increased with increasing the temperature from 400 °C to 600 °C. The enhancement of the gas yield might also be due to the high presence of alkali and alkaline earth metal species in the Sargassum sp. biomass, as indicated by the EDX analysis results (Fig. 3). The presence of these metals, such as potassium and calcium, enhanced the carbonaceous materials degradation, tar decomposition, and char reforming during pyrolysis and gasification to the gas product.36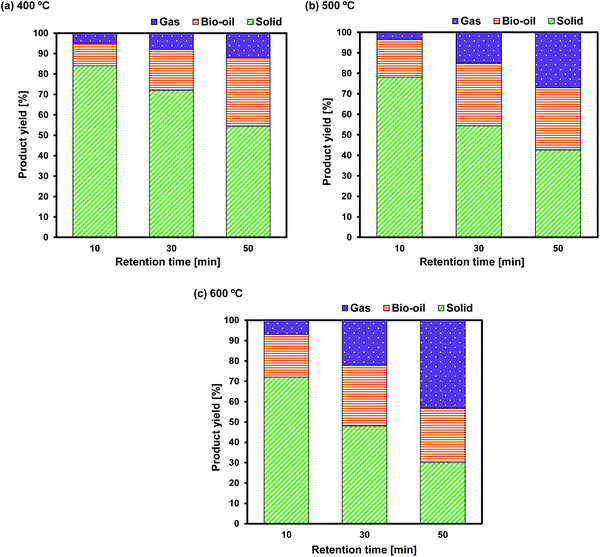 | ||
| Fig. 2 Effect of temperature and retention time on the product distributions of Sargasssum sp. pyrolysis at (a) 400 °C; (b) 500 °C, and (c) 600 °C. | ||
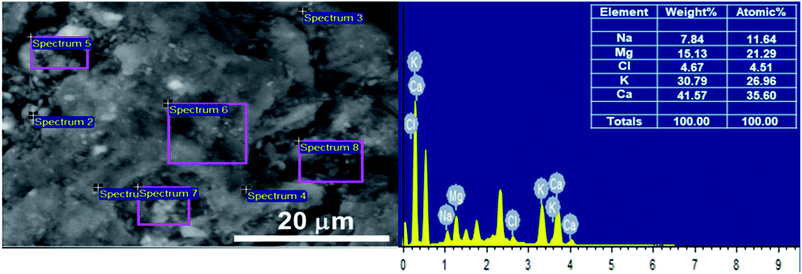 | ||
| Fig. 3 Scanning electron microscopy - energy dispersive X-ray (SEM-EDX) analysis of the dried biomass of Sargassum sp. | ||
At the lowest temperature of 400 °C, the bio-oil yields were relatively low. At this temperature, the bio-oil yield was merely 11.05% after a retention time of 10 min, reflecting the incomplete pyrolysis of Sargassum sp. The bio-oil yields increased to around 20.57% and 28.28% when the retention times were prolonged to 30 and 50 min, respectively, due to the significant occurrence of thermal cracking and dehydration reactions. As a result, these increased the liquid product yield. Additionally, the biochar yields significantly decreased with the retention time, demonstrating the evident decomposition of the algal biomass owing to the cracking of heavy hydrocarbons at the longer retention time. This finding was supported by the previous work of Choi et al.,37 who observed that prolonging the holding time during the pyrolysis of Saccharina japonica could increase the bio-oil yield, but it decreased the biochar yield.
At 500 °C, the conversion of algal biomass to bio-oil was higher than that at 400 °C. Bio-oil yields of approximately 18.46%, 29.86%, and 30.42% were obtained after 10, 30, and 50 min retention times, respectively. On the other hand, at a higher temperature of 600 °C, the longer retention time from 30 to 50 min did not significantly increase the bio-oil.
Overall, the increase in temperature from 400 °C to 600 °C accelerated the decrease in biochar yield and increase in gas products due to the further degradation of the biochar and secondary reactions of the volatile vapours. The results of this finding follow the previous studies.35,37 Choi et al.37 investigated the effect of temperature on the product distribution of Saccharina japonica pyrolysis in the temperature range of 430–530 °C. They observed that the biochar yield chiefly declined from 34.50 to 25.5 wt% when the temperature was increased from 430 °C to 530 °C. Meanwhile, the yield of gas steadily rose from 20.30 to 27.2 wt%. They also noticed that the pyrolysis temperature and heat transfer affected the product yield distribution. In another study by Aboulkas et al.,35 the biochar yield from the pyrolysis of algal waste was found to significantly decrease from 52.09 to 40.36 wt% with the increase in temperature from 400 °C to 600 °C. The researchers in that study presumed that the decline in biochar yield might be due to either the more considerable decomposition of feedstock or the further thermal cracking of the biochar.
Characteristics of bio-oil
GC/MS analysis was conducted to determine the composition of bio-oil, in which the peak area percentage of the detected compounds is related to the response factor. The typical GC/MS spectra of Sargassum's bio-oil is presented in Fig. S1.† As observed, the bio-oil product from the pyrolysis of Sargassum sp. exhibited a diverse mixture of compounds. It is worth noting that the bio-oil products derived from the slow pyrolysis of Sargassum sp. were primarily composed of aliphatic hydrocarbon, organic acids, amide, N-aromatic compounds, phenolics, and ketones.To investigate its variability within the pyrolysis temperature, the peak area percentage of some compounds was used for comparison purposes. Only the main compounds with an area percentage higher than 0.5% were considered in this study. The results for the compounds identified in Sargassum sp. bio-oil at different temperatures are presented in Table S2.† At 400 °C, the three most abundant compounds observed from GC/MS were propionic acid (20.28%), acetic acid (11.26%), and 5-hydroxymethylfurfural/5-HMF (11.01). The formation of propionic and acetic acids has been linked to the thermal decomposition of lipids.34 Meanwhile, 5-HMF formation is derived from the decomposition of cellulose.38 The formation of propionic acid decreased while the acetic acid content steadily increased when the temperature was increased from 400 °C to 500 °C. This could be due to the decomposition of lipids, or long-chain carboxylic acid-generating short-chain carboxylic acid, which was enhanced with the rise in the pyrolysis temperature. It is worth noting that the formation of 5-HMF increased from 11.01% to 13.94% with increasing the temperature from 400 °C to 500 °C. This result could indicate that cellulose degradation to 5-HMF through the dehydration reaction is favourable at a temperature above 400 °C.39 At the highest temperature of 600 °C, besides organic acids, a considerable amount of phenol was also observed. The formation of phenol might be derived from the interaction of the aromatic compound with steam/moisture during the pyrolysis of biomass.38
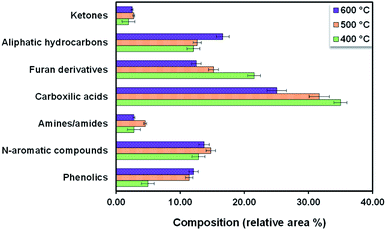
Based on the composition observed at different temperatures as shown in Table S2,† the chemical composition in Sargassum sp. bio-oil was as follows: carboxylic acids, furan derivatives, aliphatic hydrocarbons, N-aromatic compounds, phenolics, amines/amides, and ketones (Fig. 4). The major compounds were carboxylic acid with a 25–35 area%. The formation of short-chain carboxylic acids has been linked to the cracking of lipids. The result of this study is in line with the previous finding of Iaccarino et al.,34 who observed that carboxylic acids were predominantly found in bio-oil from the pyrolysis of Salicornia bigelovii. It should be noted that the selectivity trend of carboxylic acids in the bio-oil decreased with the increase in the pyrolysis temperature, as follows: 35.01% (400 °C) > 31.68% (500 °C) > 25.07% (600 °C). This trend may be due to thermal cracking and the decarboxylation of organic acids generating short-chain aliphatic hydrocarbons with the increase in pyrolysis reaction. In fact, the trend of aliphatic hydrocarbons increased with the increase in pyrolysis temperature.
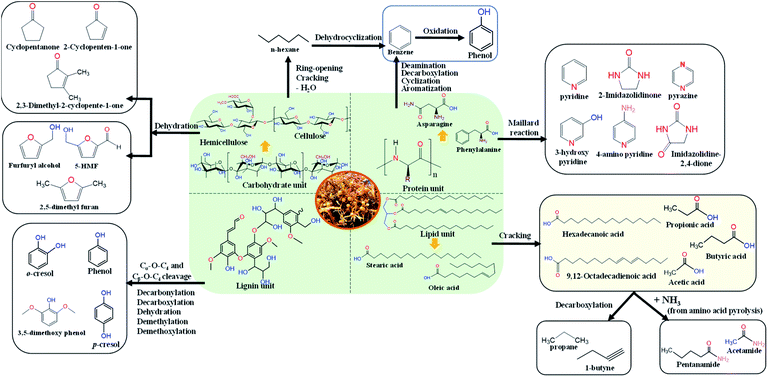
It is worth noting that fatty acid derivatives, such as n-hexadecanoic acid and 9,12-octadecadienoic acid, were also observed in small amounts during the pyrolysis of Sargassum sp. at 400 °C. The finding of this study follows the previous finding of Hong et al.,40 who reported that macroalgae pyrolysis could generate n-hexadecanoic acid in small quantities. However, these compounds could not be observed at a temperature above 500 °C. As the temperature increased, n-hexadecanoic acid and 9,12-octadecadienoic acid were thermally decomposed into short-chain organic acids or aliphatic hydrocarbons. Fig. 5 shows the plausible reaction pathways from the slow pyrolysis of Sargassum sp.
Bio-oil derived from the pyrolysis of Sargassum sp. resulted in high amounts of furan derivatives, such as furfuryl alcohol and 5-HMF. Furan derivatives are generally obtained in the pyrolysis of glucose-based carbohydrates and seaweed polysaccharides.39,41 Zhou et al.42 reported that furan derivates might be derived from several steps of dehydration and ring-opening reactions of xylose. Another possibility for furan generation is via a concerted electrocyclic reaction followed by multiple steps of dehydration and cyclization. In this study, it was noticed that the selectivity of furan derivatives in the bio-oil decreased with the increase in temperature following the trend: 21.53% (400 °C) > 15.21% (500 °C) > 12.51% (600 °C). This trend could be attributed to the ring-opening and cracking of furan derivates to generate the hydrocarbons being enhanced with the increase in the temperature.
It is worth mentioning that the pyrolysis of Sargassum sp. displayed a higher amount of N-aromatic compounds (12.86–14.78%) than that of other terrestrial lignocellulosic biomasses.43–45 This could be due to the macroalgae having a higher protein content than terrestrial lignocellulosic biomass.1 The formation of N-aromatic compounds is commonly derived from protein decomposition into amino acids at high pyrolysis temperatures, followed by the cyclization and aromatization reactions of amino acids. Another possibility is the reaction of the amino acids and carbohydrates through the Maillard reaction, which can further decompose to generate N-aromatic compounds.46 The main component of N-aromatic compounds observed in this study was heterocyclic derivatives, such as pyrazine, pyridine, 3-hydroxy pyridine, 2-imidazolidinone, and 4-aminopyridine. The finding of this study follows the previous research by Iaccarino et al.,34 who reported that amino acids could undergo decarboxylation, cyclization, and dehydration to generate the N-heterocyclic derivatives during the pyrolysis of Salicornia bigelovii.
Phenolic compounds in the bio-oil from Sargassum sp. pyrolysis were present in a few amounts. Selectivities of phenolic compounds of 4.96%, 11.41%, and 12.10% were observed at 400 °C, 500 °C, and 600 °C, respectively. This contrasts with the pyrolysis of terrestrial lignocellulosic biomass, where phenolic compounds are produced in abundance (28.1–65.56%).47,48 This difference could be attributed to the lignin content in macroalgae being lower than that in terrestrial plant biomass. The formation of phenolic derivatives also has been linked to the thermal decomposition of proteins, especially protein-containing phenylalanine.35 The phenolic compounds may also be derived from the interaction of moisture with aromatic compounds, as reported by Gautam et al.38 and some phytochemical metabolites in Sargassum sp. It should be noted that brown macroalgae, like Sargassum sp., are rich in phenolic secondary metabolites, such as tannins, flavonoids, and phenols, which function as their chemical defence towards UV sunlight exposure.49
The major hydrocarbons observed in the bio-oil from Sargassum sp were propane and 1-butyne. These aliphatic hydrocarbons were mainly generated from organic acids' cracking and decarboxylation reactions. The selectivity of aliphatic hydrocarbons in the bio-oil increased with the temperature following the trend: 12.08% (400 °C) < 12.65% (500 °C) < 16.65% (600 °C). The aliphatic hydrocarbons could be generated from the ring-opening, cracking, and dehydration of cellulose, as reported by Iaccarino et al.34 Macroalga Sargassum sp. also produces a trace amount of amine/amide compounds, such as butylamine, acetamide, and pentanamide. The formation of amine derivatives has been primarily linked to the decarboxylation and decomposition of amino acids. Meanwhile, the amide compounds were plausibly derived from the reaction of organic acids and the ammonium produced from the decomposition of amino acids during pyrolysis. Moreover, the main ketones found in the Sargassum sp. bio-oil were cyclopentanone, 2-cyclopentene-1-one, and 2,3-dimethyl-2-cyclopentene-1-one. The formation of ketones mainly occurs as typical pyrolysis products of cellulose and hemicellulose decomposition, which have been reported in the literature.50,51
Characteristics of biochar
Biochar obtained was analyzed in terms of elemental composition, FTIR, and SEM to better understand the pyrolysis behaviour of Sargassum sp.Elemental composition
Table 1 displays the calorific value and ultimate analysis of Sargassum sp. biochar obtained at 400 °C, 500 °C, and 600 °C. The value of the feedstock is presented here for comparison purposes. The biochars obtained from the pyrolysis of Sargassum sp. had a high carbon content (51.28–54.01%), low hydrogen content (2.89–3.05%), and moderate oxygen content (39.48–41.82%). As presented in Table 1, the biochar had a higher C content than the macroalgal feedstock. In addition, the C content in the biochar increased with temperature. Meanwhile, the biochar's O and H contents were lower than the feedstock, which may be due to the dehydration, decarboxylation, and decarbonylation reactions during the pyrolysis. In contrast, the hydrogen value in the biochar relatively decreased with temperature following the trend: 3.05% (400 °C) > 2.99% (500 °C) > 2.89% (600 °C). Furthermore, the trend for the oxygen content of the biochar also declined with temperature.| Sample | Ultimate analysis (wt%, dry ash-free) | HHV (MJ kg−1) | ||||
|---|---|---|---|---|---|---|
| % C | % H | % N | % S | % O | ||
| Feedstock | 42.40 ± 0.38 | 5.86 ± 0.03 | 2.72 ± 0.01 | 2.78 ± 0.05 | 46.24 ± 0.30 | 14.46 ± 0.08 |
| Biochar (400 °C) | 51.28 ± 0.06 | 3.05 ± 0.06 | 1.38 ± 0.02 | 2.48 ± 0.06 | 41.82 ± 0.04 | 23.12 ± 0.06 |
| Biochar (500 °C) | 52.58 ± 0.06 | 2.99 ± 0.04 | 1.32 ± 0.01 | 2.45 ± 0.03 | 40.65 ± 0.04 | 24.12 ± 0.09 |
| Biochar (600 °C) | 54.01 ± 1.12 | 2.89 ± 0.07 | 1.24 ± 0.03 | 2.38 ± 0.04 | 39.48 ± 0.90 | 25.89 ± 0.10 |
| Low-rank coal-lignite52 | 58.78 | 4.9–7.0 | 0.6–2.4 | 0.3–6.0 | 12–30 | 12.00–25.0053 |
The reduction of hydrogen and oxygen might be because the dehydration and deoxygenation reactions were enhanced with the increase in temperature. The low hydrogen content of biochar was also possibly due to the aromatization and formation of hydrogen gas (H2) as a result of the generation of the low-molecular-weight hydrocarbons (CH4, C2H6, or C2H4).35 It should be noted that the nitrogen content of biochar derived from macroalgal pyrolysis decreased with the increasing pyrolysis temperature. This may be because nitrogen is released in the gas phase as the pyrolysis temperature increases. It is intriguing to mention that the HHV of biochar from the macroalgal pyrolysis was in the range of 23.12–25.89 MJ kg−1, which is relatively higher than those of the low-ranked coals (12–25 MJ kg−1, although the typical value is ∼15 MJ kg−1).53 The high calorific values and carbon content indicate macroalgal biochar has potential to be utilized as a solid renewable fuel. Furthermore, the ultimate analysis of low-rank coal-lignite is also presented in Table 1 for comparison purposes. The ultimate analysis of macroalgal biochar is comparable with the low-rank coal-lignite. The sulfur content of low-rank coal-lignite varies from 0.3% to 6.0%, depending on the location and geological processes.52 Solid fuels with a low sulfur content are more environmentally friendly since the oxidation product of sulfur can cause corrosion and pollution.
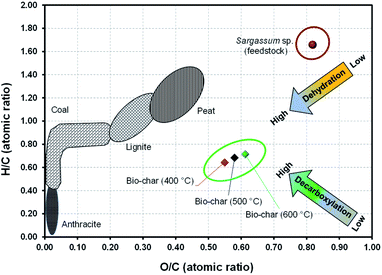
The critical parameters to assess the characteristics of biomass for energy application besides the HHV are the atomic ratios of O/C and H/C. According to Zhao et al.,54 C–O and C–H bonds contain lower chemical energies than C–C; hence, biomass having lesser atomic ratios of O/C and H/C mainly contains a higher energy content. The evolution of O/C and H/C atomic ratios from the pyrolysis of Sargassum sp. by the Van Krevelen diagram is presented in Fig. 6. It should be noted that the O/C and H/C atomic ratios of biochar were lower than that of the feedstock, confirming that dehydration and decarboxylation reactions occurred throughout the pyrolysis. The H/C atomic ratio of macroalgal feedstock significantly decreased from 1.66 to 0.71, 0.75, and 0.79 for the pyrolysis temperatures of 400 °C, 500 °C, and 600 °C, respectively. Likewise, the O/C atomic ratio of macroalgal feedstock also decreased from 0.82 to 0.62, 0.58, and 0.54 for the pyrolysis temperatures of 400 °C, 500 °C, and 600 °C, respectively. Zhou et al.55 presumed that the decrease in the bond energies of C–H and C–O and the increase in bond energy of C–C could enhance the energy content of biochar. In fact, the calorific values of biochar obtained from the Sargassum sp. pyrolysis were higher than those of the feedstock. Moreover, Gasco et al.56 pointed out that low O/C and H/C atomic ratios indicated a high carbon stability and high aromatic derivatives.
FTIR characterization
FTIR analysis was used to characterize the functional groups in the biochar obtained from the Sargassum sp. pyrolysis. The FTIR spectra of biochar at different temperatures are shown in Fig. 7. The details of the typical band assignment of biochar at different temperatures are presented in Table S3.† It is intriguing to note that the peak at 3600–3100 cm−1 (O–H stretching vibration) was absent in the FTIR spectra, confirming the dehydration reaction during the pyrolysis. Small bands of aliphatic C–H stretching at 2815–2860 cm−1 were observed. However, this band disappeared when the temperature was increased from 400 °C to 600 °C. This may be due to C–H alkyl groups' cracking at high pyrolysis temperatures. The band at 1625 cm−1 was assigned to the aromatic C![[double bond, length as m-dash]](https://www.rsc.org/images/entities/char_e001.gif) C ring stretching. Meanwhile, the medium peak at 1422 cm−1 indicated the aliphatic C–H bending. The strong peaks 1095–1098 cm−1 were correlated to stretching vibrations from the aromatic C–H group. These peaks indicated that the biochar contained aromatic compounds. Moreover, a few peaks at 873 cm−1 were observed, which were closely linked to the existence of polycyclic aromatic hydrocarbons (PAHs), which could be generated throughout the pyrolysis of typical biomass.34 The trend in the FTIR spectra observed in this study followed the trend observed in a previous study by Aboulkas et al.35 They reported that the biochar derived from algal waste pyrolysis displayed peaks for C–H stretching (2852–2960 cm−1), C
C ring stretching. Meanwhile, the medium peak at 1422 cm−1 indicated the aliphatic C–H bending. The strong peaks 1095–1098 cm−1 were correlated to stretching vibrations from the aromatic C–H group. These peaks indicated that the biochar contained aromatic compounds. Moreover, a few peaks at 873 cm−1 were observed, which were closely linked to the existence of polycyclic aromatic hydrocarbons (PAHs), which could be generated throughout the pyrolysis of typical biomass.34 The trend in the FTIR spectra observed in this study followed the trend observed in a previous study by Aboulkas et al.35 They reported that the biochar derived from algal waste pyrolysis displayed peaks for C–H stretching (2852–2960 cm−1), C![[double bond, length as m-dash]](https://www.rsc.org/images/entities/char_e001.gif) C stretching (1656 cm−1), and heteroatom functional groups (1730–1150 cm−1).
C stretching (1656 cm−1), and heteroatom functional groups (1730–1150 cm−1).
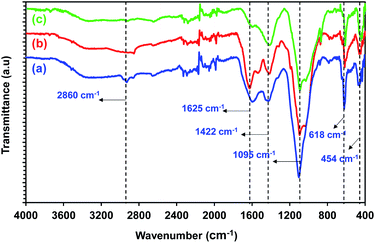 | ||
| Fig. 7 FTIR spectra of the biochar from Sargassum sp. pyrolysis at (a) 400 °C, (b) 500 °C, and (c) 600 °C. | ||
Overall, the FTIR spectra of biochar from the pyrolysis of Sargassum sp. indicated the presence of aromatic compounds. This could be attributed to the fact that biochar comprised polycyclic aromatic compounds.35 The results from the FTIR spectra were in good agreement with the ultimate analysis, which confirmed the high carbon content in the biochar.
Scanning electron microscopy
SEM was used to investigate the surface morphology of the macroalgal feedstock and its biochar. Fig. 8 depicts a comparison of the SEM photographs for the feedstock and its biochar derived from the Sargassum sp. pyrolysis at different pyrolysis temperatures. It was clearly shown that the macroalgal feedstock displayed different characteristics to its biochar in terms of its morphologies. Interestingly, the surface morphology of the biochar had a higher porosity than the macroalgal feedstock. This may be because the high pyrolysis temperature could deform the surface of Sargassum sp., leading to a higher porous structure of the biochar. The morphological structures of several kinds of biomass-derived biochars were comprehensively reviewed by Leng et al.57 However, macroalgal biochar was not taken into account in that study. This might have been because the investigation of biochar from macroalgae is still rarely performed. They summarized that lignocellulosic biomass (sugar cane and Durian wood sawdust)-based biochars are more porous than those derived from microalgae C. vulgaris and sewage sludge. The morphological structure of macroalgae Sargassum-derived biochar obtained from this study was comparable with that of C. vulgaris. However, the morphological structure of macroalgal biochar was more porous than that of the microalgal biochar. This could be attributed to the macroalgae having a higher carbohydrate content than microalgae.1 The details of Sargassum sp.'s pore size and its biochar are presented in Fig. S2.† Moreover, the BET surface area, total pore volume, and mean pore diameter of the macroalgal biochar are summarized in Table S4.† The BET surface area of Sargassum sp. biochar was in the range 4.28–5.68 m2 g−1. In addition, the mean pore diameter of the macroalgal biochar was in the range 10.83–12.20 nm, confirming that the biochar derived from Sargassum sp. could be classified as a mesoporous material. The BET surface area of the macroalgal biochar was significantly lower than that of biochar from pigeon pea stalk (16.90 to 261.78 m2 g−1).58 This could be attributed to the lower lignin content in macroalgal biomass than in terrestrial plant biomass. Having said that, the BET surface area from this study was comparable with the previous work of Iaccarino et al.,34 who observed that the surface area of biochar from Salicornia bigelovii was in the range 1.30–2.35 m2 g−1. Furthermore, it could be confirmed from this study that an increase in the pyrolysis temperature led to an increase in the BET surface area and total pore volume, which could be because more volatile matter and pore-blocking substances from the biomass matrix were released, resulting in more pores in the biochar. After all, this result provides insights for future research in developing renewable porous carbon-based materials from macroalgae Sargassum sp. for the applications as adsorbents and catalysts, and in wastewater treatment and energy storage.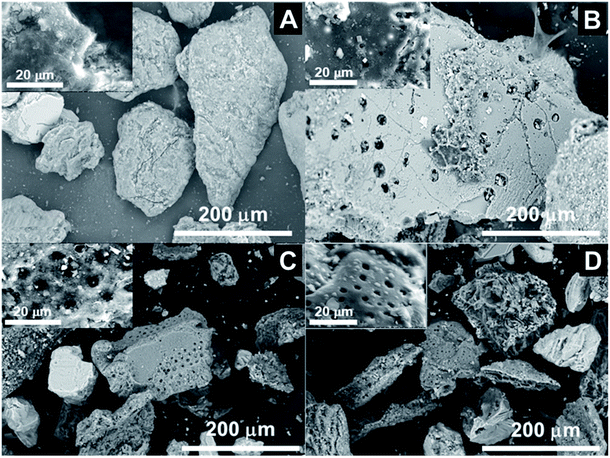 | ||
| Fig. 8 SEM images of (A) untreated Sargassum sp.; (B) biochar at 400 °C; (C) biochar at 500 °C; and (D) biochar at 600 °C. | ||
Kinetic modelling of macroalgae pyrolysis
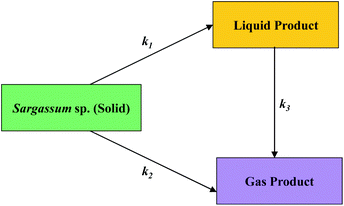
The kinetics of macroalgal pyrolysis were determined to quantify the effect of temperature on the product distribution. A kinetic model was determined based on the solid, liquid, and gas yields. The mechanism of decomposition of the macroalgae during pyrolysis is depicted in Fig. 9. The feedstock (solid) was immediately decomposed into a liquid (k1). Meanwhile, some solid feedstocks were converted to the gaseous products (k2). In either way, the liquid product was also changed to produce gas (k3).Based on the reaction pathways above, the rate of change in the product yield could be manifested by the equations of the differential rate as follows:
| dY (solid)/dt = (k1 + k2)Y (solid) | (4) |
| dY (liquid)/dt = (k1Y) (solid) − (k3Y) (liquid) | (5) |
| dY (gas)/dt = (k2Y) (solid) + (k3Y) (liquid) | (6) |
Non-linear regression was employed to determine the reaction rate constants. In this study, the least-squares-error (LSE) method was employed. Fig. 10(a)–(c) show the comparisons of the experimental product yield and calculated values (lines). As shown in Fig. 10(d), a high r2 (coefficient of determination) value was achieved, confirming that the model could reproduce the trends of most the product yields proportional to the different temperatures and reaction times.
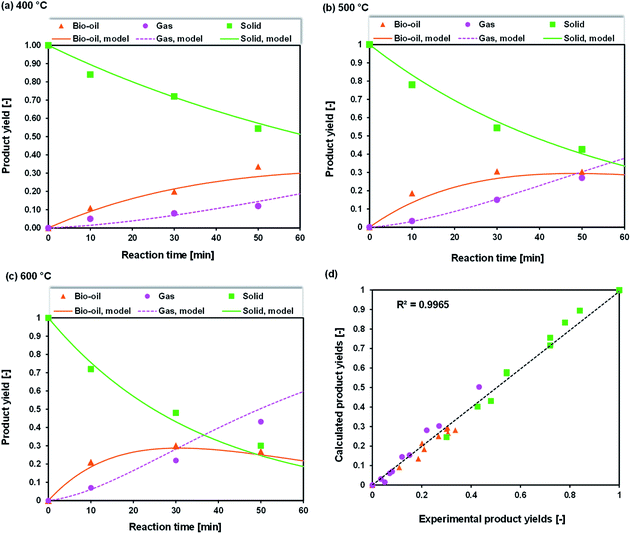 | ||
| Fig. 10 Product distribution from experiments (symbol) and kinetic modelling (line) at (a) 400 °C, (b) 500 °C, (c) 600 °C and (d) parity plot. | ||
The correlation of the temperature on the rate constants was determined by the Arrhenius equation (eqn (6)) to calculate the activation energy and pre-exponential factor.
| k = Ae(−Ea/RT) | (7) |
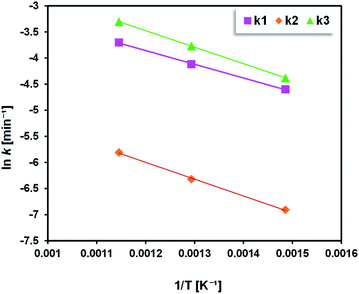
Fig. 11 shows the Arrhenius plots for the pyrolysis of Sargassum sp. As expected, the straight line between the inverse temperatures (1/T) and the logarithm of the reaction rate constant (ln![[thin space (1/6-em)]](https://www.rsc.org/images/entities/char_2009.gif) k) could be noticed, confirming that the distribution product of macroalgal pyrolysis obeyed the Arrhenius equation. The values for the activation energies and pre-exponential factors obtained for the pyrolysis of Sargassum sp. are presented in Table 2. Activation energies between 21.83 to 26.77 kJ mol−1 were obtained for Sargassum sp. pyrolysis. Pre-exponential factors of 8.22 × 10⁻³, 1.97 × 10⁻³, and 2.30 × 10⁻² s−1 were obtained to convert solid to liquid, solid to gas, and liquid to gas products, respectively. Interestingly, the activation energy for the conversion of solid to gas was higher (26.77 kJ mol−1) than that for solid to liquid (21.83 kJ mol−1). This could be attributed to the fact that the energy needed to decompose solid into gas products is higher than for converting the solids to liquids.
k) could be noticed, confirming that the distribution product of macroalgal pyrolysis obeyed the Arrhenius equation. The values for the activation energies and pre-exponential factors obtained for the pyrolysis of Sargassum sp. are presented in Table 2. Activation energies between 21.83 to 26.77 kJ mol−1 were obtained for Sargassum sp. pyrolysis. Pre-exponential factors of 8.22 × 10⁻³, 1.97 × 10⁻³, and 2.30 × 10⁻² s−1 were obtained to convert solid to liquid, solid to gas, and liquid to gas products, respectively. Interestingly, the activation energy for the conversion of solid to gas was higher (26.77 kJ mol−1) than that for solid to liquid (21.83 kJ mol−1). This could be attributed to the fact that the energy needed to decompose solid into gas products is higher than for converting the solids to liquids.
| Kinetic parameter | Reaction direction | Activation energy, Ea [kJ mol−1] | Pre-exponential factor, A [s−1] |
|---|---|---|---|
| k1 | Solid → liquid | 21.83 | 8.22 × 10⁻³ |
| k2 | Solid → gas | 26.77 | 1.97 × 10⁻³ |
| k3 | Liquid → gas | 26.31 | 2.30 × 10⁻² |
Conclusions
The slow pyrolysis of Sargassum sp. was investigated comprehensively for bio-oil and biochar production. The bio-oil derived from Sargassum sp. pyrolysis primarily contained carboxylic acids (25.07–35.01%), furan derivatives (12.51–21.53%), aliphatic hydrocarbons (12.08–16.65%), and N-aromatic compounds (12.86–14.78%). The biochars' H/C and O/C atomic ratios were lower than those of the feedstock, confirming that dehydration and decarboxylation reactions occurred throughout the pyrolysis. The heating values and carbon content of macroalgal biochar increased with temperature. The higher heating value (HHV) of biochar from the macroalgal pyrolysis was in the range of 23.12–25.89 MJ kg−1, which was relatively higher than those of the low-ranked coals. Intriguingly, SEM analysis showed a higher porosity in the biochar surface compared to in the original feedstock, indicating that Sargassum's-derived biochar has excellent potential as a renewable porous carbon-based material for application as an adsorbent and catalyst, or in wastewater treatment and energy storage. The BET surface area of Sargassum sp. biochar was in the range 4.28–5.68 m2 g−1. The kinetic model of Sargassum sp. pyrolysis was proposed, and it was found that the experimental data agreed well with the kinetic model. The activation energies were calculated to be between 21.83 and 26.77 kJ mol−1. A significant overall finding from the pyrolysis of Sargassum sp. would be more beneficial if all the resulting products could be used appropriately. Hence, further investigations into integrating the downstream processes to further valorize Sargassum sp. for bioenergy and value-added need to be conducted in the future.CRediT authorship contribution statement
Obie Farobie: conceptualization, methodology, writing-original draft, resources, formal analysis, project administration, funding acquisition. Apip Amrullah: methodology, investigation, resources, formal analysis. Asep Bayu: writing-review and editing, investigation, resources. Novi Syaftika: investigation, resources. Latifa A. Anis: investigation. Edy Hartulistiyoso: writing-review and editing, supervision.Conflicts of interest
There are no conflicts to declare.Acknowledgements
The authors are enormously grateful to IPB University through World-Class University-Program Riset Kerjasama Institusi (RKI) (9072/IT3.L1/PT.01.03/P/B/2021). The research funding from Indonesian Endowment Fund for Education (LPDP) and the Indonesian Science Fund (DIPI) through the RISPRO Kolaborasi Internasional (RISPRO-KI) Funding Program (Grant No. RISPRO/KI/B1/KOM/12/11684/1/2020) are also duly acknowledged. The APC was funded by Indonesian Endowment Fund for Education (LPDP) through RISPRO-KI Funding Program. We thank the National Research and Innovation Agency (BRIN), for providing the instrumental analysis of CHNS analyzer, FTIR, and SEM.Notes and references
- O. Farobie, Y. Matsumura, N. Syaftika, A. Amrullah, E. Hartulistiyoso, A. Bayu, N. R. Moheimani, S. Karnjanakom and G. Saefurahman, Bioresour. Technol. Rep., 2021, 16, 100844 CrossRef.
- J. Q. Bond, A. A. Upadhye, H. Olcay, G. A. Tompsett, J. Jae, R. Xing, D. M. Alonso, D. Wang, T. Zhang, R. Kumar, A. Foster, S. M. Sen, C. T. Maravelias, R. Malina, S. R. H. Barrett, R. Lobo, C. E. Wyman, J. A. Dumesic and G. W. Huber, Energy Environ. Sci., 2014, 7, 1500–1523 RSC.
- F. Abnisa and W. M. A. Wan Daud, Energy Convers. Manage., 2014, 87, 71–85 CrossRef CAS.
- M. A. Destek, S. A. Sarkodie and E. F. Asamoah, Biomass Bioenergy, 2021, 149, 106076 CrossRef CAS.
- C. Y. Li, J. Y. Wu, Y. J. Dai and C. H. Wang, Energy Convers. Manage., 2021, 243, 114364 CrossRef CAS.
- X. Zhang, H. Lei, S. Chen and J. Wu, Green Chem., 2016, 18, 4145–4169 RSC.
- V. Dhyani and T. Bhaskar, Renewable Energy, 2018, 129, 695–716 CrossRef CAS.
- W. Yang, Z. Wang, J. Han, S. Song, Y. Zhang and W. Gong, RSC Adv., 2019, 9, 41962–41969 RSC.
- N. Nkosi, E. Muzenda, J. Gorimbo and M. Belaid, RSC Adv., 2021, 11, 11844–11871 RSC.
- O. Farobie, P. Changkiendee, S. Inoue, T. Inoue, Y. Kawai, T. Noguchi, H. Tanigawa and Y. Matsumura, Ind. Eng. Chem. Res., 2017, 56, 6401–6407 CrossRef CAS.
- T. Samanmulya, O. Farobie and Y. Matsumura, J. Jpn. Pet. Inst., 2017, 60, 34–40 CrossRef CAS.
- A. Horvat, D. S. Pandey, M. Kwapinska, B. B. Mello, A. Gómez-Barea, L. E. Fryda, L. P. L. M. Rabou, W. Kwapinski and J. J. Leahy, RSC Adv., 2019, 9, 13283–13296 RSC.
- J. Chen and S. Li, RSC Adv., 2020, 10, 2160–2169 RSC.
- S. Budsaereechai, A. J. Hunt and Y. Ngernyen, RSC Adv., 2019, 9, 5844–5857 RSC.
- J. Wu, L. Wang, H. Ma and J. Zhou, RSC Adv., 2021, 11, 34795–34805 RSC.
- R. P. Anex, A. Aden, F. K. Kazi, J. Fortman, R. M. Swanson, M. M. Wright, J. A. Satrio, R. C. Brown, D. E. Daugaard, A. Platon, G. Kothandaraman, D. D. Hsu and A. Dutta, Fuel, 2010, 89, S29–S35 CrossRef CAS.
- L. M. Terry, C. Li, J. J. Chew, A. Aqsha, B. S. How, A. C. M. Loy, B. L. F. Chin, D. S. Khaerudini, N. Hameed, G. Guan and J. Sunarso, Carbon Resour. Convers., 2021, 4, 239–250 CrossRef CAS.
- A. K. Sakhiya, A. Anand, I. Aier, V. K. Vijay and P. Kaushal, Bioresour. Technol. Rep., 2021, 15, 100818 CrossRef.
- E. Hu, Y. Tian, Y. Yang, C. Dai, M. Li, C. Li and S. Shao, J. Anal. Appl. Pyrolysis, 2022, 161, 105398 CrossRef CAS.
- C. A. Okonkwo, M. C. Menkiti, I. A. Obiora-Okafo and O. N. Ezenwa, Biomass Bioenergy, 2021, 146, 105996 CrossRef CAS.
- M. C. Rulli, D. Bellomi, A. Cazzoli, G. De Carolis and P. D'Odorico, Sci. Rep., 2016, 6, 1–10 CrossRef PubMed.
- H. V. Ly, S. S. Kim, H. C. Woo, J. H. Choi, D. J. Suh and J. Kim, Energy, 2015, 93, 1436–1446 CrossRef CAS.
- D. Davis, R. Simister, S. Campbell, M. Marston, S. Bose, S. J. McQueen-Mason, L. D. Gomez, W. A. Gallimore and T. Tonon, Sci. Total Environ., 2021, 762, 143134 CrossRef CAS PubMed.
- M. Farghali, A. P. Yuhendra, I. M. A. Mohamed, M. Iwasaki, S. Tangtaweewipat, I. Ihara, R. Sakai and K. Umetsu, J. Environ. Chem. Eng., 2021, 9, 106405 CrossRef CAS.
- S. Saldarriaga-Hernandez, E. F. Nájera-Martínez, M. A. Martínez-Prado and E. M. Melchor-Martínez, Case Stud. Chem. Environ. Eng., 2020, 2, 100032 CrossRef.
- D. Resiere, R. Valentino, R. Nevière, R. Banydeen, P. Gueye, J. Florentin, A. Cabié, T. Lebrun, B. Mégarbane, G. Guerrier and H. Mehdaoui, Lancet, 2018, 392, 2691 CrossRef.
- R. E. Rodríguez-Martínez, A. E. Medina-Valmaseda, P. Blanchon, L. V. Monroy-Velázquez, A. Almazán-Becerril, B. Delgado-Pech, L. Vásquez-Yeomans, V. Francisco and M. C. García-Rivas, Mar. Pollut. Bull., 2019, 146, 201–205 CrossRef PubMed.
- B. Biswas, R. Singh, B. B. Krishna, J. Kumar and T. Bhaskar, Bioresour. Technol., 2017, 242, 139–145 CrossRef CAS PubMed.
- B. Cao, Z. Xia, S. Wang, A. E. F. Abomohra, N. Cai, Y. Hu, C. Yuan, L. Qian, L. Liu, X. Liu, B. Li, Z. He and Q. Wang, J. Anal. Appl. Pyrolysis, 2018, 134, 526–535 CrossRef CAS.
- J. Li, Y. Zhu, C. Wang, W. Wei, Z. Liu, Y. Tian, P. Zong, Y. Qiao and S. Qin, Algal Res., 2020, 48, 101888 CrossRef.
- I. Ali and A. Bahadar, Algal Res., 2017, 21, 89–97 CrossRef.
- A. Amrullah, O. Farobie and R. Widyanto, Bioresour. Technol. Rep., 2021, 13, 100642 CrossRef.
- A. Amrullah, O. Farobie and G. P. Pramono, Korean J. Chem. Eng., 2022, 39, 389–397 CrossRef CAS.
- A. Iaccarino, R. Gautam and S. M. Sarathy, Sustainable Energy Fuels, 2021, 5, 2234–2248 RSC.
- A. Aboulkas, H. Hammani, M. El Achaby, E. Bilal, A. Barakat and K. El harfi, Bioresour. Technol., 2017, 243, 400–408 CrossRef CAS PubMed.
- M. Kaewpanha, G. Guan, X. Hao, Z. Wang, Y. Kasai, K. Kusakabe and A. Abudula, Fuel Process. Technol., 2014, 120, 106–112 CrossRef CAS.
- J. H. Choi, S. S. Kim, D. J. Suh, E. J. Jang, K. Il Min and H. C. Woo, Korean J. Chem. Eng., 2016, 33, 2691–2698 CrossRef CAS.
- R. Gautam, S. Shyam, B. R. Reddy, K. Govindaraju and R. Vinu, Sustainable Energy Fuels, 2019, 3, 3009–3020 RSC.
- S. Wang, Z. Xia, Q. Wang, Z. He and H. Li, J. Anal. Appl. Pyrolysis, 2017, 126, 118–131 CrossRef CAS.
- Y. Hong, W. Chen, X. Luo, C. Pang, E. Lester and T. Wu, Bioresour. Technol., 2017, 237, 47–56 CrossRef CAS PubMed.
- R. Vinu and L. J. Broadbelt, Energy Environ. Sci., 2012, 5, 9808–9826 RSC.
- X. Zhou, W. Li, R. Mabon and L. J. Broadbelt, Energy Environ. Sci., 2018, 11, 1240–1260 RSC.
- H. Persson and W. Yang, Fuel, 2019, 252, 200–209 CrossRef CAS.
- L. Zhang, Z. Yang, S. Li, X. Wang and R. Lin, J. Anal. Appl. Pyrolysis, 2020, 152, 104966 CrossRef CAS.
- P. Zong, Y. Jiang, Y. Tian, J. Li, M. Yuan, Y. Ji, M. Chen, D. Li and Y. Qiao, Energy Convers. Manage., 2020, 216, 112777 CrossRef CAS.
- X. Wang, X. Tang and X. Yang, Energy Convers. Manage., 2017, 140, 203–210 CrossRef CAS.
- Y. Su, L. Liu, S. Zhang, D. Xu, H. Du, Y. Cheng, Z. Wang and Y. Xiong, Bioresour. Technol., 2020, 295, 122243 CrossRef CAS PubMed.
- Z. B. Zhang, Q. Lu, X. N. Ye, W. T. Li, B. Hu and C. Q. Dong, Energy Convers. Manage., 2015, 106, 1309–1317 CrossRef CAS.
- M. F. Nazarudin, N. H. Alias, S. Balakrishnan, W. N. I. Wan Hasnan, N. A. I. Noor Mazli, M. I. Ahmad, I. S. Md Yasin, A. Isha and M. Aliyu-Paiko, Molecules, 2021, 26, 5216 CrossRef CAS PubMed.
- C. Zhao, E. Jiang and A. Chen, J. Energy Inst., 2017, 90, 902–913 CrossRef CAS.
- L. Reyes, L. Abdelouahed, C. Mohabeer, J. C. Buvat and B. Taouk, Energy Convers. Manage., 2021, 244, 114459 CrossRef CAS.
- H. Pawlak-Kruczek, Properties of low rank coals and resulting challenges in their utilization, Elsevier Ltd, 2017 Search PubMed.
- Z. Luo and W. Tao, CFBC and BFBC of low-rank coals, Elsevier Ltd, 2017 Search PubMed.
- P. Zhao, Y. Shen, S. Ge, Z. Chen and K. Yoshikawa, Appl. Energy, 2014, 131, 345–367 CrossRef CAS.
- S. Zhou, H. Liang, L. Han, G. Huang and Z. Yang, Waste Manag., 2019, 88, 85–95 CrossRef CAS PubMed.
- G. Gascó, J. Paz-Ferreiro, M. L. Álvarez, A. Saa and A. Méndez, Waste Manag., 2018, 79, 395–403 CrossRef PubMed.
- L. Leng, Q. Xiong, L. Yang, H. Li, Y. Zhou, W. Zhang, S. Jiang, H. Li and H. Huang, Sci. Total Environ., 2021, 763, 144204 CrossRef CAS PubMed.
- S. S. Sahoo, V. K. Vijay, R. Chandra and H. Kumar, Clean. Eng. Technol., 2021, 3, 100101 CrossRef.
Footnote |
| † Electronic supplementary information (ESI) available: Provide result of ultimate and proximate analysis of Sargassum sp., chemical composition identified in bio-oil from GC/MS, band assignment for FTIR spectra of biochar at varying temperatures, typical GC/MS chromatogram of Sargassum sp. bio-oil. See DOI: 10.1039/d2ra00702a |
| This journal is © The Royal Society of Chemistry 2022 |

