DOI:
10.1039/D2RA00319H
(Paper)
RSC Adv., 2022,
12, 9556-9566
Exploration of microplastic pollution with particular focus on source identification and spatial patterns in riverine water, sediment and fish of the Swat River, Pakistan†
Received
16th January 2022
, Accepted 15th March 2022
First published on 28th March 2022
Abstract
Microplastics (MPs) have been reported as an emerging xenobiotic organic pollutant in freshwater ecosystems and a universal hazard for ecosystems because of the rapid increase in global demand. The present study was conducted to explore MPs' occurrence, abundance and spatial distribution in sediment, water and Schizothorax plagiostomus samples, collected from the Swat River. ATR-FTIR spectroscopy was used for chemical characterization of visually identified MPs by using standard protocols such as digestion using H2O2, density separation using ZnCl2, vacuum filtration with borosilicate glass micro filter papers and digital microscopy using a stereomicroscope connected with a camera. Range of mass abundance of identified MPs in river sediments, river water, tributaries sediment and tributary water was found to be 0.6–2.5 mg kg−1, 0.7–3.8 mg L−1, 0.9–4.5 mg kg−1 and 0.6–1.1 mg L−1 respectively. Meanwhile, in Schizothorax plagiostomus digestive tracts samples, it was 0.6–1.9 mg per fish. Numeric abundance of MPs in all matrices was found to be tributary sediment (202 items per kg) > river water (192 items per L) > river sediment (182 items per kg) > fish (153 items per fish) > tributary water (92 items per L). MPs identified on the basis of morphology in all matrices were found to be fragments > fibers > pellets > films > foams. MPs were dominant in all urban stations while their spatial distribution along with the study site was heterogeneous due to the surroundings such as tourist spots, hydrodynamic conditions, and proximity to urban areas, plastic industries and due to recharge by the highly contaminated tributaries. The MPs identified on the basis of size dimensions show that S1 (0.5–1 mm) in all matrices was highest while S2 (1–5 mm) was the lowest. Primary source MPs identified were fibers, films, fragments and foams particles while secondary sources were pellets. Results of ATR-FTIR showed that PE was the most common plastic type identified in all samples followed by PVC, PET, PP and PS. This is the first study exploring the MPs' occurrence, numeric and mass abundance and spatial distribution in the SR ecosystem. The present study may be a valuable reference for better understanding the MPs' pollution in Pakistan. The findings of the present study can help to identify the potential sources (i.e., primary and secondary) of MPs to improve waste management in the Swat District and model the transport fluxes of these microplastics in other rivers using water quality parameters and basin characteristics.
1. Introduction
Plastic demand has increased over the last five decades as a result of their use in production sectors such as building, packaging, electronics, automobile, household, leisure and sports, agriculture, medical devices, and renewable energy causing harm to aquatic environments.1
The plastic particles can be classified by their shape into fragment, pellet, fiber, film and styrofoam and by their size in macroplastics (>25 mm), mesoplastics (between 5 and 25 mm) and microplastics (<5 mm). The nanoplastics (NPs) are usually defined as plastic particles which measure less than 100 nm.2 Plastic pollution has been a subject of special concern in recent years because it cannot only be a source of hazardous chemicals (e.g., additives) added as a result of manufacturing but a sink for hazardous chemicals (e.g., hydrophobic organic contaminants and metals) brought from the surrounding atmosphere during plastic manufacturing.3
In addition to conventional sources of plastic debris (agricultural, industrial, medical, domestic etc.), COVID-19 occurrence rates are significantly increasing the plastic burden through the waste produced by healthcare facilities and personal care products. In this context, the King Abdullah University Hospital in Jordan generated ten folds more medical garbage (650 kg per day, based on 95 COVID-19 patients) than the average generation rate during the hospital's daily operating day.4 Medical waste has also risen exponentially in other parts of the world, including China, Catalonia, and Spain, at the rate of 370% and 350% respectively.5
Plastics are composed from monomers, additives, and other components, with harmful monomers, additives, and chemical byproducts accounting for more than half of all the plastics.3 The presence of floating microplastics in the water may affect the distribution of sunlight that is bioavailable to species, disrupting their normal daily activities. MPs in the ecosystem may establish new environments for microbes and microbial colonization,6 which can have an active impact on their abundance and diffusion.7,8 When organisms living on the surface of floating MPs are transported to new environments, they can serve as alien invasive species.9
Furthermore, MPs in the environmental settings pose a challenge to the respiratory and digestive processes by inhaling and ingesting them. We desperately call for a better understanding of the possible risks of MPs to human health, given the lifelong unavoidable exposure of microplastics. Biodegradable plastics are the right candidates to replace non-biodegradable plastics in this sense. Polyhydroxybutyrate (PHB) that is synthesized by microorganisms from renewable materials (in addition to other biodegradable plastics), has gotten a lot of attention. PHB is now commonly used in biomedical applications.10–12 The literature reports that these biodegradable plastics have a potential to generate secondary nanoplastics under environmental conditions that cause toxicity. These secondary nanoplastics particles may adsorb different chemicals from water (heavy metals, polycyclic aromatic hydrocarbons, pharmaceuticals, polychlorinated biphenyls, and so on), potentially exacerbating nanoplastics' negative effects on living species.13
For the time being, it is promising that a few forward-thinking experts from across the world are attempting to comprehend the effects of the plastic plague that has affected our environment. The phenomenon associated with plastic contamination in the aquatic ecosystem will continue to merit scientific study, given the proliferation of plastics into all spheres of human existence and their growing usage value in the developing world. As a result, a thorough report on this emerging problem is urgently needed to gain a deeper understanding of how to implement cost-effective solutions to the plastic waste for developing countries like Pakistan. Furthermore, we know far less about microplastics in freshwater and terrestrial systems than we do about microplastics in marine environments. Therefore, the present study is carried out to explore the occurrence, abundance spatial distribution and sources of MPs in freshwater riverine sediment and surface water of Swat River (SR).The present research also monitored the accumulation of MPs in Schizothorax plagiostomus digestive tracts. This study will be useful to provide baseline data of MPs pollution that may help future monitoring surveys.
2. Material and methods
2.1 Study area
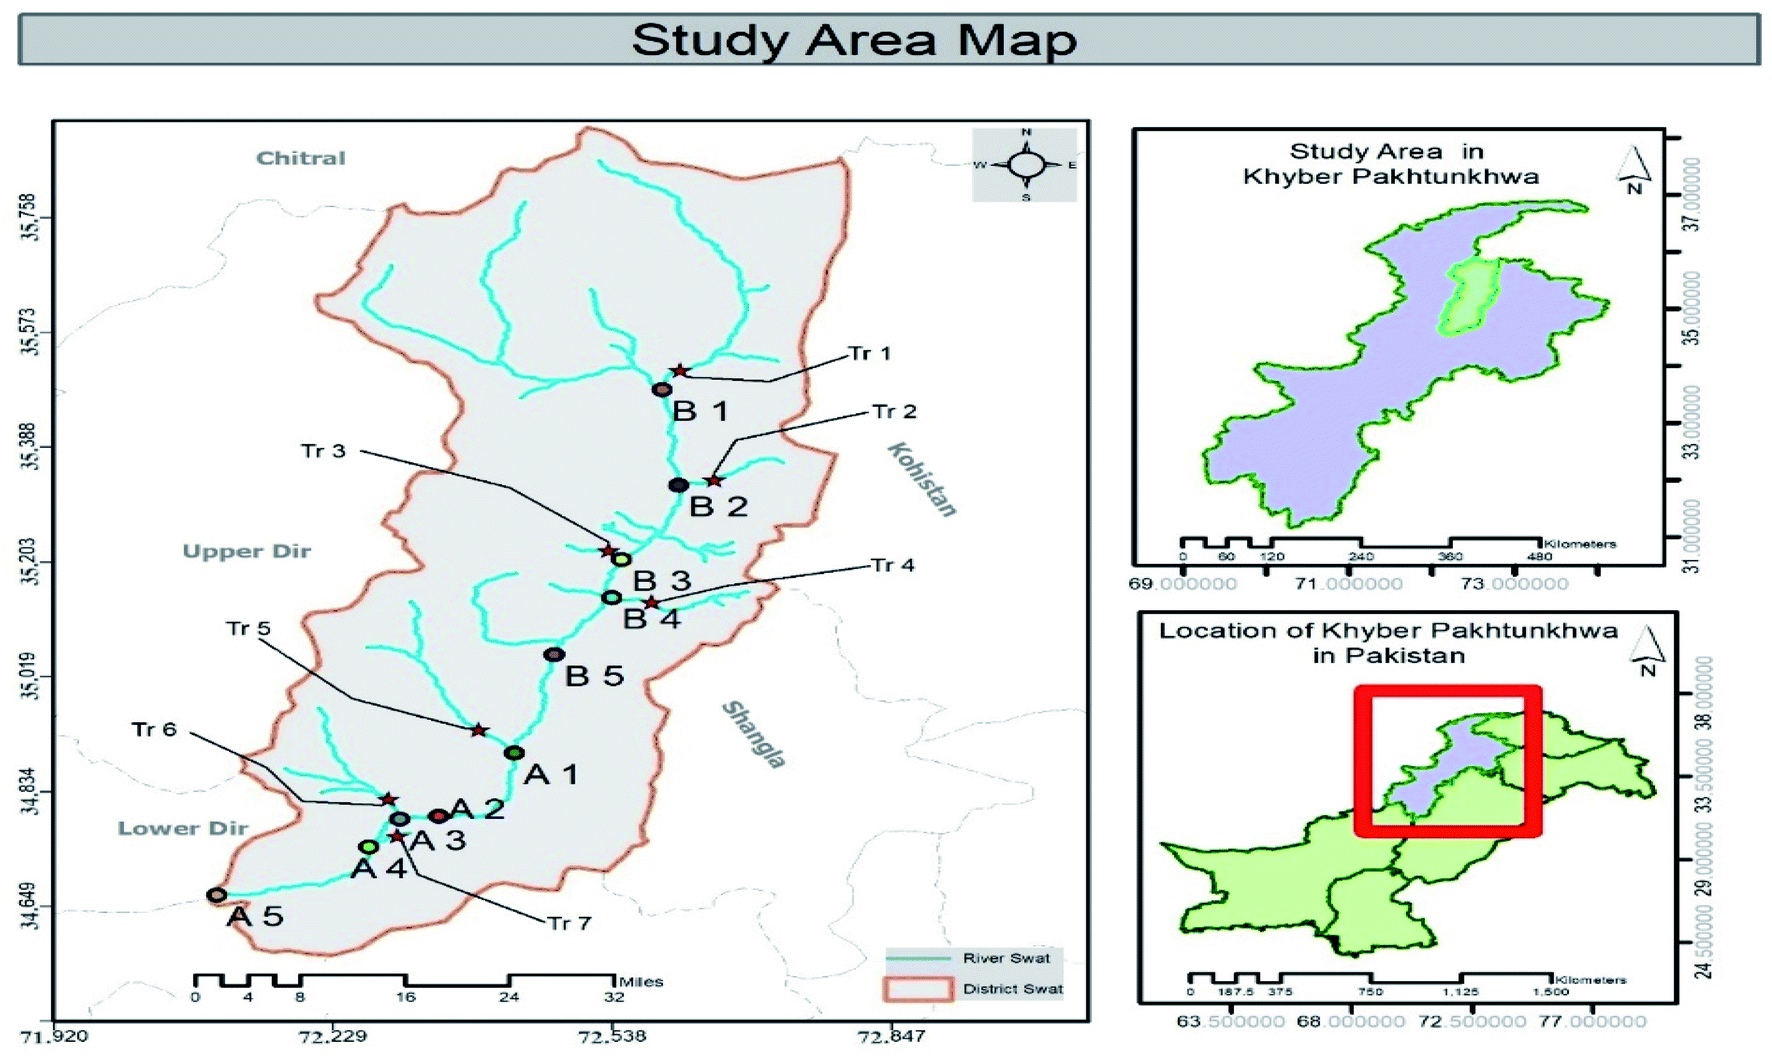
Swat District located at the northwest corner of Khyber Pakhtunkhwa (KPK) Province of Pakistan lies from 34° 34′ to 35° 55′ North latitudes and 72° 08′ to 72° 50′ East longitudes. Swat River (SR) is among the main Fresh Water Rivers (FWRs) existing in KPK and begins at Kalam with the confluence of Ushu and Utror Rivers. SR drains the district Swat and passes through the entire district Swat for about 160 km up to Chakdara where it joins Panjkora River of district Dir. The combined streams after mixing flow in a south-west direction into the Peshawar plain and joins the Kabul River at Nisatta Charsadda after covering 320 km distance. The total length of the river is 250 km from Kalam to its confluence with Kabul River near Nisatta, Charsadda. SR has an important role in the local economy and is a reason of charm for tourists. The river water is used for irrigation and domestic purposes and is habitat of many fish species and migratory birds. This cold water and sluggish moving river ecosystem is appropriate for Schizothorax plagiostomus fish. SR is exposed to various point and nonpoint pollution sources. Point sources include prohibited fishing (with the use of pesticides and agrochemicals), built up areas and mismanagement of solid waste. Non-point containing domestic and hospital sewage, dumping sites and absence of appropriate sanitation system from local community; an alarming threat for the community and policy makers.14 Study area is divided into two zones: zone one (Z1) (includes urban stations characterized by large human settlements, sewage and plastic industries) and zone two (Z2) includes non-urban stations and dominates agricultural areas (Fig. 1).
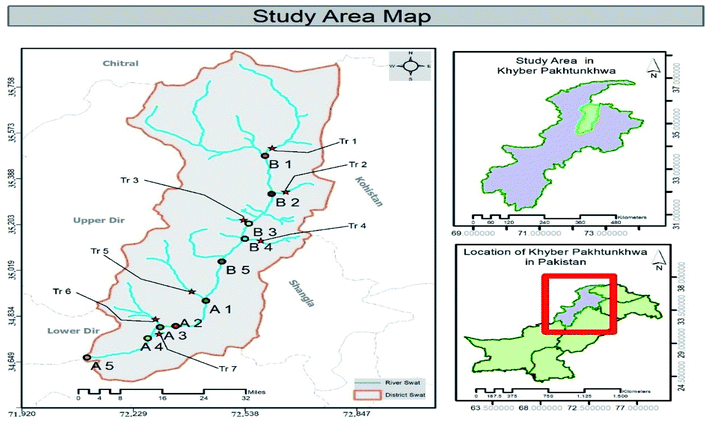 |
| | Fig. 1 Map of study area showing microplastic sampling stations of Swat River, district Swat. Z1 sampling stations are denoted with A1, A2, A3….An, while, Z2 stations with B1, B2, B3…Bn. The tributaries present in both zones joining the river were represented with Tr1, Tr2, Tr3…Trn (see Table 1). | |
Table 1 Geographical coordinates and zone wise sampling stations of sediment, water and fish. Sampling stations B1–B5 represents non-urban sampling sites while A1–A5 are urban. Z1 represents urban zone and non-urban stations respectively
| Sr. no. |
Station name |
Station code |
Station zones (Z1, Z2) |
Coordinates |
| 1 |
Kalam |
B1 |
Z2 |
35°28′′51′N 72°35′′29′E |
| 2 |
Mankial |
B2 |
Z2 |
35°19′′35′N 72°36′′42′E |
| 3 |
Bahrain |
B3 |
Z2 |
35°12′′15′N 72°32′′49′E |
| 4 |
Madyan |
B4 |
Z2 |
35°08′′40′N 72°32′′17′E |
| 5 |
Baghderai |
B5 |
Z2 |
35°03′′14′N 72°28′′28′E |
| 6 |
Matta |
A1 |
Z1 |
34°53′′50′N 72°25′′44′E |
| 7 |
Kanju |
A2 |
Z1 |
34°47′′34′N 72°20′′47′E |
| 8 |
Hazara |
A3 |
Z1 |
34°47′′27′N 72°18′′09′E |
| 9 |
Gugdara |
A4 |
Z1 |
34°44′′47′N 72°16′′19′E |
| 10 |
Chakdara |
A5 |
Z1 |
34°38′′48′N 72°01′′58′E |
2.2 Samples collection and preparation
Sampling stations were selected according to the standard protocol15 by using purposive sampling method starting from upstream of river to downstream. To investigate and highlight the problem of MPs, complete Swat River Basin (SRB) was randomly divided into 10 sampling stations.
2.2.1 Sediment sampling. Prior to sampling, sediment fraction >5 mm was sieved with 5 mm metal sieve to reduce the sample weight, and to get required size of sediment. Sediment samples were taken from 100 meters away from the main river body to the bank. With metal scale, the top 5 cm of sediment layer was marked and grab sampling technique was adopted where after sampling one representative sample, its sub-samples or replicates (a, b and c) were taken.16 For investigation of river-to-river transport of MPs pollution, major tributaries joining SR were also sampled. Sampling equipment was rinsed after each sampling station in order to avoid site to site contamination with deionized water. In order to represent the site and to check the site variability, sub-samples were collected 100 meters away from each other. A single sediment composite sample (4 × 250 g = 1000 g = 1 kg) was collected per site. All samples were stored in aluminum zippers (to avoid contamination) and coordinates of station were taken with GPS (Global Positioning System). Table 1 in ESI† contains all those details with respect to sampling stations and conditions during the sampling period in order to check the sources that may affect MPs content in samples.
2.2.2 Water sampling. For water sampling, bridge sampling technique was adopted as some of the sampling stations were not easily approachable. In order to collect river and tributary water samples, mesh (0.3 mm) along with bottle was suspended from the bridge to the center of the SR. Water passed through the net, filtered and collected in 1 Liter bottle. After sampling desired station's representative water sample, net was monitored and rinsed with deionized water to transfer any clogged suspected MPs.
2.2.3 Fish sampling. The Schizothorax plagiostomus fish is a local riverine fish usually used as a food in the study area was chosen to investigate the microplastics in its gastrointestinal tract to evaluate the possible entrance of the microplastics in the food web. Swati Fish (Schizothorax plagiostomus) were captured from SR with fishing rods, hand nets and hooks. Total 40 individuals (Schizothorax plagiostomus) covering 10 stations with 4 individuals of similar specie at each station were collected and separately stored in aluminum foil.
2.2.4 Microplastics extraction from sediment. The borosilicate glass beakers were utilized for drying sediment samples in an automatic digital oven (Model: DOD-1-105/02; Pakistan Council of Scientific and Industrial Research Laboratories, Pakistan) at the 50 °C temperature for 48 hours.17 Size segregation (S1: 0.5–1 mm and S2: 1–5 mm) of sediment samples was carried out using the methodology of Hidalgo-Ruz.18 For quality control, all samples were covered with aluminum foil while drying to avoid background contamination. After drying, representative and replicate samples (n = 4) were mixed to make a composite sample of 1 kg by using electronic weighing balance (Model: ATY224; SHIMADZU, Japan).Sediment samples containing visible organic matter were then digested with 15% H2O2 [(CSA: 231-592-0); Analytical Grade (AG)].19 For this purpose, samples were taken in a 1000 mL Erlenmeyer flask (pre-rinsed with deionized water) placed in fume hood (Model: EscoFrontier; EN14175-3) and then added 200 mL of stabilized H2O2. To stimulate the oxidation process, samples were placed on a hotplate (Model: MSHP-1/02; PCSIR Laboratories, Pakistan) set at a temperature of 50 to 55 °C for 48 hours and covered with aluminum foil. After digestion, for maximum separation of MPs in samples, saturated ZnCl2 [(CAS: 231-592-0; purity, 98%, AG) Sigma Aldrich® Germany] with 1.7 kg L−1 density was used.20 A total 250 mL of saturated ZnCl2 was added in each beaker. The mixture was stirred for 20 minutes to disaggregate and suspend any MPs items. Then samples were kept in a safe place for 24 hours to settle down sediment particles. The supernatant was aliquoted into a beaker and allowed to settle for the next 6 hours and then filtered using a pre-weighted borosilicate glass microfiber filters (Micropore: MGF/C47 mm; San Diego, USA) and a vacuum filtration assembly (Thermo Scientific: Ecolab-glass: 2342, Germany). Filter papers containing samples were then kept in the glass Petri dishes till microscopic examination.
2.2.5 Microplastic extraction from water. Water samples were poured into stacked sieves (5 mm top, 1 mm middle and 0.5 mm in bottom) for size segregation. Samples were carefully transferred to 200 mL glass beakers and dried in an oven at 75 °C for 48 hours. After drying, beakers were placed on a hot plate (in fume hood) and 20 mL of stabilized 15% H2O2 was added and set to 50 °C for 10–15 minutes. After digestion, 50 mL of ZnCl2 was added in each beaker and stirred on a magnetic stirrer at high intensity for 20 minutes to disaggregate and suspend plastic items. Samples were kept for 24 hours and after that supernatant was aliquoted in beakers and allowed to settle for 6 hours. Supernatants were then vacuum filtered with borosilicate glass microfiber filters (Micropore: MGF/C47 mm; San Diego, USA).
2.2.6 Microplastics extraction from Schizothorax plagiostomus. Fish samples were dissected as per protocol21 for the removal of digestive tract including stomach and intestines to monitor MPs presence. 20 mL of 15% stabilized H2O2 was added to the beakers containing digestive tracts.22 For complete digestion, samples were placed on the hot plate at a temperature of 50–60 °C for 72 hours. Then 50 mL of ZnCl2 solution was added to each beaker and stirred by a magnetic stirrer for 20 minutes. Samples were then put in safe place for 24 hours and after that supernatant was aliquoted into the clean beakers and then vacuum filtered using borosilicate glass microfiber filters (Micropore: MGF/C47 mm; San Diego, USA).
2.3 Observation and identification of microplastics
Filter papers were manually examined for MPs identification, based on colors and shapes and were picked up with stainless steel tweezers, marked and stored in glass bottles. These filter papers were inspected under digital microscope (CX41; Olympus Co. Ltd., Japan) connected with a digital camera (ISH500; U-TV0.5XC-3, Co. Ltd. Japan) at 4× magnification level. MPs were identified based on morphology (fiber, film, fragment, foam and pellet), sizes (S1 and S2) and colors (blue, black, red, yellow, brown, white and transparent) of the items.18 MP items found under microscope based on these parameters were marked, counted and images were taken following the protocols of ref. 23. Finally, chemical characterization of visually identified MPs in each matrix (sediment and water) was evaluated via ATR-FTIR. MPs' samples on the filter papers were scanned for 4000–400 cm−1 frequency range and data was collected at a resolution of 4 cm−1 with a 32 s scanning time. In present study, PE, PP, PS, PVC and PET were identified as the main polymer types.
2.4 Experimental control and QA/QC
All solutions, including distilled water, 15% H2O2 and saturated ZnCl2 (1.7 kg L−1) solution, were filtered through a 47 mm Whatman® glass microfiber membrane (GF/B; 1 m pore size) and stored in the glassware wrapped with aluminum foil to avoid MPs' cross-contamination. Filtered distilled water was used to rinse all containers and glasswares. From sample preparation to extraction processes, the blank (control sample) consisted of filtered distilled water of volume 250 mL in capped beakers were placed at 10 separate spots within the laboratory for one week. The water samples were tested in the same way as the blank control solutions. Furthermore, cotton lab coats and polymer-free gloves were worn during the trials to ensure minimal MPs contamination. The laboratory work was done under a laminar-flow hood, and the use of plastic tools or containers were strictly avoided throughout the experiments.
3. Results and discussion
3.1 Microscopic analysis
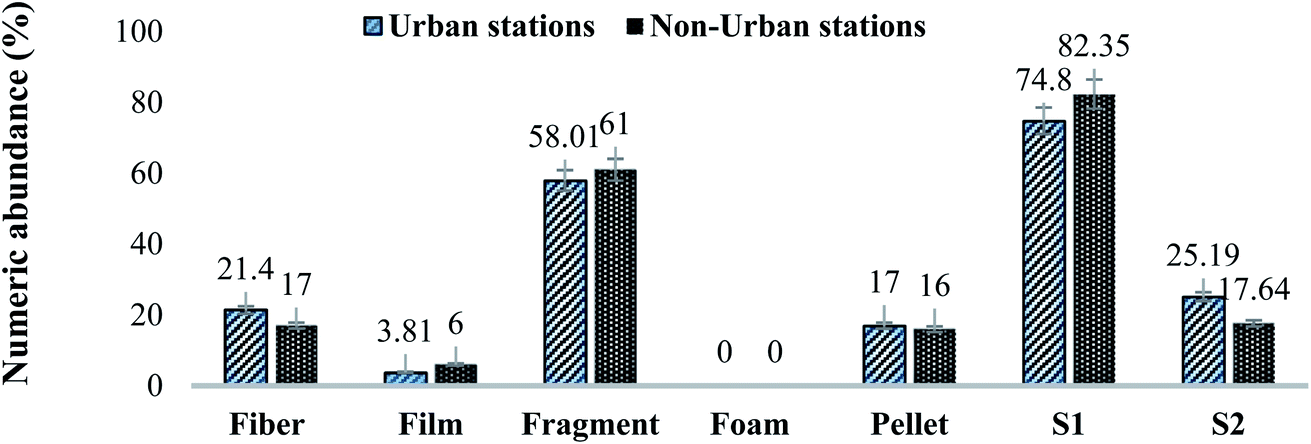
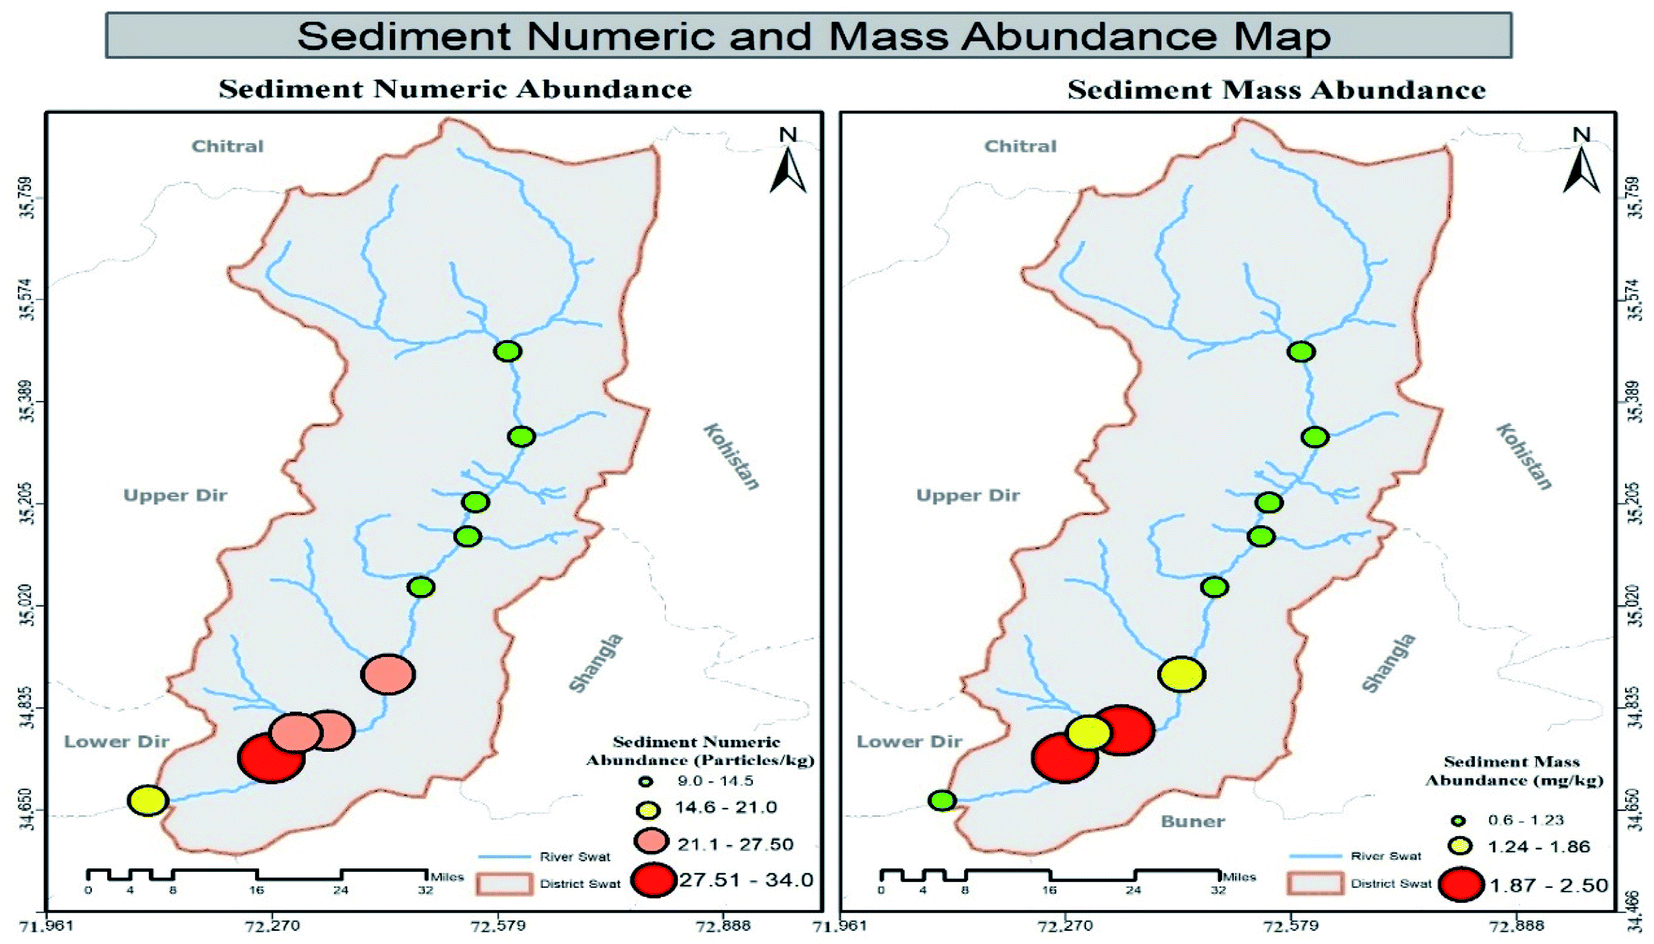
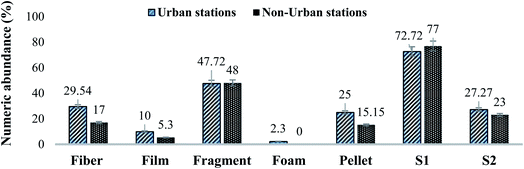
3.1.1 Occurrence, abundance and spatial distribution of microplastics (MPs) in river sediment. Microplastics were identified in all sediment samples collected from 10 different sampling locations throughout the SR as shown in Table SI 2.† The numeric abundance of MPs in all urban and non-urban sediment samples is shown in Fig. 2 with respective sizes. Fragmented were the most observed items (31/51 items per kg) while films were least (3/51 items per kg) in all non-urban stations in which blue colored MPs were dominant (Fig. SI 1†). Considering the size of collected MP items, a relatively high proportion of size S1 (82.35%) was measured in all sediment samples while S2 (17.64%) found to be least identified throughout nonurban stations samples (Fig. 2). The numeric abundance of urban stations was more than nonurban stations sharing 72% of the total identified MPs while, station wise results are presented in Table SI 2.† The colors of identified MPs were red, blue, black, green, yellow, white and transparent in which black color was dominantly observed, while S1 was the most measured size in all stations with percent abundance of 57.14% (Fig. SI 2†). Comparison of MPs in non-urban and urban sediment samples on the basis of morphology and sizes is illustrated in (Fig. 2). Numeric and mass abundance in river sediments increased significantly from upstream to downstream in the vicinity of urban stations (A1–A5) as shown in spatial distribution map (Fig. 3). Despite the low mass fractions in these sediment samples (0.6–2.5), the number of MPs found in B4 were 12 items per kg which were collected in less populated areas that showed a diffuse ubiquitous distribution of small MPs items. Hotspot (highly contaminated) urban stations based on numeric abundance were A2 and A4 while on the basis of mass abundance it was A4 station (red circles in Fig. 3). Non-urban stations were less polluted in terms of numeric and mass abundance while urban stations were highly polluted (Fig. 3).
 |
| | Fig. 2 Comparison of identified MPs based on morphology and sizes in urban and non-urban sediment samples. Results are displayed as % numeric abundance (items per kg). | |
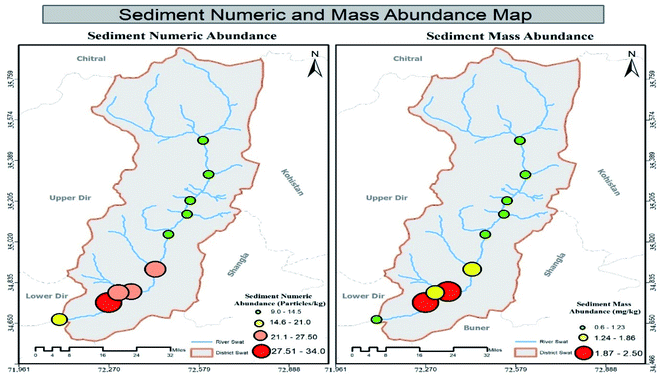 |
| | Fig. 3 Spatial distribution maps generated on the basis of numeric (items per kg) and mass abundance (mg kg−1) of identified MPs in sediment samples collected along Swat River. | |
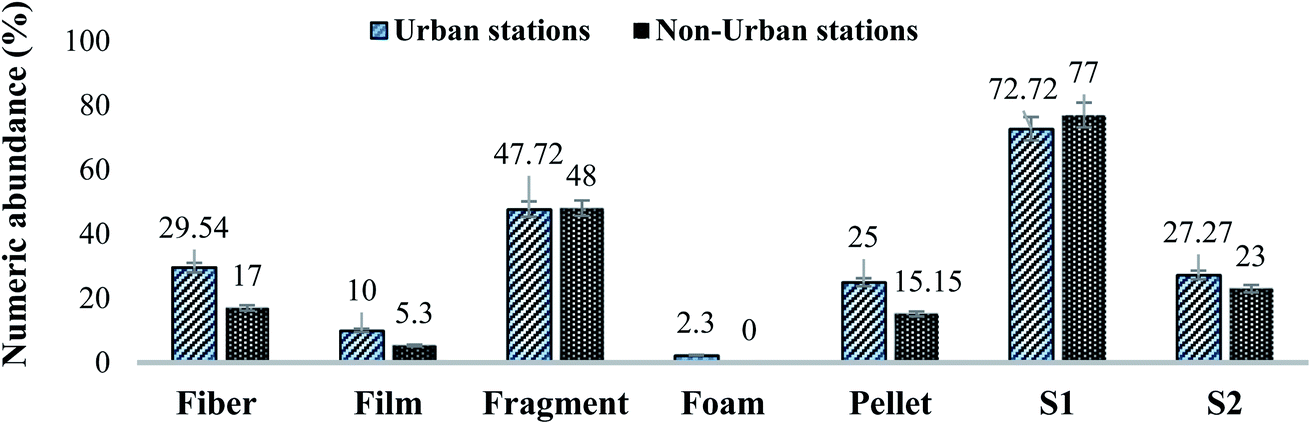
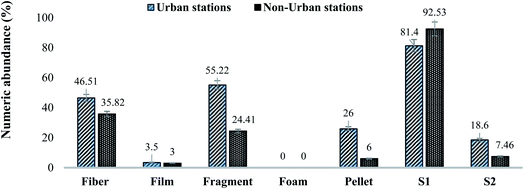
3.1.2 Occurrence abundance and spatial distribution of MPs in river water. Station-wise details of MPs identified in water samples along Swat River is given in Table SI 3.† In overall identified MPs, fragments (48%) share the highest abundance of MPs followed by fibers (17%), pellets (15.15%), and films (5.3%) while no foams were detected. Of all the items identified black colored MPs (28/60 items per L) were most abundant (Fig. SI 3†). These items were mostly found in the S1 size while sharing 77% abundance. In identified MPs based on morphology, the fragment was found to be dominant while sharing numeric abundance of 63 (items per L) in which blue color was dominant (Fig. SI 4†). 72.72% of the MPs identified were of the S1 size while 27.27% were measured as S2 as illustrated in (Fig. 4). MPs were detected in all water samples ranging from 9 to 39 (items per L) (numeric abundance) and from 0.7–3.8 mg L−1 (mass abundance), respectively as illustrated in map (Fig. 5). Spatial distribution of MPs were generated on the basis of abundance of identified MPs and showed an increased trend from upstream to downstream in case of non-urban stations (B1–B5) while in urban stations (A1–A5) the pattern was not clear (Fig. 5).
 |
| | Fig. 4 Comparison of MPs identified based on morphology and sizes in urban and non-urban water samples. Results are displayed as % numeric abundance (items per L). | |
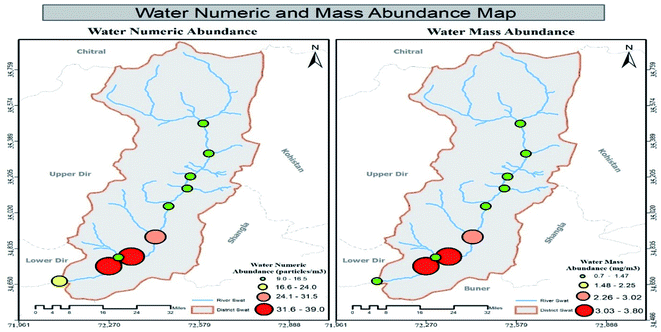 |
| | Fig. 5 Spatial distribution map of numeric (items per kg) and mass abundance (mg kg−1) of MPs in river water samples collected along the Swat River. | |
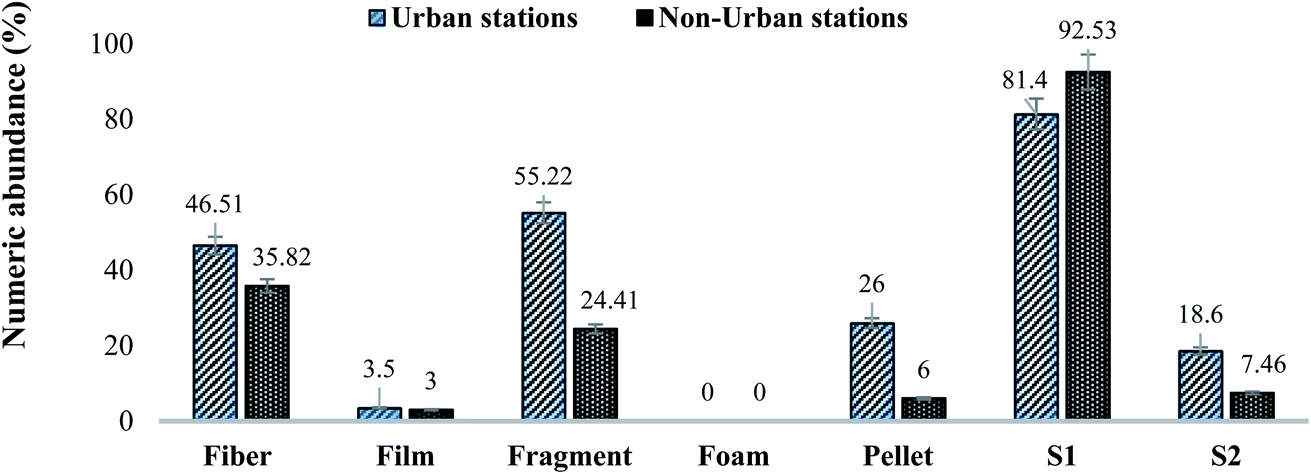
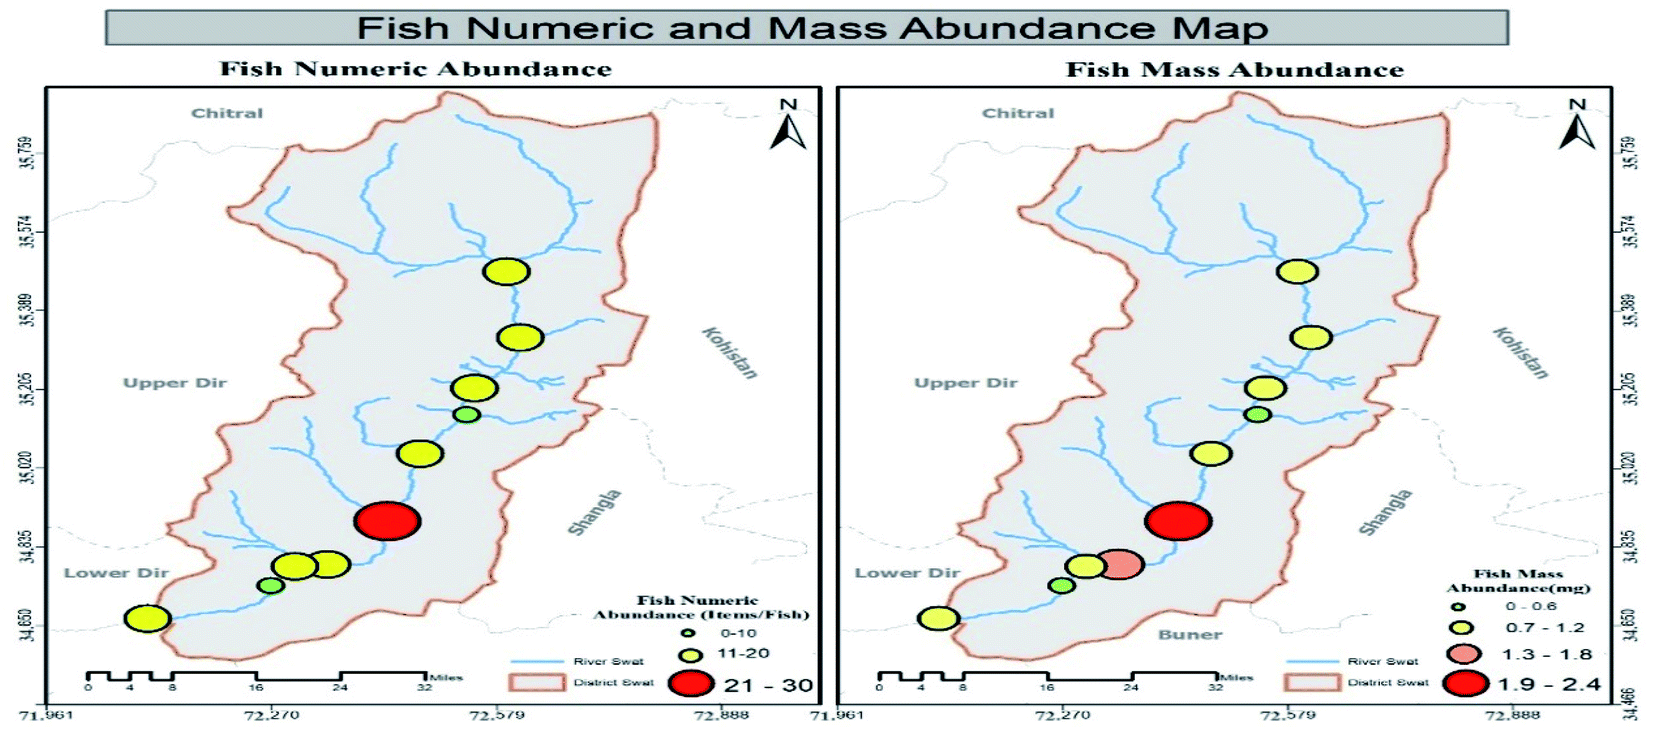
3.1.3 Occurrence, abundance and spatial distribution of MPs in Schizothorax plagiostomus. MPs were observed in all Schizothorax plagiostomus samples. Station-wise numeric abundance of MPs identified is given in Table SI 4.† The range of MPs in non-urban stations was found to be 10–15 items per fish. The highest numeric abundance was found in stations B2 and B5 (15/67 items per fish) while lowest in B4 (10/67 items per fish). The mean of the numeric abundance in all non-urban stations was found to be 13.4 items per fish. Majority of the MPs collected from fish digestive tracts were fragments (55.22%) of various sizes. The other type of MPs found was fibers (24 items per fish), pellets (4 items per fish) and films (2 items per fish) while foam items were not detected in any fish sample (Fig. 6). Majority of the MPs found in non-urban fish digestive tract were measured in S1 size dimension (92.53%) and black colored items were dominantly observed (Fig. SI 5†). Conversely, the numeric abundance of MPs in urban stations was higher than non-urban stations (86/153 items per fish) (Table SI 4†). Highest numeric abundance of MPs was found in station A1 (26/86 items per fish) while lowest in A4 (8/86 items per fish) with an average of 17.2 items per fish. In total 86 identified MPs fibrous items found to be the highest 46.51%. Majority of the items were measured in S1 (81.4%) size dimension in which black (35/86 items per fish) colored items were dominant (Fig. SI 6†). Comparison of numeric abundance based on morphology and size dimensions in urban and non-urban stations is illustrated in Fig. 6. The visual representation of the numeric (items per kg) and mass abundance (mg kg−1) of MPs in the fish samples were highlighted by generating spatial distribution maps and are shown in Fig. 7. Map illustrates that MPs' numeric and mass abundance was homogeneous in non-urban stations (B1–B5) while heterogeneous in urban stations (A1–A5). As the urban sampling stations are situated in the vicinity of urban centers, industrial areas where intensive anthropogenic activities are being carried out, these samples were highly contaminated with MPs indicating a threat to aquatic ecosystems. Overall, our results suggested that freshwater fish is polluted by MPs of different sizes, shapes and types.
 |
| | Fig. 6 Comparison of MPs identified based on morphology and sizes in urban and non-urban Schizothorax plagiostomus samples. Results are displayed as % numeric abundance (items per fish). | |
 |
| | Fig. 7 Spatial distribution maps of numeric (items per kg) and mass abundance (mg kg−1) of MPs in freshwater Schizothorax plagiostomus samples collected along the Swat River. | |
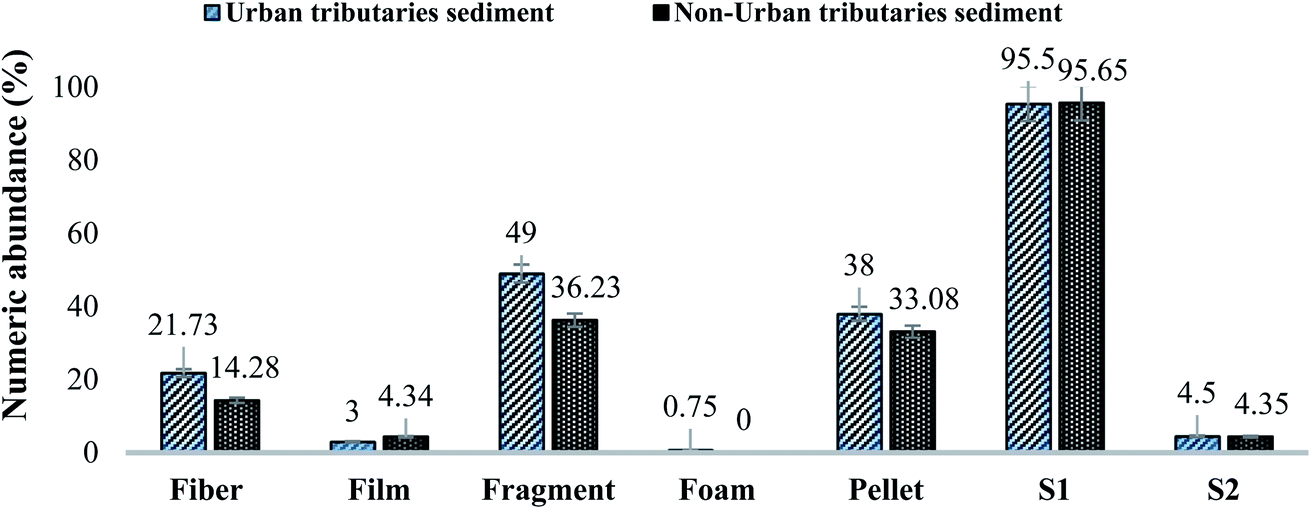
3.1.4 Occurrence and abundance of MPs in tributaries sediment. Microscopy results showed that MPs were present in almost every tributary sediment sample. Results of non-urban tributaries (Tr1–Tr4) showed that Tr1 was highly polluted with 24/69 (items per kg) while Tr4 was least (13 items per kg). The MPs identified ranged from 13-24 (items per kg) with the mean of 17.25 (items per kg) (Table SI 6†). Morphological inspection of identified MPs showed that fragments were present significantly in higher percentage (36.23%) while foam items were not found in any sample (Fig. 8). Most of the items were measured as S1 size (95.65%) in which black colored particles were found to be dominant in non-urban tributaries samples (Fig. SI 7†). The numeric abundance of MPs found in urban tributaries samples showed a similar trend. Sediment samples were found to be polluted with different types and colors of MPs items (Fig. SI 8†). The highest and lowest polluted tributary samples were Tr7 (66 items per kg) and Tr6 (21 items per kg), respectively. Majority of the items were measured as S1 size (95.5%) while comparison of numeric abundance (%) between non-urban and urban tributaries is illustrated in Fig. 8.
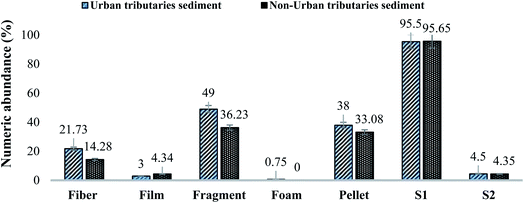 |
| | Fig. 8 Comparison of MPs identified based on morphology and sizes in urban and non-urban tributaries sediment samples. Results are displayed as % numeric abundance (items per kg). | |
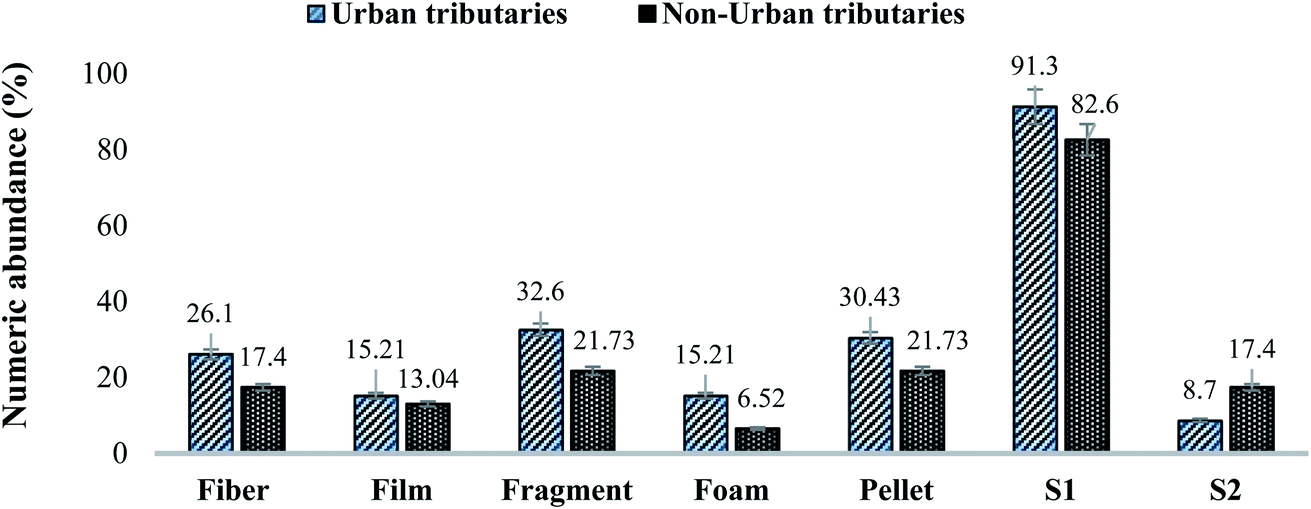
3.1.5 Occurrence and abundance of MPs in tributaries water. MPs were identified in all shapes in water samples of non-urban tributaries with the range of 7–14 items per L (Table SI 7†). The percent abundance of pellets, fibers, films and foams was 21.73%, 17.4%, 13.04% and 6.52% respectively in which S1 size (82.6%) and red color was found to be significantly high. In urban stations the identified items were mostly fragmented (32.6%) and were also measured as S1 size dimension (91.3%) (Fig. 9) while black color (16/46 items per L) was dominantly observed in all samples (Fig. SI 10†).
 |
| | Fig. 9 Comparison of composition of MPs identified based on morphology and sizes in urban and non-urban tributaries water samples. Results are displayed as % numeric abundance (items per L). | |
3.2 Mass abundance of MPs in sediment, water and fish specimens in tributaries
Results showed that MPs' mass abundance throughout the study area was inconsistent in all three matrices except in non-urban fish samples in which a consistent decreasing order was observed. Urban station's mass abundance in all three matrices were in decreasing order like water > sediment > fish while in non-urban samples the order was fish > sediment > water, respectively. Station-wise mass abundance results of water, sediment and Schizothorax plagiostomus are listed in Tables SI 8, SI 9 and SI 10† respectively. No uniform trend of increase or decrease of mass abundance was observed in tributary samples. Range of abundance in tributaries water samples and sediments was 0.6–1.1 mg L−1 and 0.9–4.5 mg kg−1 respectively. Mass abundance of urban tributaries in both matrices was in decreasing order of tributaries sediment > tributaries water while in non-urban samples it was found to be tributaries sediment > tributaries water as shown in Tables S11 and S12.†
3.3 ATR-FTIR results of environmental matrices (river sediment, river water tributaries sediment and tributaries water)
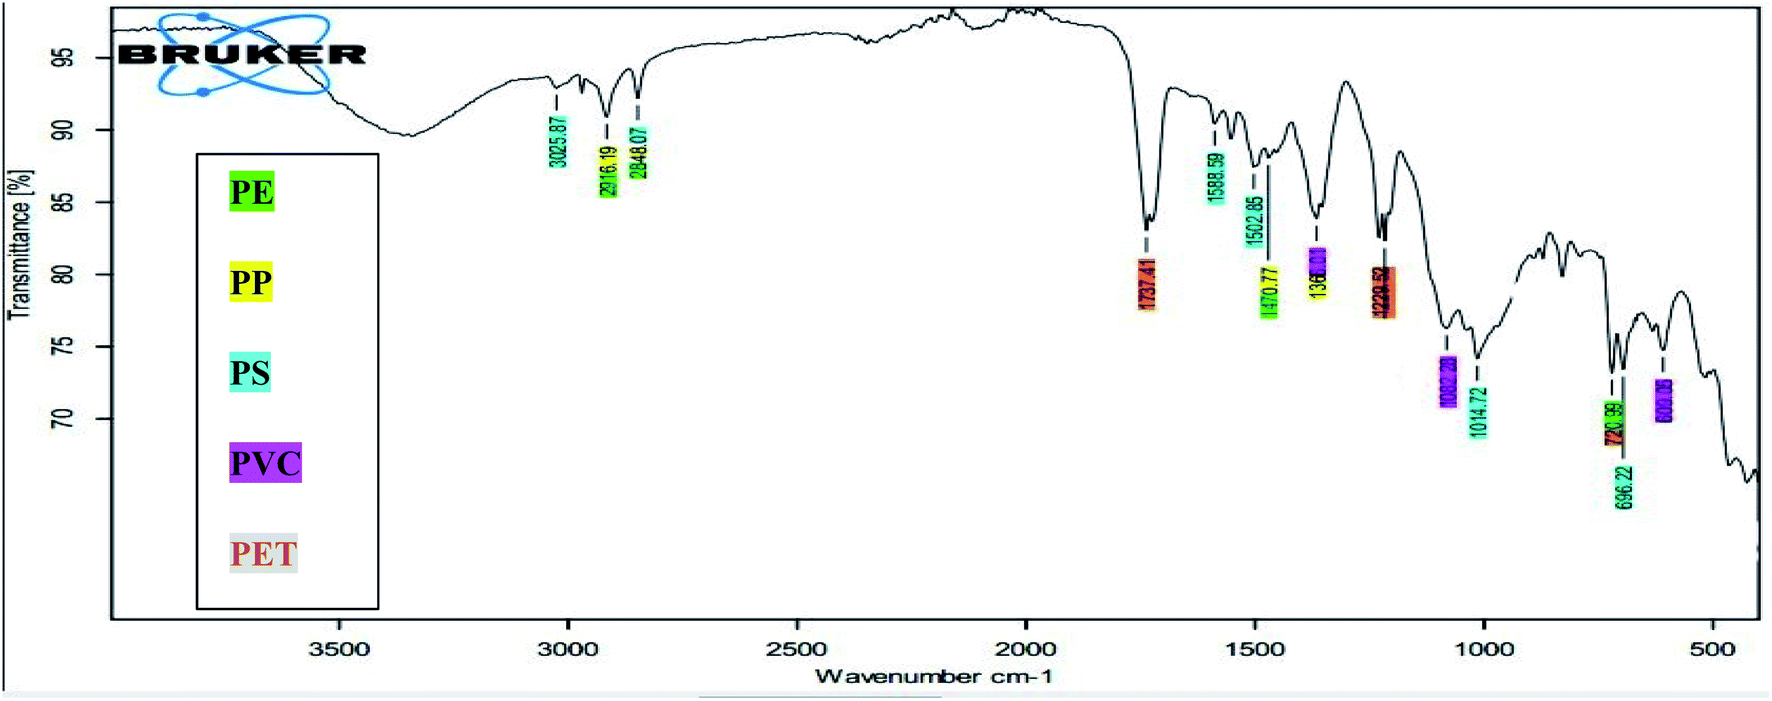
Optically verified MPs items in all matrices were analyzed on ATR-FTIR for their chemical characterization, and a total five type of polymers (PE, PP, PS, PVC and PET) were identified (Fig. 10).
 |
| | Fig. 10 FTIR spectra of identified polymer types in sample Tr4s1. Highlighted peaks are verified from functional groups of each polymer type. | |
Identified functional groups of the plastics in all environmental samples compared with reference peaks and the identified peaks in the samples are shown in Table SI 13.† PE plastic in present study was confirmed using specific functional groups identified on ATR-FTIR. Absorption band at 2914.94 & 2847.75 cm−1 in present study corresponds to methylene (–CH2) stretches. Strong absorption bands at 1472 & 1462 cm−1 are due to C–H deformation vibration of tertiary carbon and corresponds to the typical methyl (–CH3) bending vibration of PE. Additionally, peaks obtained at 718 and 729.41 cm−1 are due to CH2 rocking vibrations. Due to crystallinity of PE, the peak at 720 cm−1 is split and an additional peak is seen at 730 cm−1 in all polymers.24 These peaks are observed at 730 & 717 cm−1 (ref. 25 and 26) that supported these functional groups for PE. The absorption bands of functional groups identified in literature were, 2915 & 2845 cm−1 (C–H stretch), 1472 & 1462 cm−1 (CH2 bend) and 730 & 717 cm−1 (CH2 rock), respectively.
The peak at 2950.12 cm−1 belongs to the bending bond of methyl (–CH3) functional group of PP. Absorption band 2918 slightly shifted from 2839 and 2915 cm−1 belongs to the stretch –CH2 chemical group. These bands observed at 2916.07 cm−1 shifted to 2836.13 cm−1 (–CH2 symmetric bend) in the present study. Moderate absorption peaks of deformation vibrations of the plane CH3 group arise at 1375.41. This peak in the present study appears at 1375.47 (CH3 bending vibration).
Peaks at the wavelengths of 1490 cm−1 (aromatic ring stretch), 755 cm−1, and 695 cm−1 (aromatic CH out-of-plane bend) are similar to the FTIR PS standard.27 The absorption peak at wavenumber 3024.84 is due to aromatic C–H stretching vibration while absorption peaks at the wave number 2849.18 cm−1 corresponds to the existence of –CH3 stretching frequencies. The peaks over 2800–3100 cm−1 are attributed to C–H stretching vibrations in the main chain.28 The three absorption bands at 1601.19 cm−1, 1492.53 and 1451.93 cm−1, are due to aromatic C![[double bond, length as m-dash]](https://www.rsc.org/images/entities/char_e001.gif) C ring stretching vibration absorption. The absorption at 1025.80 cm−1 in the present study corresponds to the aromatic deformation and skeletal vibrations of C–H of PS MPs. Moreover, the absorption at 698.85 cm−1 in the present study corresponds to C–H out-of-plane bending vibration and indicates that there is only one substituent in the benzene ring. Peaks ranged from 1326.90 and 1248.92 cm−1 in the present study assigned to CH bending of CHCl group that corresponds to CH bending frequency and indicates the presence of PVS polymer. The second band region with absorption band at 1075.25 cm−1 represents C–C bond stretching frequency observed in the present study. The third region called the C–Cl stretching band in the range of 700–600 cm−1 was observed at 612.17 cm−1 in the present study. All these regions were identified in the samples analyzed by ATR-FTIR (Table SI 13†) showed the absorption band ranges and the functional groups for the PET. The stronger absorption band found at 1713.37 cm−1 in the present study is due to the stretching vibration of the CO bond of the ester group. Furthermore, two bands were observed for the C–O stretching bond at 1240.31 cm−1 & 1091.92 cm−1. The absorption band at 721.34 cm−1 corresponds to the ring out-of-plane deformation of the C–H group. Bands of PET in present study are assigned to the ring vibrations except for 730 cm−1 (721.34 cm−1 in present case) as it’s not clear in the literature.25,26,29
C ring stretching vibration absorption. The absorption at 1025.80 cm−1 in the present study corresponds to the aromatic deformation and skeletal vibrations of C–H of PS MPs. Moreover, the absorption at 698.85 cm−1 in the present study corresponds to C–H out-of-plane bending vibration and indicates that there is only one substituent in the benzene ring. Peaks ranged from 1326.90 and 1248.92 cm−1 in the present study assigned to CH bending of CHCl group that corresponds to CH bending frequency and indicates the presence of PVS polymer. The second band region with absorption band at 1075.25 cm−1 represents C–C bond stretching frequency observed in the present study. The third region called the C–Cl stretching band in the range of 700–600 cm−1 was observed at 612.17 cm−1 in the present study. All these regions were identified in the samples analyzed by ATR-FTIR (Table SI 13†) showed the absorption band ranges and the functional groups for the PET. The stronger absorption band found at 1713.37 cm−1 in the present study is due to the stretching vibration of the CO bond of the ester group. Furthermore, two bands were observed for the C–O stretching bond at 1240.31 cm−1 & 1091.92 cm−1. The absorption band at 721.34 cm−1 corresponds to the ring out-of-plane deformation of the C–H group. Bands of PET in present study are assigned to the ring vibrations except for 730 cm−1 (721.34 cm−1 in present case) as it’s not clear in the literature.25,26,29
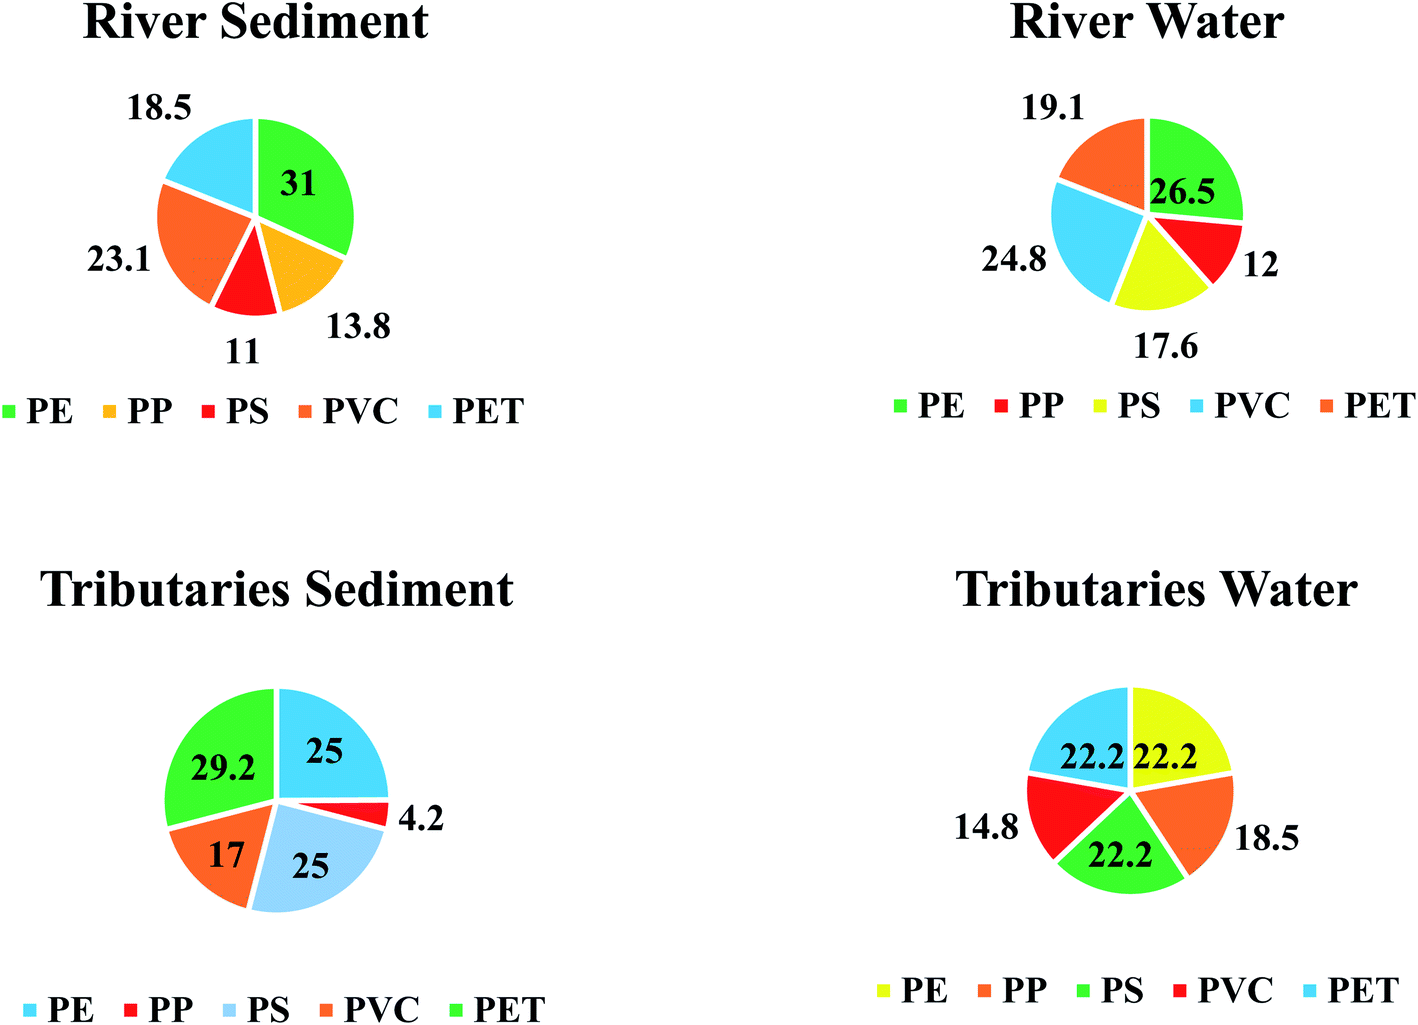
3.3.1 ATR-FTIR results of river sediment samples. On the basis of ATR-FTIR results a total 182 suspected MPs items in river sediment samples were identified on optical microscopy and only 65 (35.71%) items were confirmed to be polymer types i.e., PE, PP, PS, PVC and PET. Among these PE was the most dominant type of polymer found with 31% abundance followed by PVC, PET, PP and PS sharing 23.10%, 18.50%, 13.84% and 11%, respectively (Fig. 11). While in urban samples, 39.70% were found to be polymer type and 60.30% were listed as “Others”. In case of non-urban samples of river sediment 25.50% items were polymer types (PE, PP, PS, PVC and PET) while 74.50% were non-plastic (see Table SI 13†). Portions of MPs not identified as polymers were excluded and % abundance of each verified polymer (PE, PP, PS, PVC and PET) was recalculated and illustrated in Fig. 11.
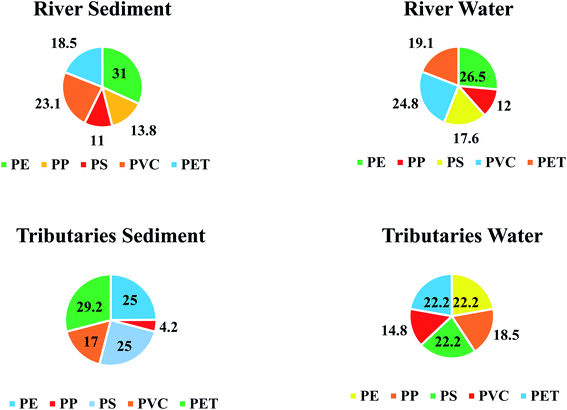 |
| | Fig. 11 Percent abundance of each polymer type identified in all urban and non-urban matrices (river sediment and water, tributaries sediment and water) on the basis of ATR-FTIR results. | |
3.3.2 ATR-FTIR results of river water samples. In river water samples, out of 192 identified MPs, 65 (33.85%) items were polymers based on their functional groups confirmed on ATR-FTIR while the rest 127 (66.14%) were non polymers (others). Highest and lowest polymer types were PE (26.50%) and PP (12%) respectively (Fig. 11). In addition, only 35.6% (47/132) urban samples were polymers while 64.4% were non polymers (others). Station-wise results of water samples on the basis of ATR-FTIR are listed in Table SI 13.†
3.3.3 ATR-FTIR results of tributaries sediment samples. In tributary sediment samples, 88.11% (178/202) were polymers while 11.9% (24/202) was listed as “others”. Types of polymers identified based on percent abundance was PE (29.20%), PET (25%), PS (25%), PVC (17%) and PP (4.20%) (Fig. 11). In urban tributaries, 88.72% (118/133) items were polymers while 11.3% were “others” and in non-urban samples, percentage of polymers was 91.3% (63/69) and “others” was 8.7%, respectively (Table S1.14†).
3.3.4 ATR-FTIR results of tributaries water samples. In tributary water samples, 70.65% (65/92) MPs were identified as polymers in which PE, PP and PS share the same percentage abundance of 22.22%, as shown in Fig. 11. Percent abundance of PVC and PET was 18.51% and 14.81%, respectively (Fig. 11). Results of urban water samples shows that out of 46 suspected MPs, 37/46 (80.4%) were polymers while 9/46 (19.6%) were “Others”. In similar way, percent share of polymers and non-polymers in non-urban samples were 61% and 39%, respectively (Table S 13†).
4 Conclusions
MPs has been listed as an emerging xenobiotic pollutant and universal hazard for ecosystems. In present study the occurrence, abundance and spatial distribution of MPs in freshwater riverine sediment, water and Schizothorax plagiostomus was assessed along the SR system. Optical microscopy results demonstrated that MPs were present in different morphology, sizes and colors in sample matrices. MPs in the urban zone were found to be in a higher percentage as compared to non-urban samples except for tributary water samples. The numeric abundance of MPs was in descending order like tributaries sediment (202 items per kg) > river water (192 items per L) > river sediment (182 items per kg) > fish (153 items per fish) > tributaries water (92 items per L). The study found tributaries as one of the potential sources of MPs in the SR. Results of ATR-FTIR spectroscopy showed that PE (27%) was the most identified plastic type in all matrices while least detected was PP (12.5%). Out of 576 items, 32% were confirmed to be polymers (PE, PP, PS, PVC and PET) while 68% were listed as “Others” as they were not identified by ATR-FTIR. Pellets in present study were found to be the primary source (originated from daily personal care products, industrial preproduction pellets or from fragments that degraded and became small round pellets) of MPs pollution. Other MPs items found in present study were from secondary sources that include fibers, films, fragments and foam items. These items originated from fishing activities, landfilling or dumping sites, agriculture activities and food packaging. Possible sources of PE and PP were found to be fragments originating from littering and fishing tools. For instance MPs were found in all matrices of the study area indicating a potential threat to environmental and human health. The study provides useful and comprehensive information for the evaluation of the MPs' pollution and environmental risk in district Swat. Therefore, it emphasizes the importance of rivers as potential carriage systems of MPs. Monitoring of present study concludes that freshwater fish is extremely vulnerable to MPs pollution and that urbanized areas appear to be a major factor contributing to the pollution of freshwater environments with MPs.
Abbreviations
| ATR-FTIR | Attenuated total reflectance Fourier transform infrared |
| FWRs | Freshwater rivers |
| GPS | Global positioning system |
| H2O2 | Hydrogen peroxide |
| KPK | Khyber Pakhtunkhwa |
| L | Liter |
| mL | Milliliters |
| mm | Millimeter |
| MPs | Microplastics |
| PCSIR | Pakistan Council of Scientific and Industrial Research |
| PE | Polyethylene |
| PET | Polyethylene terephthalate |
| PP | Polypropylene |
| PS | Polystyrene |
| PVC | Polyvinyl chloride |
| S1 | Size 1 (S1: 0.5–1 mm) |
| S2 | Size 2 (S1: 1–5 mm) |
| SR | Swat river |
| Tr. | Tributaries |
| Z1 | Zone 1 |
| Z2 | Zone 2 |
| ZnCl2 | Zinc chloride |
Author contributions
The role of all authors in present study is as follows: M. I. Z., H. F., T. U.-R. and A. W. designed, conceived, and supervised the complete study. L. Q., S. G. and M. I. Z. experimented, analyzed the data and helped in compiling the results. A. W., H. H. and A. A. assisted in FTIR analysis of all types of microplastics and facilitated in the interpretation of FTIR results. M. I. Z., L. Q. and S. G. wrote the 1st draft of manuscript. M. I. Z., H. F., H. H. and A. A. made a substantial contribution to the interpretation of data and revising the manuscript for intellectual content. All authors read and approved the final manuscript.
Conflicts of interest
The authors declared that they have no known competing financial interests or personal relationships that could have appeared to influence this research work.
Acknowledgements
The authors would like to express their high indebtedness to Higher Education Commission (HEC) of Pakistan for providing financial support under NRPU program Grant#: 9139/Federal/NRPU/HEC as well as University Research Funds (URF) for performing present research work in terms of designing, samples collection and their analysis.
References
- Plastics – the Facts, an analysis of European plastics production, demand and waste data P. Europe, 2018, https://plasticseurope.org/wp-content/uploads/2021/10/2018-Plastics-the-facts.pdf, accessed 24 December 2021 Search PubMed.
- S. Lambert, C. Sinclair and A. Boxall, Rev. Environ. Contam. Toxicol., 2014, 227, 1–53 CAS.
- D. Lithner, Å. Larsson and G. Dave, Sci. Total Environ., 2011, 409(18), 3309–3324 CrossRef CAS PubMed.
- H. A. Abu-Qdais, M. A. Al-Ghazo and E. M. Alghazo, J. Environ. Sci. Manage., 2020, 6, 1–10 Search PubMed.
- J. J. Klemeš, Y. V. Fan, R. R. Tan and P. Jiang, Renewable Sustainable Energy Rev., 2020, 127 Search PubMed.
- E. R. Zettler, T. J. Mincer and L. A. Amaral-Zettler, Environ. Sci. Technol., 2013, 47, 7137–7146 CrossRef CAS PubMed.
- M. C. Goldstein, M. Rosenberg and L. Cheng, Biol. Lett., 2012, 8, 817–820 CrossRef PubMed.
- A. P. Majer, M. C. Vedolin and A. Turra, Mar. Pollut. Bull., 2012, 64, 1143–1147 CrossRef CAS PubMed.
- M. R. Gregory, Philos. Trans. R. Soc., B, 2009, 364(1526), 2013–2025 CrossRef PubMed.
- A. Getachew and F. Woldesenbet, BMC Res. Notes, 2016, 9(1), 1–9 CrossRef PubMed.
- S. K. Kale, A. G. Deshmukh, M. S. Dudhare and V. B. Patil, J. Biochem. Technol., 2015, 6, 952–961 CAS.
- R. T. Chan, C. J. Garvey, H. Marçal, R. A. Russell, P. J. Holden and L. J. R. Foster, Int. J. Polym. Sci., 2011, 2011, 247–267 Search PubMed.
- A. A. Koelmans, A. Bakir, G. A. Burton and C. R. Janssen, Environ. Sci. Technol., 2016, 50(7), 3315–3326 CrossRef CAS PubMed.
- M. Sinchembe and W. N. Ellery, Afr. J. Aquat. Sci., 2010, 35(3), 227–239 CrossRef.
- I. S. Dewi, A. A. Budiarsa and I. R. Ritonga, DEPIK Jurnal Ilmu-Ilmu Perairan, Pesisirdan Perikanan, 2015, 4(3), 121–131 Search PubMed.
- J. A. Smith, J. L. Hodge, B. H. Kurtz, and J. I. Garver, in Mohawk Watershed Symposium, 2017 Search PubMed.
- R. C. Thompson, Y. Olsen, R. P. Mitchell, A. Davis, S. J. Rowland, A. W. John and A. Russell, Science, 2004, 304(5672), 838 CrossRef CAS PubMed.
- V. Hidalgo-Ruz, L. Gutow, R. C. Thompson and M. Thiel, Environ. Sci. Technol., 2010, 46(6), 3060–3075 CrossRef PubMed.
- G. Liebezeit and F. Dubaish, Bull. Environ. Contam. Toxicol., 2012, 89(1), 213–217 CrossRef CAS PubMed.
- H. K. Imhof, J. Schmid, R. Niessner, N. P. Ivleva and C. Laforsch, Limnol. Oceanogr.: Methods, 2012, 10(7), 524–537 CrossRef CAS.
- A. L. Lusher, M. Mchugh and R. C. Thompson, Mar. Pollut. Bull., 2013, 67(1–2), 94–99 CrossRef CAS PubMed.
- C. G. Avio, S. Gorbi and F. Regoli, Mar. Environ. Res., 2015, 111, 18–26 CrossRef CAS PubMed.
- J. Li, X. Qu, L. Su, W. Zhang, D. Yang, P. Kolandhasamy and H. Shi, Environ. Pollut., 2016, 214, 177–184 CrossRef CAS PubMed.
- J. Charles, Asian J. Chem., 2016, 21(6), 4477 Search PubMed.
- R. Chércoles Asensio, M. San Andrés Moya, J. M. de la Roja and M. Gómez, Anal. Bioanal. Chem., 2009, 395(7), 2081–2096 CrossRef PubMed.
- I. Noda, A. E. Dowrey, J. L. Haynes and C. Marcott, in Physical Properties of Polymers Handbook, ed. J. E. Mark, Springer Science + Business Media LLC, New York, 2007, pp. 395–406 Search PubMed.
- A. Mataji, M. S. Taleshi and E. Balimoghaddas, Arch. Environ. Contam. Toxicol., 2020, 78(1), 86–93 CrossRef CAS PubMed.
- C. D. Dong, C. W. Chen, Y. C. Chen, H. H. Chen, J. S. Lee and C. H. Lin, J. Hazard. Mater., 2020, 385, 121575 CrossRef CAS PubMed.
- A. A. El-Saftawy, A. Elfalaky, M. S. Ragheb and S. G. Zakhary, Radiat. Phys. Chem., 2014, 102, 96–102 CrossRef CAS.
Footnote |
| † Electronic supplementary information (ESI) available. See DOI: 10.1039/d2ra00319h |
|
| This journal is © The Royal Society of Chemistry 2022 |
Click here to see how this site uses Cookies. View our privacy policy here. 
 Open Access Article
 This Open Access Article is licensed under a Creative Commons Attribution-Non Commercial 3.0 Unported Licence
 a,
Mazhar Iqbal Zafar
a,
Mazhar Iqbal Zafar