
 Open Access Article
 This Open Access Article is licensed under a
 Creative Commons Attribution 3.0 Unported Licence
Structural alterations of branched versus linear mixed-surfactant micellar systems with the addition of a complex perfume mixture and dipropylene glycol as cosolvent†
Marzieh Mirzamani a,
Marc Flickingerb,
Arnab Dawna,
Vinod Aswalc,
Boualem Hammoudad,
Ronald L. Jonesd,
Edward D. Smithb and
Harshita Kumari*a
a,
Marc Flickingerb,
Arnab Dawna,
Vinod Aswalc,
Boualem Hammoudad,
Ronald L. Jonesd,
Edward D. Smithb and
Harshita Kumari*a
aJames L. Winkle College of Pharmacy, University of Cincinnati, Cincinnati, OH 45219-0004, USA. E-mail: kumariha@ucmail.uc.edu
bThe Procter & Gamble Company, 8700 Mason Montgomery Road, Mason, OH 45040, USA
cBhabha Atomic Research Center, Mumbai, Maharashtra, India
dNIST Center for Neutron Research, National Institute of Standards and Technology, 100 Bureau Drive, Gaithersburg, MD 20899-6102, USA
First published on 17th May 2022
Abstract
Personal care products commonly contain perfume mixtures, consisting of numerous perfume raw materials (PRMs), and cosolvents. The lipophilicity and structure of an individual PRM is known to affect its localization within the surfactant self-assembly as well as the micellar geometry. However, because multiple PRMs are used in formulations, significant intermolecular interactions between the PRMs and between the PRMs and the surfactant tail may also influence the location of the PRMs and their effects on the self-assembly. Herein, two anionic/zwitterionic mixed-surfactant systems (sodium trideceth-2 sulfate (ST2S)/cocamidopropyl betaine (CAPB) and sodium laureth-3 sulfate/CAPB) were formulated with a cosolvent (dipropylene glycol (DPG)) and 12 PRMs of varying structures and lipophilicities. This 12 PRM accord is simpler than a fully formulated perfume but more complex than a single perfume molecule. The geometric variations in the self-assemblies were evaluated using small-angle neutron scattering, perfume head space concentrations were determined using gas chromatography-mass spectrometry, and perfume localization was identified using NMR spectroscopy. The addition of the perfume accord caused enlargement of the micelles in both surfactant systems, with a greater change observed for ST2S/CAPB formulations. Furthermore, the addition of DPG to ST2S/CAPB resulted in micelle shrinkage. The micelle geometries and PRM localization in the micelles were affected by the degree of branching in the surfactant tail.
Introduction
Odiferous molecules are ubiquitous in everyday life; they are used in foods to enhance flavor; in house-cleaning products, cosmetics and perfumery, and personal care products to impart pleasant aromas; in cleansers when added as an essential oil; and in aromatherapy for beneficial psychological effects.1–4 Because fragrance is a primary factor in consumer purchasing choice5,6 and requires the use of expensive ingredients, efficient ingredient deposition onto surfaces is crucial to minimize product loss during rinse-off.Perfumes are commonly classified by their functional groups, such as aldehydes, alcohols, and phenols, and by their log![[thin space (1/6-em)]](https://www.rsc.org/images/entities/char_2009.gif) P values, which denote the lipophilicity or hydrophilicity of a perfume raw material (PRM).1,2 Their inherent high volatility, hydrophobicity, and susceptibility to oxidation upon storage render formulation rather difficult. Methods such as spray drying, extrusion, coacervation, and emulsification are used to appropriately encapsulate and release perfumes from colloidal domains. Gas chromatography-mass spectrometry (GC-MS) is traditionally used to assess the correlation between the logP values of perfumes and their release profile. However, ambiguity about the colloidal domains of formulations complicates such analyses.
P values, which denote the lipophilicity or hydrophilicity of a perfume raw material (PRM).1,2 Their inherent high volatility, hydrophobicity, and susceptibility to oxidation upon storage render formulation rather difficult. Methods such as spray drying, extrusion, coacervation, and emulsification are used to appropriately encapsulate and release perfumes from colloidal domains. Gas chromatography-mass spectrometry (GC-MS) is traditionally used to assess the correlation between the logP values of perfumes and their release profile. However, ambiguity about the colloidal domains of formulations complicates such analyses.
This complexity is compounded by the use of numerous PRMs to generate a fragrance within a formulation. As the fragrance is generated based on a complex PRM mixture, the relationship of the fragrance with the overall formulation is not straightforward.3 Our previous work with a 3 PRM accord in a mixed-surfactant system with a cosolvent7 revealed that surfactant, cosolvent, and oil combinations were not conducive to the formation of single-phase microemulsions. NMR analysis showed that the 3 PRMs were preferentially localized within the micelle core, regardless of their lipophilicities, indicating that perfume–perfume interactions strongly influence the location of a PRM within a surfactant self-assembly. Additionally, small-angle neutron scattering (SANS) measurements showed that increasing the concentration of the 3 PRM accord caused continual growth of the self-assemblies, which maintained spherical or ellipsoidal geometries at high surfactant concentrations. This behavior contrasts with the planar, vesicular, or worm-like structures that are expected to form based on the lipophilicities and molecular structures of specific PRMs in the system. Hence, in the present work, we created a more complex perfume accord consisting of 12 PRMs with various structures and physical properties, which approaches the complexity of a full perfume formulation and has a good presence in the headspace. It is envisioned that this approach will advance the understanding of how an actual perfume mixture influences the aggregation properties of rinse-off systems at concentrations that better reflect those of personal care products, and whether the PRMs are again preferentially localized somewhere within the surfactant self-assembly.
Specifically, we studied the location of the 12 PRMs and the colloidal domains in two mixed-surfactant systems: sodium trideceth-2 sulfate (ST2S)/cocamidopropyl betaine (CAPB) and sodium laureth-3 sulfate (SLE3S)/CAPB. These surfactant systems were chosen as representative of the mixed-surfactant systems commonly used in personal care products for mildness. Moreover, these systems allowed us to expand upon our previous work7 by investigating the influence of surfactant structure (branched (ST2S) versus linear (SLE3S)) on perfume localization. Furthermore, we determined the concentration of each PRM in the headspace of each mixed-surfactant system. In addition, we investigated the effects of perfume concentration and the addition of a cosolvent (dipropylene glycol; DPG) on the mixed-surfactant systems. The addition of a cosolvent is of particular interest, as it reduces the cohesive energy density and dielectric constant of the medium by affecting polar intermolecular forces including hydrogen bonding.8,9 DPG is commonly used as a cosolvent in detergents, personal care products, and cosmetics owing to its low toxicity and high dielectric constant.8 It is also commonly used in perfumery as a solvent and diluent because of its high boiling point, transparency, and lack of odor. Although there are reports pertaining to the effect of cosolvent,8,10–13 perfume accords,2,14 and individual perfumes, in surfactant systems,15–17 information on the combined effects of a cosolvent and a perfume accord on a surfactant system is limited,14 likely because of the complexity associated with the use of multiple additives.
We used SANS to elucidate the size and shape of the self-assemblies in solution.18–22 In addition, we used NMR spectroscopy to investigate the location of the PRMs and GC-MS to study perfume release from the formulations. The use of a moderately complex formulation and perfume accord allowed for a more realistic investigation of how a fragrance composition consisting of multiple PRMs affects the structure of the self-assemblies.
Methods
Sample preparation
All raw materials were provided by Procter & Gamble. In total, eight samples were tested. The compositions of the SANS and NMR samples are detailed in Table 1. The GC-MS samples had the same compositions, except that only H2O was used instead of H2O/D2O mixtures. The first five samples contained ST2S, a branched-tail surfactant, and the remaining three samples contained SLE3S, a linear-tail surfactant. In addition to these primary surfactants, each system also included CAPB. The surfactant structures are shown in Scheme 1. Samples 1–3 and 6–8 had increasing amounts of the perfume accord, whereas samples 2, 4, and 5 had increasing amounts of DPG and a constant 0.5 wt% perfume accord. The perfume accord used in this study consisted of 12 PRMs, chosen to cover a wide range of logP values and molecular structures (Table 2).
| Component (wt%) | ||||||||
|---|---|---|---|---|---|---|---|---|
| Material | Sample 1 | Sample 2 | Sample 3 | Sample 4 | Sample 5 | Sample 6 | Sample 7 | Sample 8 |
| Sodium trideceth-2 sulfate (ST2S) | 6.402 | 6.402 | 6.402 | 6.402 | 6.402 | — | — | — |
| Sodium laureth-3 sulfate (SLE3S) | — | — | — | — | — | 6.750 | 6.750 | 6.750 |
| Cocamidopropyl betaine (CAPB) | 1.098 | 1.098 | 1.098 | 1.098 | 1.098 | 0.750 | 0.750 | 0.750 |
| Citric acid | 0.110 | 0.110 | 0.110 | 0.110 | 0.110 | 0.110 | 0.110 | 0.110 |
| Dipropylene glycol (DPG) | 0.000 | 0.000 | 0.000 | 1.500 | 3.000 | 0.000 | 0.000 | 0.000 |
| Perfume | 0.000 | 0.500 | 1.000 | 0.500 | 0.500 | 0.000 | 0.500 | 1.000 |
| H2O | 7.009 | 6.509 | 6.009 | 7.509 | 6.009 | 27.670 | 27.170 | 26.670 |
| D2O | 85.381 | 85.381 | 85.381 | 82.881 | 82.881 | 64.720 | 64.720 | 64.720 |
 | ||
| Scheme 1 Surfactant structures: (1) sodium trideceth-2 sulfate (ST2S), (2) sodium laureth-3 sulfate (SLE3S), and (3) cocamidopropyl betaine (CAPB). The tested samples contained either a mixture of ST2S and CAPB (ST2S/CAPB, branched-tail surfactant system) or a mixture of SLE3S and CAPB (SLE3S/CAPB, linear-tail surfactant system). | ||
| Material | Structure | Content (wt%) | Molecular weight (g mol−1) | clogP |
|---|---|---|---|---|
| Benzyl acetate |  |
5 | 150.18 | 1.7 |
| Dihydromyrcenol | 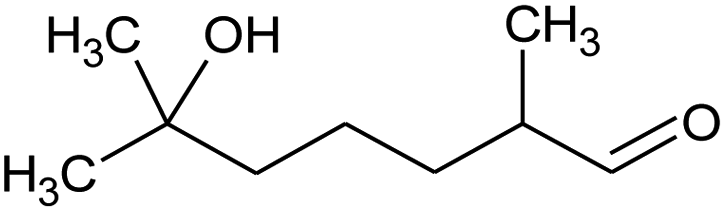 |
10 | 156.3 | 3.08 |
| Phenylethyl alcohol | 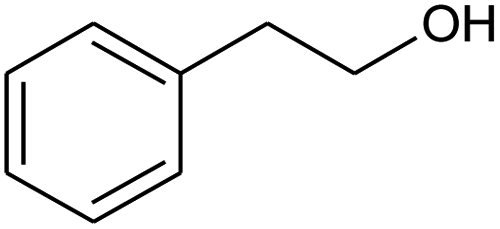 |
5 | 122.17 | 1.32 |
| Florosa Q (pyranol) |  |
5 | 172.3 | 2.46 |
| β-Ionone |  |
10 | 192.3 | 4.02 |
| Undecavertol |  |
10 | 170.3 | 3.06 |
| Ambrox (Ambronat) |  |
5 | 236.4 | 4.58 |
| Heliotropin | 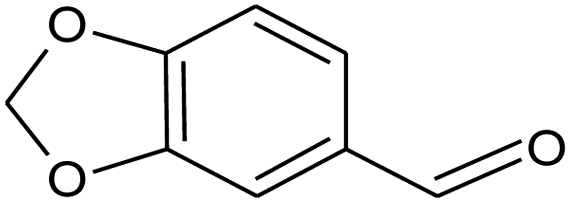 |
5 | 150.1 | 1.43 |
| γ-Decalactone | 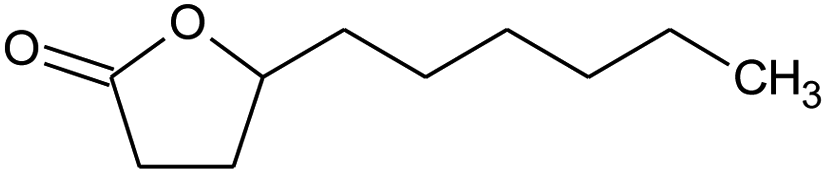 |
10 | 170.2 | 3.23 |
| Methyl dihydrojasmonate | 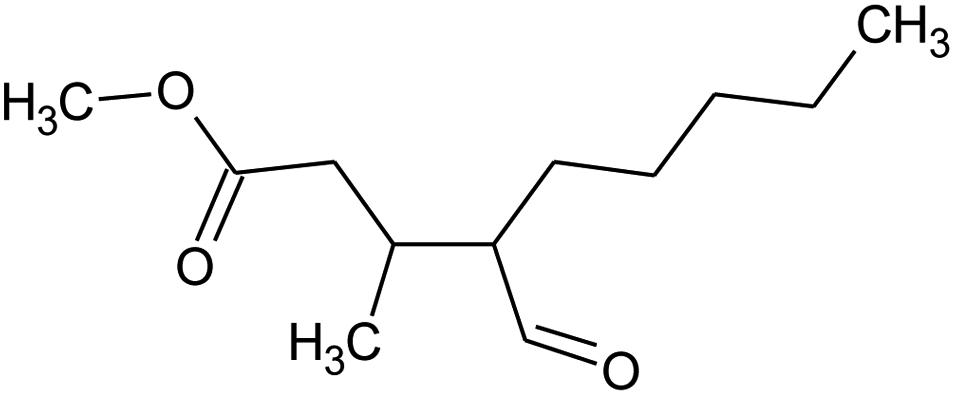 |
15 | 226.3 | 3.01 |
| Hexyl cinnamic aldehyde | 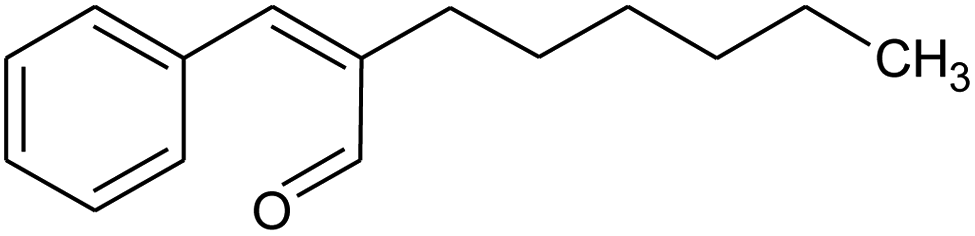 |
10 | 216.3 | 4.3 |
| Galaxolide (hexamethylindanopyran) |  |
10 | 258.4 | 5.43 |
SANS studies
SANS studies were conducted at the NIST Center for Neutron Research (NCNR) in Gaithersburg, MD. In the SANS samples (Table 1), D2O was used to maximize the contrast between the solvent and the micelles. However, because the surfactants all included known amounts of H2O, the solvent phase was mostly D2O mixed with some H2O. Samples 1–3 were run on the 30 m NG7-SANS beam line, whereas samples 4–8 were run on the 10 m NGB-SANS beam line, which is operated as part of the nSoft Consortium. The samples were placed in titanium cell holders with quartz windows, which were separated by a 1 mm sample gap. Different neutron wavelength (λ) and sample-to-detector distance (SDD) configurations were used to achieve the desired q-range, where the scattering vector q = (4π/λ)sin(θ/2) and θ is the scattering angle. Samples 1–3 were irradiated with neutrons of wavelength λ = 6 Å at SDDs of 1 m (high-q configuration) and 4 m (mid-q configuration), and with neutrons of wavelength λ = 8.09 Å at an SDD of 15.3 m (low-q configuration) to cover a wide q-range of 0.0027–0.5568 Å−1. The data collection times were 5 min, 20 min, and 1 h for the high-, mid-, and low-q ranges, respectively. For samples 4–8, the high-q configuration was λ = 5 Å with an SDD of 1.2 m, the mid-q configuration was λ = 5 Å with an SDD of 4.6 m, and the low-q configuration was λ = 12 Å and an SDD of 4.6 m, which covered a q-range of 0.00318–0.5666 Å−1. The data collection times were 10, 20, and 45 min for the high-, mid-, and low-q ranges, respectively. All sample data were collected at 25 °C.
Using the data reduction macros developed for Igor Pro by the NCNR,23 the data were reduced by correcting for background scattering, detector resolution and sensitivity, and beam transmission. Then, the data were radially averaged to obtain the absolute scattering intensity, I(q). The high-, mid-, and low-q data were combined to obtain the complete data set. Each data set was analyzed in SasView 5.0 ref. (24) using the smeared-resolution ellipsoid form factor coupled with the Hayter–Penfold rescaled mean spherical approximation (MSA) structure factor model to account for electrostatic effects. The equations used for the ellipsoid form factor in SasView are given by Feigin and Svergun.25 The equations describing the structure factor were developed by Hayter and Penfold26 and by Hansen and Hayter.27 A polydispersity term was included in the model for the equatorial radius (Re, perpendicular to the axis of rotation) using a Schulz distribution. Finally, the decoupling approximation, which was developed by Hayter and Penfold28 and discussed further by Kotlarchyk and Chen29 to correct for errors in the structure factor calculation caused by polydispersity and nonsphericity, was also used in modeling the data.
The magnitudes of the polar radius (Rp, parallel to the axis of rotation) and Re in the ellipsoid model determine whether the ellipsoid is oblate or prolate. For Re > Rp, the ellipsoid is oblate (disc-like); for Rp > Re, the ellipsoid is prolate (melon-shaped); and for Rp = Re, the ellipsoid is spherical. The data were modeled using both the oblate and prolate ellipsoid cases, and which type of ellipsoid best described the data was determined based on the minimized residuals and the visual fit quality. Particular attention was paid to minimizing the residuals in the high-q region, as this region is most sensitive to the form factor and least affected by the structure factor. If both cases fit the data similarly, then the model with the smallest sqrt(χ2/N) was chosen as the best fit. The solvent scattering length density (SLD) was calculated and fixed based on the weighted average of D2O, H2O, citric acid, and DPG in each sample. The micelle (i.e., particle) SLDs were also calculated and fixed to the weighted average of the primary surfactant (i.e., ST2S or SLE3S), CAPB, and the perfume accord, if applicable. To simplify the SLD calculations, an average molecular formula and density were calculated for the perfume accord based on the weighted average of its components. The SLDs for the solvents and micelles as well as the parameters used to calculate them can be found in the ESI.†
GC-MS studies
GC-MS samples were prepared at room temperature two days before analysis to allow for equilibration. The components were added in the following order: ST2S or SLE3S, CAPB with 3 wt% citric acid, DPG, water, and the PRM accord. The sample was then vortexed until the components were thoroughly blended and set aside until testing. The GC-MS data were obtained using an Agilent Model 6890 gas chromatograph fitted with a Gerstel MPS-2 autosampler, a 0.75 mm ID SPME injection port liner (Supelco, Bellefonte, PA, USA), and a J&W DB5-MS GC column with an ID of 30 m × 0.25 mm and a film thickness of 1.0 μm (Agilent Technologies, Inc., Wilmington, DE, USA). The detector was a Model 5973 mass selective detector (Agilent Technologies, Inc., Wilmington, DE, USA) with a source temperature of approximately 230 °C and a MS Quad temperature of approximately 150 °C. Ultra-pure helium was used as the carrier gas with a flow rate of 1 mL min−1.Each sample (3 g) was placed in a clean 20 mL headspace vial with a magnetic stir bar. After the vials were closed with PTFE septum caps, the samples were stirred and allowed to equilibrate at room temperature for at least 30 min. The sample vials were then placed in an autosampler tray. Each sample vial was automatically placed in the sampling chamber, where it equilibrated at 30 °C for 1 min. The sampling time was 1 min., during which the sample was stirred at 500 rpm and taken up by a 50/30 μm, 24 ga, 1 cm long DVB/CAR/PDMS SPME fiber assembly. The sample was injected at 270 °C, and the GC-MS analysis was begun after allowing the sample to desorb from the SPME assembly for 5 min. The temperature was initially held at 50 °C for 30 s, and then increased to 275 °C at a rate of 8 °C min−1 and held for 2.5 min. The individual PRMs were identified using MS spectral libraries from John Wiley & Sons and the National Institute of Standards and Technology, which were purchased and licensed through Agilent. The chromatographic peaks of specific ions were integrated using the MassHunter software (Agilent Technologies, Inc., Wilmington, DE, USA).
NMR studies
1H-NMR spectroscopy was performed using a Bruker AV 400 MHz spectrometer (Billerica, MA, USA). The NMR samples were prepared 3 days before analysis using D2O as the solvent. The H2O peak at 4.69 ppm was used as a reference for data analysis.Results and discussion
Effect of 12 PRM accord addition
Mixed micelles composed of a primary surfactant (ST2S or SLE3S) and a secondary surfactant (CAPB) will form because the total surfactant concentration of 7.5 wt% is above the critical micelle concentration. The hydrophobic PRM accord is expected to localize within the micelles, while DPG is expected to primarily locate in the aqueous phase based on literature.8 The SANS data modeling results are summarized in Table 3 and the individual fitting parameters for each sample are available in the ESI.† The SANS fitting results in Table 3 show how the micelle radii and volumes of the ST2S and SLE3S systems vary with the perfume content, and Fig. 1 shows an overlay of the SANS data and the model fits as functions of perfume concentration and mixed-surfactant system.| Surfactant tail structure | Perfume concentration (wt%) | Calculated vol. fraction | Vol. fraction (SANS) | Rp (Å) | Re (Å) | Volume (Å3) |
|---|---|---|---|---|---|---|
| Branched | 0 | 0.07 | 0.08 | 54.82 | 18.21 | 76140.5 |
| 0.5 | 0.07 | 0.10 | 66.86 | 18.70 | 97936.5 |
|
| 1 | 0.08 | 0.11 | 68.20 | 19.43 | 107856 |
|
| Linear | 0 | 0.07 | 0.08 | 41.08 | 22.91 | 90316.9 |
| 0.5 | 0.07 | 0.08 | 42.95 | 23.23 | 97084.6 |
|
| 1 | 0.08 | 0.09 | 44.68 | 23.99 | 107711.5 |
 | ||
| Fig. 1 SANS data overlays for branched-tail (red, solid symbols) and linear-tail (blue, empty symbols) mixed surfactant systems as a function of perfume concentration. The data sets are offset to improve clarity, with the 0.5 and 1 wt% perfume curves offset from the 0 wt% perfume curve by powers of 1.5, and the blue curves offset from the red curves by an additional factor of 20. The solid black lines are the model fits to the data. | ||
Effect of DPG addition
The self-assembly volume fractions determined by SANS were generally similar to the volume fractions calculated from the amount of each component expected to be in the dispersed phase (ST2S or SLE3S, CAPB, and perfume). However, once perfume was added to the ST2S/CAPB system, the volume fraction from SANS was somewhat higher than expected, as if the perfume added disproportionately more volume to the dispersed phase. This behavior suggests that the perfume formed a small droplet surrounded by surfactant monomers in the core of the ST2S/CAPB micelle instead of being solubilized by the surfactant tails, as presumed to occur in the SLE3S/CAPB system. As Rp > Re for the branched-tail and linear-tail mixed-surfactant systems, prolate ellipsoids were formed for both systems. Interestingly, the size and geometry of the ST2S/CAPB micelles were more strongly affected by perfume addition than those of the SLE3S/CAPB micelles. Specifically, Rp increased for both systems as perfume was added, sharply increasing in the ST2S/CAPB system but gradually increasing in the SLE3S/CAPB system, whereas Re remained virtually constant in both systems. As a result, the volume change of the ST2S/CAPB micelles upon perfume addition was larger than that of the SLE3S/CAPB micelles.As perfume accords are water-insoluble, surfactant micelles are required for solubilization in aqueous environments. The ST2S surfactant forms smaller micelles because the branched-tail structure causes the alkyl chains to pack differently in the core than the linear chains of SLE3S.30 This packing is reflected in the Rp values, which show that the tails pack together to form elongated micelles in the ST2S/CAPB system. The tails may not be packed quite as tightly along the long axis of the micelle, which could allow the micelle to elongate further as perfume is taken up. Because of its longer linear-tail and extended head group, the SLE3S monomer is longer than the ST2S monomer, which explains why the SLE3S/CAPB micelles expand more gradually with perfume addition than the ST2S/CAPB micelles. When the 3 PRM accord and the present 12 PRM accord were added to a concentrated ST2S/CAPB system, self-assembly began with the formation of spherical structures that enlarged and eventually formed oblate ellipsoids in both cases.7,31 Although the oil composition influences the extent to which a microemulsion can be diluted and the range of compositions which form microemulsions,31 the differences in size and geometry between the present work and our past work could be caused by a few key differences—namely, the total surfactant concentration (7.5 wt% versus 20–32.5 wt%, respectively), and the ratio of perfume:surfactant:DPG, or both.
Table 4 shows the change in the ST2S/CAPB volume fraction, micelle radii and volume with the addition of DPG, and Fig. 2 shows the overlay of the scattering data and model fits. The volume fractions calculated from the amounts of ST2S, CAPB, and perfume in the system were constant because the surfactant and perfume concentrations did not change; however, the volume fractions determined from SANS decreased from 0.10 to 0.07 as DPG was added. With respect to the micelle radii, although the micelles were prolate ellipsoids at all DPG concentrations (Rp > Re), the micelles became less elongated with the addition of DPG owing to a decrease in Rp. Specifically, the decrease in micelle volume as a function of DPG concentration was due to shrinkage along one axis (Rp), resulting in less elongated micelles. Notably, this trend is contrary to that obtained with perfume addition. The change in Re with DPG addition was small, as also observed upon perfume addition. DPG aids in solubilizing the perfume oil in the continuous phase, which explains the decreases in the volume fraction, micelle radii, and micelle volume, as less perfume needs to be solubilized inside the micelles. Recent work on the effects of DPG on the self-assembly of a cationic cetyltrimethylammonium tosylate (CTAT) system11 and a sodium laureth-1 sulfate (SLE1S)/CAPB system8 revealed that DPG reduces the micelle size. With DPG primarily located in the aqueous phase, the solvent dielectric constant is decreased, which increases electrostatic repulsions between the head groups, resulting in shrinkage of the micelle radius through an increase in the curvature of the micelle surface.8 Apparently, the known effects of DPG still apply to the overall perfume accord, despite its complexity.
| DPG concentration (wt%) | Calculated vol. fraction | Vol. fraction (SANS) | Rp (Å) | Re (Å) | Volume (Å3) |
|---|---|---|---|---|---|
| 0 | 0.07 | 0.10 | 66.86 | 18.70 | 97936.5 |
| 1.5 | 0.07 | 0.08 | 45.74 | 19.25 | 71002.7 |
| 3 | 0.07 | 0.07 | 40.88 | 18.89 | 61082.7 |
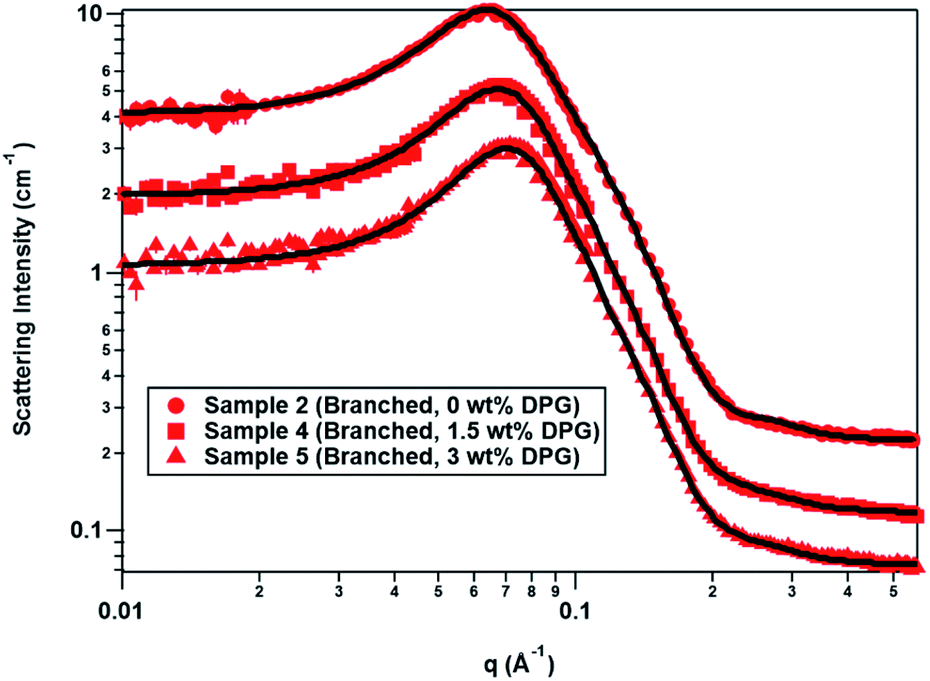 | ||
| Fig. 2 SANS data overlays for the branched-tail mixed surfactant system as a function of DPG concentration. The data sets are offset to improve clarity, with the 1.5 and 3 wt% DPG curves offset from the 0 wt% DPG curve by powers of 2/3. The solid black lines are the model fits to the data. Location of perfume accord in micelles. | ||
As noted above, the geometry and sizes of the colloidal domain in this work differ from those in our previous work.31 The 5 branched-tail mixed micelle systems studied in this work can be approximately located in the surfactant corner of the tertiary phase diagram at 90 wt% water (Fig. S1† in the ESI†) that was developed in our previous work,31 whereas the samples made as part of that work are located along the 1:1 surfactant:DPG line. This means that the 5 present samples contain more surfactant than the previous samples31 (7.5 wt% vs. 3.7–5 wt%), which is why there are also higher volume fractions of micelles in the present systems. Additionally, the amount of DPG in the current samples is overall lower than it was in the previous samples31 (0–3 wt% vs. 3.7–5 wt%), which further results in a surfactant:DPG ratio that is heavily skewed toward surfactant in this work. Here, the micelles not only shrank with DPG concentration, but also the aspect ratio decreased so that the micelles became less prolate; in comparison, the structures observed in our previous work31 were oblate ellipsoids. This could suggest that the surfactant:DPG ratio, in addition to the overall DPG concentration, influences the micelle geometry as well as its size.
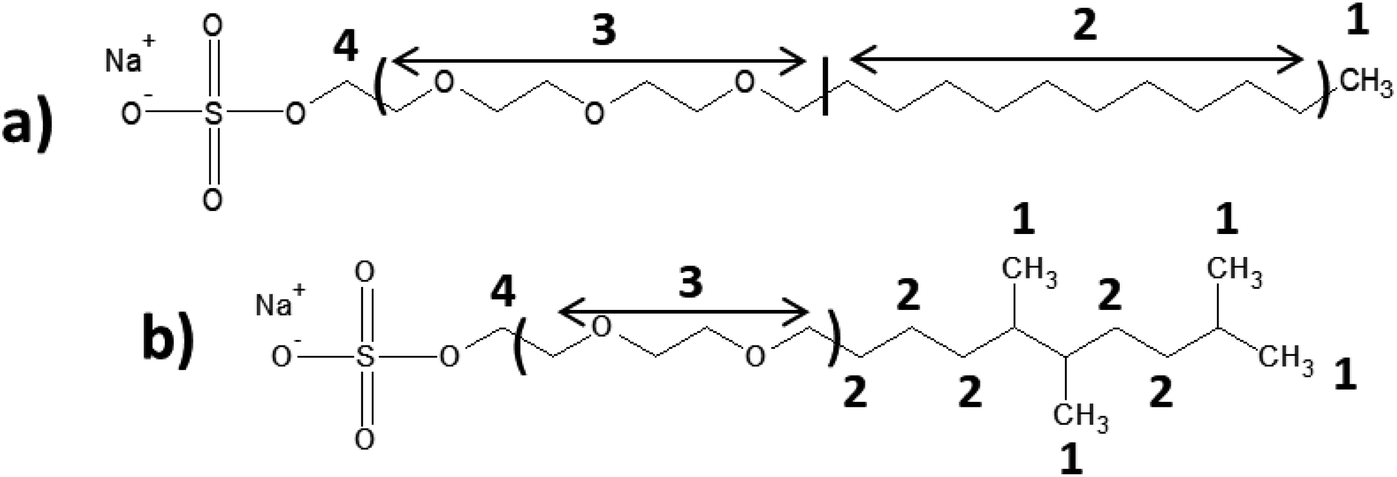
To obtain insights into perfume localization, we performed NMR studies on the mixed-surfactant systems in presence and absence of the PRM accord. The NMR peak shifts for the two surfactant systems with varying perfume concentrations were compared (Table 5 and Fig. S1†). The changes associated with each signal were small because of the very low perfume content. Nevertheless, these changes provided useful information about the preferential distribution of perfumes in the micelles.7 In the SLE3S/CAPB system, protons ‘1’, ‘2’, and ‘3’ exhibited shielding effects upon perfume addition, indicating the localization of the perfume molecules near these surfactant protons. Similar effects were observed in the ST2S/CAPB system, but the shielding effect was more prominent for hydrophobic protons ‘1’ and ‘2’ than the more hydrophilic proton ‘3’. This observation implies that the PRMs (irrespective of their individual logP values) are preferentially located near the micelle core. This finding is very similar to our recent results for a 3 PRM system,7 but the implication here is more significant, as the increased complexity in the system with 12 PRMs did not alter the perfume localization tendency. Furthermore, this finding differs from the behavior reported for individual PRMs in earlier studies.17,32,33 Apparently, the methyl group branches in the ST2S tail facilitate the retention of perfume molecules near the micelle core by creating an efficient hydrophobic pocket. Although Fieber et al. showed that the surfactant composition and molecular structure of cosurfactants influences the partitioning of perfume molecules,34 the collective findings from our previous 3 PRM system and the present 12 PRM system clarify the importance of the tail nature and conformation of the primary surfactant in driving the localization of PRM accords within micelles. In addition, weak (because of low PRM concentrations) intermolecular interactions among different PRMs become operative in mixtures. It is worth noting that the logP values of individual PRMs become less relevant in dictating the localization of PRMs in the micelle.
| Perfume concentration (wt%) | Peak shift (Δ ppm) | ||||
|---|---|---|---|---|---|
| 1 | 2 | 3 | 4 | ||
| SLE3S/CAPB | 0 | 0 | 0 | 0 | 0 |
| 0.50 | −0.01 | −0.01 | −0.01 | 0 | |
| 1 | −0.02 | −0.02 | −0.02 | 0 | |
| ST2S/CAPB | 0 | 0 | 0 | 0 | 0 |
| 0.50 | −0.01 | −0.01 | −0.01 | 0 | |
| 1 | −0.02 | −0.02 | −0.01 | 0 | |
 |
|||||
Perfume release from surfactant systems
To study how effectively each PRM was released from each mixed-surfactant system as a function of perfume accord concentration and DPG concentration, the headspace concentrations were measured using GC-MS (Fig. 3 and 4). The PRM headspace concentrations increased less than two-fold when the perfume concentration was doubled in each mixed-surfactant system, i.e., sample 2 versus sample 3 (Fig. 3a and b) and sample 7 versus sample 8 (Fig. 3c and d). Thus, the chemical activity of the PRMs increased as more perfume was added, resulting in the headspace concentrations increasing in accordance with Raoult's law. The headspace compositions did not change significantly with increasing perfume concentration for either surfactant system. The headspace compositions were dominated by the PRMs with intermediate logP values (2.0–3.5), followed by the highly hydrophilic PRMs and the highly lipophilic PRMs. The concentrations of the PRMs within each logP range varied greatly (e.g., dihydromyrcenol had the highest headspace concentration among the PRMs with intermediate logP values), suggesting that the molecular structure of the PRM must be considered in addition to its logP value when attempting to improve the headspace concentration.
 | ||
| Fig. 3 GC-MS headspace results as a function of perfume concentration: headspace concentrations for each PRM in (a) ST2S/CAPB and (c) SLE3S/CAPB systems; headspace composition of (b) ST2S/CAPB and (d) SLE3S/CAPB systems. The lipophilicity or hydrophilicity of each PRM is indicated by the color bar, with blue indicating that the PRM is hydrophilic, orange means the PRM is lipophilic, and green means it is intermediate. Within each column, the PRMs are ordered from lowest logP value (blue) to highest logP value (orange). The legend is below the color bar. In (b), there is a negligible amount of perfume in the headspace of the SLE3S/CAPB sample containing 0 wt% perfume owing to carry-over from the previously measured sample, and the corresponding headspace composition was omitted from (d) to prevent confusion. | ||
 | ||
| Fig. 4 GC-MS headspace results as a function of DPG concentration: (a) headspace concentrations for each PRM in ST2S/CAPB systems; (b) corresponding headspace compositions. The lipophilicity or hydrophilicity of each PRM is indicated by the color bar, with blue indicating that the PRM is hydrophilic, orange means the PRM is lipophilic, and green means it is intermediate. The legend is below the color bar. In each column, the PRMs are ordered from lowest logP value (blue) to highest logP value (orange). | ||
Fig. 4 shows the change in head space concentration and composition as the DPG concentration increased from 0 to 3 wt% (samples 2, 4, and 5). The total headspace concentration and the headspace concentrations of most PRMs increased upon DPG addition, despite the perfume concentration remaining constant. The headspace mainly consisted of PRMs with intermediate logP values (2.0–3.5), both in terms of the headspace concentration and the composition, followed by the highly hydrophilic PRMs and then the highly lipophilic PRMs. DPG addition caused the headspace concentration of each PRM to increase, but the relative ratio of the PRMs in the headspace remained constant, indicating that DPG addition did not preferentially improve the chemical activity of any particular PRM. The headspace concentration increasing without a significant change in its composition as DPG was added may have been caused by the micelles shrinking with DPG addition. Although the perfume is preferentially located in the center of the micelle based on the above NMR results, a smaller micelle would still have less volume in which the perfume could be solubilized. Therefore, as the micelles became smaller, the total amount of perfume the micelles could solubilize would also decrease; thus, the activities of every PRM would uniformly increase in kind, leading to the headspace concentration increasing without affecting the headspace composition.
The headspace concentrations of the PRMs within each logP range varied greatly (e.g., dihydromyrcenol had the highest headspace concentration among the PRMs with intermediate logP values), as was the case when the perfume concentration was increased. Interestingly, the PRMs with the highest headspace concentrations in the intermediate and lipophilic logP groups (dihydromyrcenol and β-ionone, respectively) had the lowest molecular weights within these groups. For the hydrophilic PRMs, phenylethyl alcohol had the lowest molecular weight, but benzyl acetate had a significantly higher headspace concentration. The only structural difference between these PRMs is an acetate group versus a –CH2OH group. Within each logP group, the differences in the relative concentrations of each PRM in the perfume accord alone cannot explain the significant variations in the headspace concentrations. These observations confirm that the molecular structure of the PRM is also important to consider for improving perfume release from rinse-off systems.
Conclusions
Past work on perfumes in surfactant systems has primarily focused on the effects of a single perfume molecule on the geometry of the surfactant self-assembly15,16 and where the perfume molecule localized within the assembly.17,33 In contrast, our previous work on a 3 PRM mixture investigated the effectiveness of the ST2S/CAPB mixed-surfactant system in creating single-phase microemulsions with perfume, the influence of perfume–perfume interactions on PRM localization within the self-assembly, and the effect of the perfume on the self-assembly.7The present work is more industry relevant and built upon our previous work by employing an even more complex 12 PRM accord, consisting of PRMs with various structures and clogP values; by comparing two different mixed-surfactant systems with branched or linear tails; and by considering the cosolvent (DPG) concentration as a variable. SANS modeling showed that the geometry of the mixed-surfactant self-assemblies remained the same despite the tail structure, with both systems forming prolate ellipsoids. Perfume addition caused the micelle volumes in both systems to increase, but the ST2S/CAPB micelles were more strongly affected. Upon DPG addition, the ST2S/CAPB micelles became smaller and less elongated while retaining a prolate ellipsoidal geometry, which is consistent with findings of Jiang et al.8 and Padasala et al.11 The GC-MS headspace results showed that the headspace concentrations of all the PRMs increased as the perfume concentration increased, and also that the headspace concentrations increased slightly when DPG was added at a constant perfume concentration. The logP values and the PRM molecular structures appear to be important variables that influence the headspace concentration of each PRM. NMR analysis showed that the perfume accord preferentially localized amongst the surfactant tails in the branched-tail surfactant system, whereas localization along the tail and ethoxy groups was observed in the linear-tail surfactant system. Thus, perfume molecule localization can be influenced by more variables than those identified by Fan et al.17 and Fischer et al.33 Perfume–perfume interactions and the surfactant tail structure appear to be responsible for this behavior. These results show that the surfactant molecular structure and the changes to the system properties caused by cosolvent and perfume addition influence the geometry of the dispersed phase structures. Additionally, the release of active ingredients, such as fragrance, can be improved or hindered by the molecular structures and degree of lipophilicity/lipophobicity of the components as well as the physical properties of the overall system.
Conflicts of interest
There are no conflicts to declare.Acknowledgements
Funding and materials provided by Procter & Gamble are greatly appreciated. Portions of this work were performed as part of the nSoft consortium, including the use of the 10 m SANS instrument. This work benefited from the use of the SasView application, originally developed under NSF Award DMR-0520547. SasView also contains code developed with funding from the EU Horizon 2020 program under the SINE2020 project (Grant No. 654000).References
- A. K. Pandey, P. Kumar, P. Singh, N. N. Tripathi and V. K. Bajpai, Essential Oils: Sources of Antimicrobials and Food Preservatives, Front. Microbiol., 2016, 7, 2161 Search PubMed.
- V. Tchakalova and W. Fieber, Classification of Fragrances and Fragrance Mixtures Based on Interfacial Solubilization, J. Surfactants Deterg., 2011, 15(2), 167–177 CrossRef.
- S. Herman, Fragrance in Emulsion and Surfactant Systems, Cosmet. Toiletries, 2006, 121(4), 59–67 CAS.
- K. Sowndhararajan and S. Kim, Influence of Fragrances on Human Psychophysiological Activity: With Special Reference to Human Electroencephalographic Response, Sci. Pharm., 2016, 84(4), 724–751 CrossRef CAS PubMed.
- D. Milotic, Impact of fragrance on consumer choice, J. Cust. Behav., 2003, 3(2), 179–191 Search PubMed.
- D. L. Berthier, I. Schmidt, W. Fieber, C. Schatz, A. Furrer, K. Wong and S. Lecommandoux, Controlled release of volatile fragrance molecules from PEO-b-PPO-b-PEO block copolymer micelles in ethanol–water mixtures, Langmuir, 2010, 26(11), 7953–7961 CrossRef CAS PubMed.
- M. Mirzamani, A. Dawn, V. K. Aswal, R. L. Jones, E. D. Smith and H. Kumari, Investigating the effect of a simplified perfume accord and dilution on the formation of mixed-surfactant microemulsions, RSC Adv., 2021, 11(42), 25858–25866 RSC.
- H. Jiang, G. Beaucage, K. Vogtt and M. Weaver, The effect of solvent polarity on wormlike micelles using dipropylene glycol (DPG) as a cosolvent in an anionic/zwitterionic mixed surfactant system, J. Colloid Interface Sci., 2018, 509, 25–31 CrossRef CAS PubMed.
- K. Holmberg, Hydrotropes Structure and Function, in Surfactant Science and Technology: Retrospects and Prospects, ed. Romsted L. S., CRC Press, Boca Raton, 2014, pp. 399–408 Search PubMed.
- S. Chavda and P. Bahadur, Thermodynamic Study of a Cationic Surfactant in Aqueous Solution Containing Ethylene Glycol and Its Oligomers: Effect of Number of Ethereal Oxygen Atoms in Glycols Molecule, J. Dispersion Sci. Technol., 2013, 34(1), 84–91 CrossRef CAS.
- S. Padasala, S. Chavda, D. Ray, V. K. Aswal and P. Bahadur, The effect of glycols and their ethers on micellar behavior of cetyltrimethylammonium tosylate, J. Mol. Liq., 2017, 242, 484–491 CrossRef CAS.
- M. P. Rodgers, C. C. Rodgers, A. K. Rakshit and R. M. Palepu, Investigation on the mixed micellar systems of cationic surfactants with propylene glycol and its oligomers, Colloid Polym. Sci., 2003, 281(8), 800–805 CrossRef CAS.
- L. Marszall and J. W. Van Valkenburg, The Effect of Glycols on the Hydrophile-Lipophile Balance and the Micelle Formation of Nonionic Surfactants, J. Am. Oil Chem. Soc., 1982, 59(2), 84–87 CrossRef CAS.
- T. Lukowicz, R. Company Maldonado, V. Molinier, J.-M. Aubry and V. Nardello-Rataj, Fragrance solubilization in temperature insensitive aqueous microemulsions based on synergistic mixtures of nonionic and anionic surfactants, Colloids Surf., A, 2014, 458, 85–95 CrossRef CAS.
- J. Penfold, I. Tucker, A. Green, D. Grainger, C. Jones, G. Ford, C. Roberts, J. Hubbard, J. Petkov, R. K. Thomas and I. Grillo, Impact of model perfumes on surfactant and mixed surfactant self-assembly, Langmuir, 2008, 24(21), 12209–12220 CrossRef CAS PubMed.
- R. Bradbury, J. Penfold, R. K. Thomas, I. M. Tucker, J. T. Petkov, C. Jones and I. Grillo, Impact of model perfume molecules on the self-assembly of anionic surfactant sodium dodecyl 6-benzene sulfonate, Langmuir, 2013, 29(10), 3234–3245 CrossRef CAS.
- Y. Fan, H. Tang, R. Strand and Y. Wang, Modulation of partition and localization of perfume molecules in sodium dodecyl sulfate micelles, Soft Matter, 2016, 12(1), 219–227 RSC.
- B. Hammouda, Temperature Effect on the Nanostructure of SDS Micelles in Water, Colloids Surf., A, 2013, 118, 151–167 CAS.
- M. Bergström and J. S. Pederson, Structure of pure SDS and DTAB micelles in brine determined by small-angle neutron scattering (SANS), Phys. Chem. Chem. Phys., 1999, 1, 4437–4446 RSC.
- H. Kumari, C. A. Deakyne and J. L. Atwood, Solution structures of nanoassemblies based on pyrogallol[4]arenes, Acc. Chem. Res., 2014, 47(10), 3080–3088 CrossRef CAS PubMed.
- H. Kumari, S. R. Kline and J. L. Atwood, Aqueous solubilization of hydrophobic supramolecular metal–organic nanocapsules, Chem. Sci., 2014, 5(6), 2554–2559 RSC.
- H. Kumari, S. R. Kline, W. G. Wycoff, R. L. Paul, A. V. Mossine, C. A. Deakyne and J. L. Atwood, Solution-phase structures of gallium-containing pyrogallol[4]arene scaffolds, Angew. Chem., Int. Ed. Engl., 2012, 51(21), 5086–5091 CrossRef CAS PubMed.
- S. R. Kline, Reduction and Analysis of SANS and USANS Data Using IGOR Pro, J. Appl. Crystallogr., 2006, 39, 895–900 CrossRef CAS.
- M. Doucet, et. al., SasView 4.2, Zenodo, 2022 Search PubMed.
- L. A. Feigin and D. I. Svergun, Structure Analysis by Small-Angle X-ray and Neutron Scattering, 2020, Plenum Press, New York, 1987 Search PubMed.
- J. B. Hayter and J. Penfold, An analytic structure factor for macroion solutions, Mol. Phys., 1981, 42(1), 109–118 CrossRef CAS.
- J.-P. Hansen and J. B. Hayter, A rescaled MSA structure factor for dilute charged colloidal dispersions, Mol. Phys., 1982, 46(3), 651–656 CrossRef CAS.
- J. B. Hayter and J. Penfold, Determination of micelle structure and charge by neutron small-angle scattering, Colloid Polym. Sci., 1983, 261(12), 1022–1030 CrossRef CAS.
- M. Kotlarchyk and S.-H. Chen, Analysis of small angle neutron scattering spectra from polydisperse interacting colloids, J. Chem. Phys., 1983, 79, 2461–2469 CrossRef CAS.
- J. J. H. Nusselder, Surfactant structure and aggregation behavior: 1-alkyl-4-alkylpyridinium iodide surfactants, s.n. Dissertation, University of Groningen, 1990 Search PubMed.
- M. Mirzamani, R. C. Reeder, C. Jarus, V. Aswal, B. Hammouda, R. L. Jones, E. D. Smith and H. Kumari, Effects of a Multicomponent Perfume Accord and Dilution on the Formation of ST2S/CAPB Mixed-Surfactant Microemulsions, Langmuir, 2022, 38(4), 1334–1347 CrossRef CAS.
- V. V. Suratkar and S. Mahapatra, Solubilization Site of Organic Perfume Molecules in Sodium Dodecyl Sulfate Micelles: New Insights from Proton NMR Studies, J. Colloid Interface Sci., 2000, 225(1), 32–38 CrossRef CAS PubMed.
- E. Fischer, W. Fieber, C. Navarro, H. Sommer, D. Benczédi, M. I. Velazco and M. Schönhoff, Partitioning and Localization of Fragrances in Surfactant Mixed Micelles, J. Surfactants Deterg., 2009, 12(1), 73–84 CrossRef CAS.
- W. Fieber, S. Frank and C. Herrero, Competition between surfactants and apolar fragrances in micelle cores, Colloids Surf., A, 2018, 539, 310–318 CrossRef CAS.
Footnote |
| † Electronic supplementary information (ESI) available. See https://doi.org/10.1039/d2ra00688j |
| This journal is © The Royal Society of Chemistry 2022 |