 Open Access Article
A porous silicon anode prepared by dealloying a Sr-modified Al–Si eutectic alloy for lithium ion batteries
Piaopiao Jiang and
Jinfu Li *
*
State Key Laboratory of Metal Matrix Composites, School of Materials Science and Engineering, Shanghai Jiao Tong University, Shanghai 200240, P. R. China. E-mail: jfli@sjtu.edu.cn; Fax: +86 21 54748530; Tel: +86 21 54748530
First published on 10th March 2022
Abstract
Silicon has been considered to be one of the most promising anode materials for next generation lithium ion batteries due to its high theoretical specific capacity. However, its huge volume expansion during the lithiation/delithiation process that can result in rapid capacity fading and low conductivity present significant challenges for application. In this study, the morphology of Si in an Al–Si eutectic alloy was modified by Sr, and porous Si was then produced by dealloying the precursor. Profiting from the unique structure, the Si anode exhibits an excellent reversible capacity of 405 mA h g−1 at 0.5 A g−1 after 100 cycles and a fantastic first cycle coulombic efficiency of 83.74%. Furthermore, the porous silicon modified by Sr delivers a stable capacity of 594.8 mA h g−1 even at a high current density of 2 A g−1 after 50 cycles, suggesting a good rate capability.
Introduction
Lithium ion batteries have been widely used in vehicles, mobile phones and other portable electronic devices due to their high power and energy densities, long cycling life and desirable safety.1–3 In order to adapt the continuous development of mechanical and electronic industries, higher energy density and power density are required for the next generation of lithium ion batteries.4 The present commercial graphite anode materials are becoming outdated due to their low capacity (372 mA h g−1).5 Therefore, it is urgent to find new anode materials with higher specific capacity as it is well known that the electrochemical performance of lithium ion batteries is highly dependent on the electrodes.6 Silicon has been considered to be one of the most promising anode materials for the next generation lithium ion batteries because of its high theoretical specific capacity (3579 mA h g−1), relatively low working potential (<0.5 V vs. Li/Li+) and so on.7 Nevertheless, the conventional silicon materials suffer from poor cycle performance due to their huge volume expansion (>300%) during the charge/discharge process, which leads to the rupture and pulverization of silicon, poor contact between silicon particles, the destruction of shape and integrity of the electrode, separation of the electrode powders from the current collector, a rapid increase in internal resistance and fast capacity fading.8–12 In addition, the poor conductivity of silicon as a semiconductor can result in a poor rate capability when it is used as the anode for lithium ion batteries.13,14 All these disadvantages severely limit the practical application of silicon in lithium ion batteries.To overcome these defects, numerous strategies have been developed to alleviate the huge volume expansion of silicon anode materials, mainly including carbon coating, nano-crystallization, alloying and constructing porous structures.15–20 Si-based anodes that contain other components such as carbon, conducting polymers and metals to act as a buffer to accommodate the huge volume expansion have delivered good conductivity and cycle capability.20,21 However, it is at the expense of the overall capacity of the anode. Nano-sized Si materials have exhibited good resistance to pulverization during cycling since they can avoid fracture resulting from volume expansion.22 However, the nano-sized Si anode would form more solid electrolyte interphase (SEI) films due to its huge surface area, which in turn increases the irreversible capacity and reduces the first coulombic efficiency.23–26
Porous silicon as the anode for lithium ion batteries has been attracting increasing attention as it can deliver a good cycle performance due to the sufficient buffer spaces for the volume expansion.27 An adequate porous structure can also provide more Li-ion transport channels and lead to an excellent rate capability.28,29 Among the various synthetic methodologies, the dealloying of Si-metal alloys has been considered to be a promising practical approach toward the mass production of porous Si microparticles because it is simple and low cost.30 The addition of Sr to Al–Si eutectic alloys can change the morphology of eutectic Si from coarse plate-like to fine fibrous shape.31 The porous Si anode prepared through dealloying the Sr-modified Al–Si alloys is expected to be more effective in mitigating the volume expansion due to the introduction of abundant nano-sized pores. In this study, we report a facile approach to prepare the nano-sized porous silicon with excellent electrochemical performance that involves dealloying the Sr-modified Al–Si eutectic alloy. The obtained nano-sized porous silicon exhibits a reversible capacity of 405 mA h g−1 after 100 cycles and a rate capability of 594.8 mA h g−1 after 50 cycles even at a high current density of 2 A g−1.
Experimental
The Al-12.6 wt% Si eutectic alloy ingots modified by the addition of 0.04 wt% Sr were fabricated by arc melting pure Al (99.999 wt%), Si (99.999 wt%) and Sr (99.99 wt%). The Al–Si–Sr ingots were then melted and sprayed onto a copper roller at a circumferential speed of about 27 m s−1 under the protection of high-purity Ar. The obtained Al–Si–Sr ribbons were about 50 μm in thickness and 4 mm in width. The dealloying of the Al–Si–Sr ribbons were performed in a 5 wt% HCl aqueous solution in a water bath at 60 °C for 12 h and the magnetic stirring was set at the rate of 600 rpm. After dealloying, the precipitates were collected by centrifugation and severally rinsed with absolute ethanol, followed by vacuum drying for 12 h at 100 °C. The obtained nano-sized porous silicon (Sr-npSi) samples were kept in a vacuum glove box to avoid oxidation. As a comparison, nano-sized porous silicon without Sr modification (npSi) was prepared from the Al-12.6 wt% Si eutectic alloy following the same procedure.The phase constitution of the samples was characterized on an X-ray diffractometer (XRD, D8 ADVANCE Da Vinci) and X-ray photoelectron spectroscope (XPS, AXIS UltraDLD). The microstructures were characterized on a scanning electron microscope (SEM, MIRA3) and a transmission electron microscope (TEM, TALOS F200X).
Electrochemical performance was measured in 2025 coin cells. Active materials, carboxyl methyl cellulose (CMC) and acetylene black with a mass ratio of 80![[thin space (1/6-em)]](https://www.rsc.org/images/entities/char_2009.gif) :
:![[thin space (1/6-em)]](https://www.rsc.org/images/entities/char_2009.gif) 10
10![[thin space (1/6-em)]](https://www.rsc.org/images/entities/char_2009.gif) :
:![[thin space (1/6-em)]](https://www.rsc.org/images/entities/char_2009.gif) 10 were stirred for 3.5 h to ensure thorough mixing. Then, the slurry was coated onto a thin copper foil and dried in a vacuum oven at 100 °C for 12 h to form the electrode. The coin cells were assembled with lithium foil as the counter electrode, 1.0 M LiPF6 solution in a mixture of ethylene carbonate/diethyl carbonate/ethyl methyl carbonate (EC
10 were stirred for 3.5 h to ensure thorough mixing. Then, the slurry was coated onto a thin copper foil and dried in a vacuum oven at 100 °C for 12 h to form the electrode. The coin cells were assembled with lithium foil as the counter electrode, 1.0 M LiPF6 solution in a mixture of ethylene carbonate/diethyl carbonate/ethyl methyl carbonate (EC![[thin space (1/6-em)]](https://www.rsc.org/images/entities/char_2009.gif) :
:![[thin space (1/6-em)]](https://www.rsc.org/images/entities/char_2009.gif) DEC
DEC![[thin space (1/6-em)]](https://www.rsc.org/images/entities/char_2009.gif) :
:![[thin space (1/6-em)]](https://www.rsc.org/images/entities/char_2009.gif) EMC, 1
EMC, 1![[thin space (1/6-em)]](https://www.rsc.org/images/entities/char_2009.gif) :
:![[thin space (1/6-em)]](https://www.rsc.org/images/entities/char_2009.gif) 1
1![[thin space (1/6-em)]](https://www.rsc.org/images/entities/char_2009.gif) :
:![[thin space (1/6-em)]](https://www.rsc.org/images/entities/char_2009.gif) 1 in volume with 1.0% VC) as the electrolyte, and polypropylene film (Celgard-2400) as the separator. Half cells were assembled in an argon-filled glove box at room temperature. Galvanostatic discharge/charge cycles were performed between 0.005 and 1 V on a lithium battery cycler (LAND). The cyclic voltammetry (CV) of the initial 3 cycles of the anode material at a scan rate of 0.1 mV s−1 from 1.2 V to 0.005 V was measured on an electrochemical workstation (CHI-760E Shanghai China).
1 in volume with 1.0% VC) as the electrolyte, and polypropylene film (Celgard-2400) as the separator. Half cells were assembled in an argon-filled glove box at room temperature. Galvanostatic discharge/charge cycles were performed between 0.005 and 1 V on a lithium battery cycler (LAND). The cyclic voltammetry (CV) of the initial 3 cycles of the anode material at a scan rate of 0.1 mV s−1 from 1.2 V to 0.005 V was measured on an electrochemical workstation (CHI-760E Shanghai China).
Results and discussion
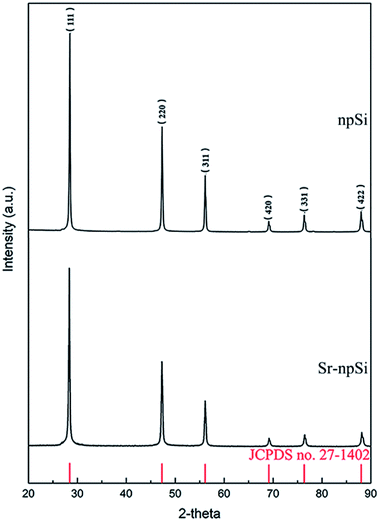
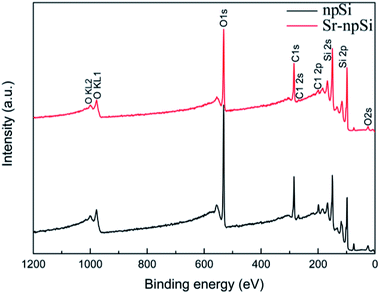
Fig. 1 shows the XRD patterns of the Sr-npSi and npSi materials. The diffraction peaks at 2θ values of 28.4°, 47.3°, 56.1°, 69.1°, 76.4° and 88.2° correspond to the (111), (220), (311), (420), (331) and (422) of Si crystal (JCPDS no. 27-1402), which is consistent with other Si products reported in literature.32–34 No diffraction peaks of Al were detected in the XRD pattern, implying that all Al has been removed during the dealloying treatment, and the sharp and intense peaks indicate the crystalline nature of the product.When Sr is used to modify Al–Si alloys, Sr is enriched in front of the growing Si and finally partially entrapped in the Si as Al–Si–Sr clusters with different sizes and compositions.35–37 The absence of Sr diffraction peaks from the XRD pattern may be due to the very low content of Sr. In order to further determine the composition of the Si products, the XPS survey scan from 0 eV to 1200 eV was performed and the results are shown in Fig. 2. The scanning range covers all the core levels for the elements except H and He. There is no difference between the two types of Si. The Sr (3d) peak at the binding energy around 133.7 eV cannot be observed in the Sr-npSi sample because the content of Sr is too little to be detected. Besides, the Al–Si–Sr clusters may also be corroded away during the dealloying process.
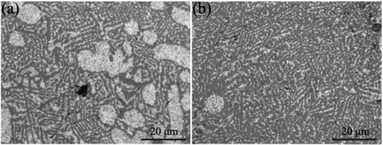
The Si phase in the as-quenched Al–Si eutectic alloy ribbons is too thin to be clearly observed under the SEM. Here, we illustrate the microstructure of the Al–Si eutectic alloy ingots in Fig. 3. Clearly, the eutectic Si has changed from relatively coarse plates into a fine fibrous framework after 0.04 wt% Sr was added. The result indicates that the Sr was successfully added to the Al–Si alloy and it did refine the eutectic Si.
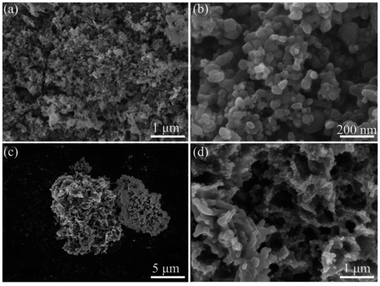
Fig. 4 shows the SEM images of the npSi and Sr-npSi materials. It can be seen that the npSi particles are agglomerated severely (Fig. 4a) and their average size is tens of nanometers (Fig. 4b). In contrast, the average size of Sr-npSi is at the micron scale, as shown in Fig. 4c. The magnified image is displayed in Fig. 4d. The Sr-npSi has a micro-sized porous coralloid structure with an average pore diameter of several nanometers. Further information of the porous structure of both materials has been discussed in the BET section.
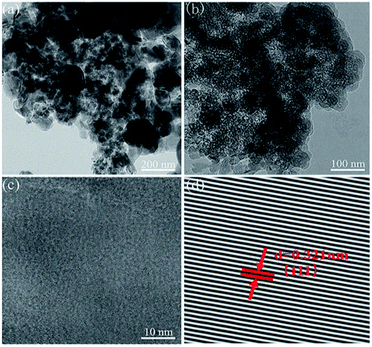
The structures of the npSi and Sr-npSi were further investigated by TEM, and the results are shown in Fig. 5. From the TEM image of npSi (Fig. 5a), it can be seen that the particles are not uniform and severely agglomerated. From Fig. 5b, it can be clearly observed that the Sr-npSi is full of pores with an average pore diameter of several nano-meters. The well-ordered lattice fringes with a distance of 0.321 nm (Fig. 5d) agree well with the spacing between the (111) planes of silicon crystals, indicating that only Si exists in the sample.
In order to further characterize the porous structure of Sr-npSi, Brunauer–Emmett–Teller (BET) measurements were carried out. Fig. 6a and b show the nitrogen adsorption and desorption isotherms of npSi and Sr-npSi, respectively. They present a hysteresis between adsorption and desorption reflecting the IV adsorption isotherm, indicating that the samples contain pores. The pore size distribution of the npSi is shown in Fig. 6c. The pores range from meso-pores (2–50 nm) to macro-pores and the latter may come from the aggregates of particles. The pore size distribution of Sr-npSi is shown in Fig. 6d. The pore diameters range from a few to a dozen nanometers. Perhaps, the embedment of Al–Si–Sr clusters in the eutectic Si is favorable for the formation of nano-sized pores in Sr-npSi. With numerous nano-sized pores, the specific surface area of Sr-npSi reaches 22.709 m2 g−1, much larger than that of npSi (12.066 m2 g−1). The abundant nano-sized pores can provide numerous sites for lithium ions to react with the material and shorten the lithium ion transport channels so that the rate capability of lithium ion batteries could be improved.
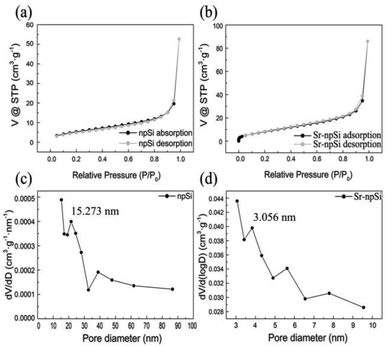 | ||
| Fig. 6 Nitrogen adsorption and desorption isotherm (a and b) and pore size distribution (c and d) of the npSi (a and c) and Sr-npSi (b and d). | ||
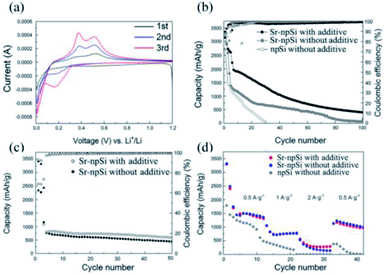
Fig. 7a shows the cyclic voltammetry (CV) of the initial 3 cycles of Sr-npSi with 1.0% VC material at a scan rate of 0.1 mV s−1 from 1.2 V to 0.005 V. In the first cathodic scan of the CV curve, a broad cathodic peak at around 0.6 V can be ascribed to the formation of the solid electrolyte interphase (SEI).38 The subsequent sharp redox peak at around 0.01 V corresponds to the formation of the LixSi phase. In the second and third scans, the cathodic peaks at about 0.17 V and 0.01 V and anodic peaks at about 0.37 V and 0.50 V reflect the reversible lithiation and delithiation reactions with the Sr-npSi material. The increasing intensity of cathodic and anodic peaks indicates the activation of the Sr-npSi anode.
The electrochemical cycling performances of Sr-npSi with/without 1.0% VC materials in comparison with npSi were evaluated using charge/discharge galvanostatic cycling between 0.005 V and 1 V (Fig. 7b). The anode samples were galvanically charged/discharged at a current density of 50 mA g−1 for the first 2 cycles and then at a current density of 0.5 A g−1 for all the subsequent cycles. The Sr-npSi anode with the 1.0% VC additive shows a first discharge capacity of 3358 mA h g−1 with a first-cycle coulombic efficiency of 83.74%. After 100 cycles, it still shows an excellent discharge capacity of 405 mA h g−1. Furthermore, the coulombic efficiency remains over 98.93% after 100 cycles. Under the same measurement condition, the npSi anode shows poor discharge capacities and after 27 cycles the capacity quickly decreased to <200 mA h g−1. The Sr-npSi anode without the VC additive shows a worse cycle performance than the Sr-npSi anode with the 1.0% VC additive, but its performance is better than the npSi anode. This is because VC decomposes on the Si surface to form an electrolyte impermeable SEI layer, which can physically separate electrolyte molecules from Si and effectively prevent the electrolyte from further decomposing on the Si surface.39,40 Therefore, the anode can keep the structural integrity and avoid more side effects. The unique three-dimensional porous coralloid structure of Sr-npSi resulting from Sr modification can provide sufficient buffer space for volume expansion during the charge/discharge process. Therefore, the Sr-npSi anode shows a better cycling performance than the npSi anode. Moreover, the abundant nano-sized pores can provide more Li+ transport channels, which lead to a good rate capability. Fig. 7c shows the cycling capability and coulombic efficiency of the Sr-npSi anode with/without 1.0% VC additive at a current density of 50 mA g−1 for the initial two cycles and at a high current density of 2 A g−1/1 A g−1 in the following cycles. The Sr-npSi anode with 1.0% VC additive exhibits a better reversible capacity of 592.2 mA h g−1 after 50 cycles than the Sr-npSi anode without the VC additive. As shown in Fig. 7d, the Sr-npSi anode with 1.0% VC additive provides a discharge capacity of 3317.5 mA h g−1 at a current density of 50 mA g−1, 1743 mA h g−1 at 0.5 A g−1, 1056.3 mA h g−1 at 1 A g−1 and 528.1 mA h g−1 at 2 A g−1. A capacity of 1229.4 mA h g−1 can be retained when the current density is reduced back to 0.5 A g−1. In contrast, npSi only provides a discharge capacity of 1455.8 mA h g−1 at 50 mA g−1, 614.8 mA h g−1 at 0.5 A g−1, 173.7 mA h g−1 at 1 A g−1 and 1.8 mA h g−1 at 2 A g−1. Only 379.6 mA h g−1 can be retained when the current density is reduced back to 0.5 A g−1. The results indicate that the Sr-npSi anode with 1.0% VC additive has a better rate capability than npSi and the Sr-npSi anode without the VC additive, suggesting that the modification of the Al–Si precursor by Sr can improve the electrochemical performance of lithium ion batteries to a certain degree.
Fig. 8 shows the morphology of the Sr-npSi anode after 100 cycles. It is clear that Sr-npSi did not get crushed into fragments during the charge/discharge cycles. With abundant nano-sized pores to provide sufficient buffer space for the volume expansion of Si, the Sr-npSi anode can retain good structural integrity during working.
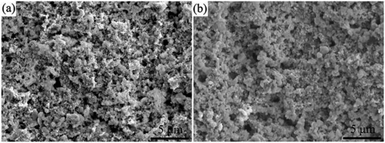 | ||
| Fig. 8 SEM images of the Sr-npSi anode (a) before and (b) after 100 charge/discharge cycles at a current density of 50 mA g−1 for the initial two cycles and at 0.5 A g−1 in the following cycles. | ||
Conclusions
In conclusion, we prepared a Sr-npSi anode material via a facile process of dealloying the Sr-modified Al–Si eutectic alloy. Compared with the npSi anode, the electrochemical performance of the Sr-npSi has been improved a lot. The Sr-npSi anode exhibited a fantastic cycling performance of 405 mA h g−1 at 0.5 A g−1 after 100 cycles with an excellent first-cycle coulombic efficiency of 83.74%. An excellent rate capability was also demonstrated due to the unique porous coralloid structure. Even at a high current density of 2 A g−1, the discharge capacity was 592.2 mA h g−1 after 50 cycles. It is demonstrated that the morphology and structure of silicon can be well controlled by Sr modification. The unique porous coralloid structure could alleviate the volume expansion of silicon during the charge/discharge process. Dealloying in combination with the modification of Al–Si eutectic alloys is promising for regulating the micro-morphology of the eutectic silicon. This scalable strategy allows for the mass production of electrodes for lithium ion batteries, providing new guidelines for the optimization of the synthesis of porous silicon.Conflicts of interest
There are no conflicts to declare.Acknowledgements
This work was supported by the National Natural Science Foundation of China (Grant No. 51620105012, 51771116, and 51821001).References
- K. Brandt, Solid State Ionics, 1994, 69, 173 CrossRef CAS.
- C. X. Zhang, S. L. Mei, X. H. Chen, E. T. Liu and C. J. Yao, J. Mater. Chem. C, 2021, 9, 17182 RSC.
- X. W. Du, B. Yang, Y. Lu, X. J. Guo, G. Q. Zu and J. Huang, J. Mater. Chem. C, 2021, 9, 6760 RSC.
- S. Myungbeom, D. G. Lee, H. Park, C. Park, J. H. Choi and H. S. Kim, Adv. Funct. Mater., 2018, 6, 1800855 Search PubMed.
- J. E. Entwistlea and S. V. Patwardhan, RSC Adv., 2021, 11, 3801 RSC.
- M. M. Wang, C. S. Li, Y. Sun, C. Yang, L. Li, Z. Zhu, D. D. Wang, Y. L. Li, J. H. Zhu, Y. Z. Zhao and S. L. Chou, J. Mater. Chem. C, 2021, 14981 RSC.
- B. Liang, Y. Liu and Y. Xu, J. Power Sources, 2014, 267, 469 CrossRef CAS.
- R. A. Huggins, J. Power Sources, 1999, 81, 13 CrossRef.
- W. Wang, M. K. Datta and P. N. Kumta, J. Mater. Chem., 2007, 17, 3329 Search PubMed.
- Y. Yu, L. Gu, C. B. Zhu, S. Tsukimoto, A. P. van and J. Maier, Adv. Mater., 2010, 22, 2247 CrossRef CAS PubMed.
- A. P. Yuda, P. Y. E. Koraag, F. Iskandar, H. S. Wasisto and A. Sumboja, J. Mater. Chem. A, 2021, 9, 1890 RSC.
- J. J. Wang, T. T. Xu, X. Huang, H. Li and T. L. Ma, RSC Adv., 2016, 6, 87778 RSC.
- Y. S. Hu, A. Philipp, M. B. Smarsly and J. Maier, ChemSusChem, 2010, 22, 231 CrossRef PubMed.
- E. Pollak, G. Salitra, V. Baranchugov and D. Aurbach, J. Phys. Chem. C, 2007, 111, 11437 CrossRef CAS.
- Z. D. Lu, N. Liu, H. W. Lee, J. Zhao, W. Y. Li and Y. Cui, ACS Nano, 2015, 9, 2540 CrossRef CAS PubMed.
- N. Lin, Y. Han, L. B. Wang, J. B. Zhou, J. Zhou, Y. C. Zhu and Y. T. Qian, Angew. Chem., Int. Ed., 2015, 127, 3893 CrossRef.
- Y. F. Liu, R. J. Ma, Y. P. He, M. X. Gao and H. G. Pan, Adv. Funct. Mater., 2014, 24, 3944 CrossRef CAS.
- H. J. Tian, X. J. Tan, F. X. Xin, C. S. Wang and W. Q. Han, Nano Energy, 2015, 11, 490 CrossRef CAS.
- W. He, H. J. Tian, F. X. Xin and W. Q. Han, J. Mater. Chem. A, 2015, 3, 17956 RSC.
- E. Mados, N. Harpak, G. Levi, E. Patolsky, E. Peled and D. Golodniitsky, RSC Adv., 2021, 11, 26586 RSC.
- W. F. Ren, Y. H. Wang, Z. L. Zhang, Q. Q. Tan, Z. Y. Zhong and F. B. Su, J. Mater. Chem. A, 2016, 4, 552 RSC.
- X. Su, Q. L. Wu, J. C. Li, X. C. Xiao, L. Amber, W. Q. Lu and W. Brian, Adv. Energy Mater., 2014, 4, 1300882 CrossRef.
- L. H. Liu, J. Lyu, T. H. Li and T. K. Zhao, Nanoscale, 2016, 8, 701 RSC.
- N. Liu, Z. D. Lu, J. Zhao, T. M. McDowell, H. W. Lee, W. T. Zhao and Y. Cui, Nat. Nanotechnol., 2014, 9, 187 CrossRef CAS PubMed.
- Z. L. Xu, X. M. Liu, Y. S. Luo, L. M. Zhou and J. K. Kim, Prog. Mater. Sci., 2017, 90, 1 CrossRef CAS.
- Y. F. Lin, H. Q. Lin, J. W. Jiang, D. R. Yang, N. Du, X. Q. He, J. G. Ren, P. He, C. L. Pang and C. M. Xiao, RSC Adv., 2019, 9, 35392 RSC.
- A. Casimir, H. G. Zhang, O. Ogoke, J. C. Amine, J. Lu and G. Wu, Nano Energy, 2017, 31, 113 CrossRef.
- B. Wang, X. L. Li, B. Luo, X. F. Zhang, Y. Y. Shang, A. Y. Cao and L. J. Zhi, ACS Appl. Mater. Interfaces, 2013, 5, 6467 CrossRef CAS PubMed.
- K. L. Zhang, Y. G. Xia, Z. D. Yang, R. S. Fu, C. X. Shen and Z. P. Liu, RSC Adv., 2017, 7, 24305 RSC.
- F. Wang, L. Sun, W. W. Zi, B. X. Zhao and H. B. Du, Chem.–Eur. J., 2019, 5, 9071 CrossRef PubMed.
- Q. Liu, M. W. Liu, C. Xu, W. L. Xiao, H. Yamagata and S. H. Xie, Mater. Charact., 2018, 140, 290 CrossRef CAS.
- C. K. Chan, H. Peng, G. Liu, K. Mcllwrath, X. F. Zhang, R. A. Huggins and Y. Cui, Nat. Nanotechnol., 2008, 3, 31 CrossRef CAS PubMed.
- A. Magasinski, P. Dixon, B. Hertzberg, A. Kvit, J. Ayala and G. Yushi, Nat. Mater., 2010, 9, 353 CrossRef CAS PubMed.
- D. P. Yu, Z. G. Bai, Y. Ding, Q. L. Hang, H. Z. Zhang, J. J. Wang, Y. H. Zou, W. Qian, G. C. Xiong, H. T. Zhou and S. Q. Feng, Appl. Phys. Lett., 1998, 72, 3458 CrossRef CAS.
- J. H. Li, M. Albu, F. Hofer and P. Schumacher, Acta Mater., 2015, 83, 187 CrossRef CAS.
- M. Timpel, N. Wanderka, R. Schlesiger, T. Yamamoto, N. Lazarev, D. Isheim, G. Schmitz, S. Matsumura and J. Banhar, Acta Mater., 2012, 60, 3920 CrossRef CAS.
- J. H. Li, M. Z. Zarif, M. Albu, B. J. McKay, F. Hofer and P. Schumacher, Acta Mater., 2014, 72, 80 CrossRef CAS.
- D. Zane, A. Antonini and M. Pasquali, J. Power Sources, 2001, 97–98, 146 CrossRef CAS.
- H. Ota, Y. Sakata, A. Inoue and S. Yamaguchi, J. Electrochem. Soc., 2004, 151, A1659 CrossRef CAS.
- K. Feng, M. Li, W. W. Liu, A. G. Kashkooli, X. C. Xiao, M. Cai and Z. W. Chen, Small, 2018, 14, 1702737 CrossRef PubMed.
| This journal is © The Royal Society of Chemistry 2022 |

