 Open Access Article
Development of a bioorthogonal fluorescence-based assay for assessing drug uptake and delivery in bacteria†
Jocelyn M. F. Ooi‡
 a,
Jessica M. Fairhall‡
 *a,
Benjamin Spanglerb,
Daniel J. W. Chonga,
Brian Y. Fengb,
Allan B. Gamble
 a and
Sarah Hook*a
aSchool of Pharmacy, University of Otago, Dunedin, New Zealand. E-mail: jess.fairhall@otago.ac.nz; sarah.hook@otago.ac.nz
bNovartis Institutes for BioMedical Research (NIBR) in Emeryville, California, USA
First published on 23rd May 2022
Abstract
Bioorthogonal chemistry can facilitate the development of fluorescent probes that can be used to sensitively and specifically detect the presence of biological targets. In this study, such an assay was developed to evaluate the uptake and delivery of antimicrobials into Escherichia coli, building on and extending previous work which utilised more resource intensive LCMS detection. The bacteria were genetically engineered to express streptavidin in the periplasmic or cytoplasmic compartments, which was used to localise a bioorthogonal probe (BCN-biotin). Azido-compounds which are delivered to these compartments react with the localised BCN-biotin–streptavidin in a concentration-dependent manner via a strain-promoted alkyne–azide cycloaddition. The amount of azido-compound taken up by bacteria was determined by quantifying unreacted BCN-biotin–streptavidin via an inverse electron demand Diels–Alder reaction between remaining BCN-biotin and a tetrazine-containing fluorescent dye. Following optimisation and validation, the assay was used to assess uptake of liposome-formulated azide-functionalised luciferin and cefoxitin. The results demonstrated that formulation into cationic liposomes improved the uptake of azide-functionalised compounds into the periplasm of E. coli, providing insight on the uptake mechanism of liposomes in the bacteria. This newly developed bioorthogonal fluorescence plate-reader based assay provides a bioactivity-independent, medium-to-high throughput tool for screening compound uptake/delivery.
1 Introduction
Gram-negative bacteria can be innately resistant to antimicrobials due to the unique barrier presented by their double membrane cell envelope.1,2 The outer membrane (OM) is an asymmetric lipid bilayer, constructed with an external lipopolysaccharide layer (LPS) and an internal phospholipid layer. This presents a major barrier to large hydrophobic compounds, however small hydrophilic molecules may gain entry to the periplasm via transmembrane porins which span the OM.1 The inner membrane (IM) is a typical phospholipid bilayer, home to inner membrane transporters and multi-drug efflux pumps. Small, polar molecules that are able to effectively pass through the OM have the difficult task of diffusing across the IM, as well as evading efflux pumps.1 Resistance to xenobiotics in Gram-negative bacteria can be mediated through gene mutations that reduce the number of porins in the OM, as well as upregulating multi-drug efflux pumps.2 Gram-negative bacteria have large tripartite protein systems, such as the Escherichia coli (E. coli) AcrAB-TolC efflux pump, consisting of an IM transporter (AcrB), membrane fusion protein (AcrA) and an OM channel (TolC), which are able to efflux compounds from the periplasm across the OM out of the cell.2When attempting to design new antimicrobials, the combination of these separate barriers makes it difficult to determine which physiochemical properties favour the desired compound permeability profile.1 More tools are needed to help understand the mechanisms behind these processes and how compound properties affect uptake, accumulation, and overall distribution within bacteria. While there are several in vitro assays available for testing drug movement across membranes, these approaches do not recapitulate the complex structure of the Gram-negative cell envelope, such as the double membrane and/or presence of porins and efflux pumps.3–7
A number of groups have looked at using whole-bacteria assays to quantify internalised drugs, either via fluorescence or mass spectrometry,8–10 however challenges arise in differentiating internalised drugs from extracellular drugs. In addition, drugs/compounds that are subject to high efflux, or diffuse out during washing steps, could lead to false-negative results. Spangler and co-workers developed a method for determining compound uptake and localisation utilising bioorthogonal strain-promoted alkyne–azide cycloaddition (SPAAC).11 The assay used E. coli that had been genetically modified to express streptavidin (SA) in the periplasm or cytoplasm to localise a chemical reporter, bicyclo[6.1.0]nonyne (BCN)-PEG2-biotin conjugate 1 (Fig. 1). Cells were then treated with azide-bearing compounds and their “click” products detected via liquid chromatography mass spectrometry (LCMS). In addition, TolC deficient (ΔTolC) strains were utilised to provide information on compound efflux via this tripartite efflux pump.
 | ||
| Fig. 1 Chemical structures of BCN-PEG2-biotin 1 and tetrazine-BODIPY FL 2 used in this fluorescence-based assay. | ||
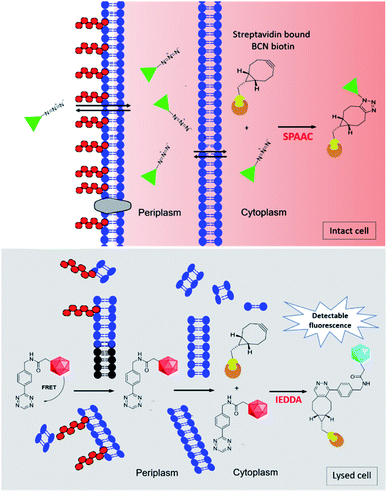
The purpose of this research was to develop a fluorescence-based assay to determine the uptake of drug into E. coli, utilising the same approach as Spangler et al., but with the benefits of reduced sample preparation, and a less complex and more scalable detection method. In the first step of the fluorescence-based assay, BCN-biotin 1 (Fig. 1) is bound to streptavidin (BCN-biotin–SA) localised in either the periplasmic or cytoplasmic compartments of genetically modified E. coli (Fig. 2). Both wild type (WT) and ΔTolC E. coli, that lack the TolC of the AcrAB-TolC efflux pump,11 were modified. Streptavidin is used due to its high affinity for multiple biotin-containing reagents and its localisation to the periplasm is achieved using the OmpA signal peptide, while cytoplasmic localisation is achieved by omitting this sequence.11 The bacteria are then incubated with azide-bearing compounds. Following uptake the azide can react with BCN-biotin–SA via SPAAC. The bacteria are then lysed and a tetrazine dye (tetrazine-BDP-FL 2 (Fig. 1 and 2)) is added. Any remaining unreacted BCN-biotin–SA will react with tetrazine-BDP-FL 2 via an inverse-electron demand Diels–Alder (IEDDA) cycloaddition, allowing for quantification of unreacted BCN-biotin–SA, and thus an indirect measure of uptake and accumulation of azido-compounds.12,13 Quenching of fluorescence is promoted by Förster resonance energy transfer (FRET) between tetrazine and dye.13,14 Following reaction with BCN, FRET is inhibited, and the fluorescence of the dye is restored. In this assay higher levels of uptake and accumulation will lead to a reduction in the levels of unreacted BCN-biotin–SA available to react with the tetrazine dye 2, and therefore a lower fluorescent output signal.
Due to its electron-rich nature and the lack of steric bulk surrounding the alkyne, BCN can react with both substituted azides and tetrazines mediated via an inverse-electron demand, unlike other cyclooctynes, which makes BCN the ideal cyclooctyne for this application.15–17 The bioorthogonal reaction between azides and cyclooctynes, are much slower than the IEDDA reaction between tetrazines and cyclooctynes, such as BCN.13,18,19 However, azides consist of only 3 nitrogen atoms and are much smaller than tetrazines. Therefore, the impact of azide-functionalisation on the physiochemical properties of drugs and small molecules is expected to be minimal in comparison.11,20,21 Hence the SPAAC reaction is favoured for the first step of the assay. While, to achieve fast reaction with remaining unreacted BCN-biotin and subsequent fluorescence signal, the IEDDA reaction between tetrazine and BCN is considered the ideal bioorthogonal reaction for the final step of the assay.
Following development and optimisation of the bioorthogonal fluorescence assay, we were interested in testing whether the assay could be used to assess the impact of formulating compounds into nanoparticles on bacterial drug uptake. It has been suggested that some of the aforementioned delivery challenges could be overcome using lipid nanoparticles that can fuse with the bacterial OM and directly deliver drug to the periplasm.22 Liposomes, which are vesicles comprising of one or several natural or synthetic phospholipids bilayers, possess a high surface-to-volume ratio and have been reported to increase the antimicrobial activity of several antibiotics.23,24 However, the mechanism by which this increased killing occurs has not been able to be fully elucidated as minimum inhibitory concentration (MIC) analysis alone does not provide a direct measure of compound uptake. Assays utilising liposomes composed of fluorophore labelled lipids have been used to measure liposomal fusion with bacterial membranes.25–27 These assays however do not provide information on the fate of encapsulated drug, nor do they determine the efficacy of liposomal delivery systems compared to unformulated free drug.
In order to examine liposomal uptake and drug delivery via the bioorthogonal fluorescence assay, bacteria are treated with azide-bearing compounds encapsulated within liposomes (Fig. 3). Following uptake of the liposomes in bacteria, the azide-bearing compounds are released from the liposome, which can then react with BCN-biotin–SA. Bacteria are then lysed and remaining BCN-biotin–SA is reacted with tetrazine-BDP-FL 2, as described before (Fig. 2, lower panel). In this assay, bacteria are also treated with unformulated azide-bearing compounds, and thus providing a direct measure for the impact of formulation on the uptake of compound in bacteria.
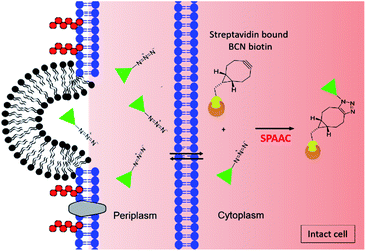 | ||
| Fig. 3 Schematic diagram of the fluorescence-based assay for determination of uptake and accumulation of liposomal encapsulated compounds in Gram-negative bacteria. Live intact bacteria are preincubated with BCN-biotin 1 which binds to streptavidin located in the cytoplasm (or periplasm). Azide-bearing compounds (represented by the green triangle) encapsulated in liposomes (shown in black) enter into the cell (shown here to occur due to fusion between liposomal lipids and the outer membrane of the bacterial cell) and react with BCN-biotin–SA. After incubation cells are washed and lysed as shown in Fig. 2 lower panel. | ||
2 Results and discussion
2.1 Development of the bioorthogonal fluorescence-based assay
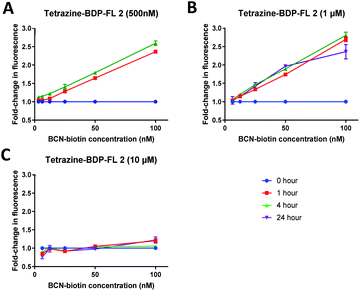
In order to determine optimal tetrazine dye 2 concentrations and incubation times, preliminary experiments were conducted in vitro using E. coli lysate. Tetrazine dye 2 at final concentrations of 500 nM, 1 μM, or 10 μM were reacted with a serial dilution of BCN-biotin 1 starting at 100 nM in E. coli lysate (Fig. 4). The change in fluorescence was then monitored over a 4 to 24 hours period. From fluorescence wavelength scans of tetrazine dye 2 in PBS before and after reaction with BCN-biotin 1, it was determined that emission measurements between 520 and 550 nm provided the best signal over background (Fig. S1†). Tetrazine dye 2 at concentrations of 500 nM (Fig. 4A) and 1 μM (Fig. 4B) displayed linear detection of BCN-biotin 1 (6.25 nM to 100 nM). Based on this data (Fig. 4 and S1†) it was determined that a 1 hour incubation was sufficient for cycloaddition and inhibition of FRET, with incubation for longer periods of time having no impact on signal strength. The reaction between BCN and tetrazines have been reported with second-order rate constants of up to 1245 M−1 s−1 in 1![[thin space (1/6-em)]](https://www.rsc.org/images/entities/char_2009.gif) :
:![[thin space (1/6-em)]](https://www.rsc.org/images/entities/char_2009.gif) 1 organic:aqueous media.13,18 At 1 μM of tetrazine this approximates a reaction half-life of 13.4 minutes, therefore by 1 hour > 95% of BCN would have reacted with tetrazine, this is likely why the longer reaction times did not display any observable increase.
1 organic:aqueous media.13,18 At 1 μM of tetrazine this approximates a reaction half-life of 13.4 minutes, therefore by 1 hour > 95% of BCN would have reacted with tetrazine, this is likely why the longer reaction times did not display any observable increase.
Tetrazine dye 2 at 1 μM showed the highest fold change in fluorescence, showing up to 2.7-fold increase in fluorescence when reacted with 100 nM BCN-biotin 1 (Fig. 4B), while 500 nM tetrazine dye 2 displayed an approximate 2.4-fold increase (Fig. 4A). No significant fold change over background was observed for 10 μM tetrazine dye 2, most likely due to only 1% of tetrazine reacting at the highest concentration (100 nM of BCN) providing insufficient signal over background fluorescence. Therefore, it was concluded that the optimal concentration of tetrazine dye 2 for this assay was 1 μM, with an incubation time of 1 hour.
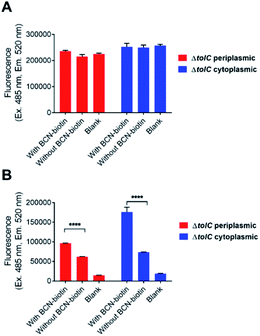
Next, the ability of tetrazine dye 2 to detect BCN-biotin 1 that had been localised within the periplasm and cytoplasm of the modified E. coli was examined. Expression of a modified streptavidin (containing an OmpA signal peptide for periplasmic localisation or without for cytoplasmic localisation)11 was induced by supplementation of minimal media with L-rhamnose. Optimisation experiments were carried out to determine the appropriate carbohydrate composition of the minimal media (Table 2, Section 4.2.3) as bacteria will preferentially utilise glucose over secondary sugars such as rhamnose and arabinose.28 Bacteria were grown to mid log phase before the addition of L-rhamnose and 40 μM BCN-biotin 1. Bacteria were then grown overnight, washed and then lysed before being incubated with MeCN containing 2 μM tetrazine-BDP-FL 2 (final concentration 1 μM) for 1 hour at room temperature. The samples were then clarified by centrifugation, and the supernatant was collected for fluorescence measurement. When bacterial samples were grown in media supplemented with glucose there was no observable difference in fluorescence intensity in samples incubated with or without BCN-biotin 1 (Fig. 5A). The same was observed when media was supplemented with maltose (data not shown). However, when media was not carbohydrate-supplemented, there was a significant increase in fluorescence (p = 0.0001) for samples with BCN-biotin, which indicated the successful induction of SA that could bind BCN-biotin 1 at levels that could be detected by tetrazine-BDP-FL 2 in the ΔTolC E. coli strains (Fig. 5B). This finding is in line with work conducted by Rosano and Ceccarelli where they demonstrated the utilisation of lactose by bacteria only after the depletion of glucose.29
An increase in fluorescence in samples incubated with tetrazine-BDP-FL (2) in the absence of BCN-biotin (1) compared to blank (no tetrazine-BDP-FL or BCN-biotin) was observed (Fig. 5B). This was attributed to unreacted tetrazine-BDP-FL, as it is expected that it would still exhibit some background fluorescence.
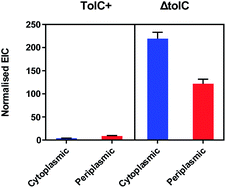
Despite optimisation of the growth media, a change in fluorescence could not be detected for the TolC+ E. coli when comparing cells treated with BCN-biotin 1 to cells without BCN-biotin 1 (data not shown). Therefore, to assess any differences in the amount of the BCN-biotin 1 bound to streptavidin expressed by the bacteria within the cytoplasm or periplasm between the two strains (TolC+ and ΔTolC E. coli), the experiment was repeated, and samples were analysed by LCMS, following the previously reported procedure.11 Bacteria were incubated with 20 μM of BCN-biotin 1 and incubated for 16 hours at 37 °C. Cells were then washed, lysed with MeCN and DMF, and prepared for LCMS analysis. As previously reported,11 higher levels of BCN-biotin 1 binding were observed for the ΔTolC strains (Fig. 6). From a standard curve, the average BCN-biotin 1 concentration per well was calculated (Fig. S2†). Concentrations of BCN-biotin 1 in TolC+ strains were low (4 nM for cytoplasmic localisation and 8.6 nM for the periplasmic localisation) while concentrations in ΔTolC E. coli were significantly higher (219.2 nM for cytoplasmic localisation, p = 0.003, and 121.8 nM for periplasmic localisation, p = 0.008), suggesting that the localisation of BCN-biotin 1 and subsequent binding of BCN-biotin 1 to SA is subject to efflux in the presence of a functioning tripartite efflux pump (AcrAB-TolC). These low nM concentrations in the TolC+ strain are unlikely to provide enough fold-change in fluorescence when reacted with tetrazine dye 2, compared to control, as shown in Fig. 4B. The low levels of signal from TolC+ bacteria meant that only the ΔTolC strains could be used for examining compound uptake via the fluorescence assay, and thus the impact of efflux on drug accumulation could not be examined.
2.2 Validation of the bioorthogonal fluorescence-based assay
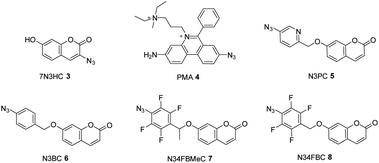
The fluorescence-based assay was then directly compared to the published LCMS-based assay.11 The ability of the assays to detect the presence of various azido-bearing compounds in the periplasm or cytoplasm of bacteria deficient in the efflux pump (ΔTolC) was assessed. Bacteria were treated with 40 μM of 3-azido-7-hydroxycoumarin (7N3HC, 3) or propidium monoazide (PMA, 4), as established positive and negative controls for cytoplasmic uptake, respectively.11 Additionally, a panel of 7-hydroxycoumarin compounds that differed from 7N3HC by the addition of a pyridine (N3PC, 5), benzyl group (N3BC, 6), or fluorine (N34FBC, 8) and methyl substituents (N34FBMeC, 7) were also synthesised30 and examined for uptake in the assay (Fig. 7). This was done in order to investigate the impact of increasing compound lipophilicity on uptake.The expression of SA was induced with L-rhamnose and bacteria were treated with BCN-biotin 1 overnight. Cells were then washed to remove any unbound BCN-biotin 1, and then subsequently treated with the azido compounds for 3 hours. As before with the LCMS assay, the 3 hours incubation period was used as this provided sufficient signal, without interfering with the integrity of the assay, i.e. cell death.11 By keeping the incubation period consistent for all compounds, the amount of click-product formed is dependent on the concentration of azido-compound inside the cell (provided the different reactivity rates of each azido-compound are accounted for). This allows for the comparison of relative uptake and accumulation between each compound, over the course of the experiment.
Bacteria were then washed to remove any compound that had not been taken up, followed by lysis and incubation with tetrazine dye 2 for 1 hour. The reaction between BCN and tetrazine is >1000 times faster than the reaction between BCN and azide,13,18,19 therefore after lysis the tetrazine dye 2 was expected to completely outcompete any unreacted azide that may still be present after the washing step. The samples were then centrifuged, and the supernatant was transferred to a 96-well flat bottom plate and fluorescence was measured using a plate reader. Following fluorescence measurements, the samples were prepared for LCMS analysis. The same samples were used for both analyses, therefore, results from the fluorescence assay should match the results of the LCMS assay, validating the accuracy of this newly developed assay.
From the raw fluorescence data (Fig. S3†), a reduction in detectable fluorescence was observed for the ΔTolC strains incubated with the azido compounds compared to untreated control bacteria (no azide). To compare the results from the fluorescence-based assay to the LCMS assay, results were normalised as previously reported11 (Fig. 8). To account for differences in reaction rates between each respective azide and BCN, an in vitro dose response study was conducted, and the slopes generated for each compound were used to normalise the results (Fig. S4 and S5†). The fluoro-substituted azido-compounds 7 and 8 reacted the fastest with BCN, compared to the unsubstituted benzyl azide (6). This has been previously reported for BCN, whereby the strong FMO interaction between the LUMOAzide–HOMOAlkyne (inverse-electron demand) results in accelerated reaction rates between electron-deficient azides and the electron-rich cyclooctyne, BCN.19,31,32
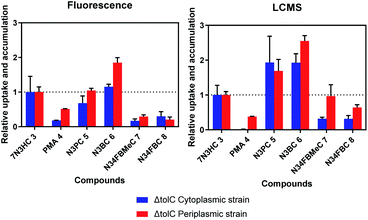 | ||
| Fig. 8 Comparison of fluorescence plate reader results to mass spectrometry for detection of azide 4–8 uptake and accumulation profiles relative to 7N3HC 3 in ΔTolC E. coli. Results were normalised to OD600, in vitro compound reactivity slopes, internal control (mass spec results only), and 7N3HC 3 profiles for the same strain (n = 3, mean ± SD). Statistical comparisons between the groups compared to 7N3HC 3 were carried out using one-way (ANOVA) followed by Dunnett's multiple comparison post hoc test. Statistical significance is shown in Supplementary Tables S1 and S2.† | ||
The uptake and accumulation of PMA 4 was low in both assays as expected. PMA 4, a cationic dye used for quantifying live/dead cells, is practically impermeable to live cells thus will only bind to the DNA of dead/lysed cells.33 PMA 4 displayed higher uptake in the periplasm as compared to the cytoplasm, but overall uptake was lower than that of 7N3HC 3, consistent with previous results.11 In both assays N3BC 6 uptake was higher than 7N3HC 3 in the periplasm, however for the fluorescence assay, uptake into the cytoplasm was not statistically different from 7N3HC 3. More variability was observed between the two assays for N3PC 5, with similar uptake to 7N3HC 3 detected by fluorescence (no statistical difference) but overall higher uptake in both compartments when analysed by LCMS. Uptake of N3FMeC 7 and N3FBC 8 was lower in the cytoplasm in both assays. However, for uptake in the periplasm, results were more variable between assays, showing no statistical difference when compared to 7N3HC 3 for the LCMS assay. It was hypothesised that the permeability of N3FBMeC 7 and N3FBC 8 would be reduced compared to 7N3HC 3, as the addition of fluorine and methyl substituents increase the lipophilicity of the compound. The fluorescence assay results displayed predicted profiles for the investigated compounds and, although there were some key differences, appeared to corroborate the overall results of the LCMS assay.
The major limitation of the fluorescence assay is the reliance on the detection of loss of BCN-biotin 1 compared to the direct detection of the compound click product by LCMS. This could potentially lead to an underestimation of bacterial uptake and accumulation for compounds with slower reaction rates or low permeability, as small changes in biotin concentration can be difficult to detect due to the lower sensitivity of fluorescence-based read-outs. Fluorescent tetrazines that utilise through-bond energy transfer (TBET) rather than FRET, developed by Carlson and co-workers,34 may improve the sensitivity of the assay as they were shown to have an approximately 1000-fold increase in fluorescence following click reaction.
Endogenous thiols, such as glutathione (GSH), cysteine (Cys) and H2S, are abundant in living systems, and cyclooctynes, such as BCN, have been reported to react with thiols to form alkenyl sulfide adduct products.35–39 Using LCMS, glutathione-BCN adducts could be detected in the cytoplasmic streptavidin expressing ΔTolC strain in small quantities (Fig. S6†). This is consistent with known bacterial physiology as the periplasmic space is oxidising while the cytoplasmic compartment is reducing, allowing for greater free thiol presence.35,40 It was suspected that the signal was only observable in the ΔTolC samples, and not the TolC+ strain, as the low reactivity of the reporter with thiols required high concentrations of BCN to form measurable amounts of adducts.38,39 While GSH adducts were formed, it was believed that this had a minimal impact on the presence of the BCN-reporter in this compartment as these levels were consistent between samples and caused the loss of less than 0.1% of the BCN-biotin 1.
2.3 Formulation of liposomes containing azide-functionalised compounds
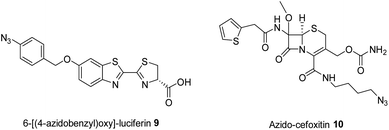
Liposomal delivery of two azide-functionalised compounds was investigated. Initial studies were carried out using a model luciferin-based compound (6-[(4-azidobenzyl)oxy]-luciferin (azidobenzyl-luciferin 9), Fig. 9), previously synthesised by Ke et al.41 Subsequently, the β-lactam antibiotic cefoxitin was functionalised with a short aliphatic azide chain (azido-cefoxitin 10, Fig. 9). The synthesis of 6-[(4-azidobenzyl)oxy]-luciferin 9 was conducted via the mesylate of the 4-azidobenzyl alcohol30,42 and subsequent nucleophilic substitution by 2-cyano-6-hydroxy-benzothiazole. 2-Cyanobenzothiazole condensation was then performed between 6-[(4-azidobenzyl)oxy]benzo[d]thiazole-2-carbonitrile and D-cysteine to form the thiazole of luciferin.43 Synthesis of azido-cefoxitin 10 was conducted via a HATU-mediated amide coupling reaction between cefoxitin and 4-azidobutylamine.1,2-Distearoyl-sn-glycero-3-phosphocholine (DSPC), a saturated, symmetric phospholipid made up of 44 carbon atoms with zwitterionic properties due to the presence of equal numbers of positively and negatively charged groups,44 was used to prepare liposomes. Since the bacterial cell surface is negatively charged, DC-cholesterol was added to some formulations as a source of positive charge to improve the interaction between the formulation and bacteria.45
A molar ratio of 73![[thin space (1/6-em)]](https://www.rsc.org/images/entities/char_2009.gif) :
:![[thin space (1/6-em)]](https://www.rsc.org/images/entities/char_2009.gif) 27 DSPC
27 DSPC![[thin space (1/6-em)]](https://www.rsc.org/images/entities/char_2009.gif) :
:![[thin space (1/6-em)]](https://www.rsc.org/images/entities/char_2009.gif) DC-Chol was optimal for the production of cationic (+24.7 mV) and homogeneous (PDI = 0.19) particles. The substitution of DC-Chol with cholesterol resulted in particles of neutral charge (−4.52 mV) with a PDI of 0.27. Particles with zeta potential values ranging between −10 mV and +10 mV are considered to be neutral.46 Overall, there was no difference in liposome size and PDI between the cationic and neutral drug-loaded liposome formulations (Table 1).
DC-Chol was optimal for the production of cationic (+24.7 mV) and homogeneous (PDI = 0.19) particles. The substitution of DC-Chol with cholesterol resulted in particles of neutral charge (−4.52 mV) with a PDI of 0.27. Particles with zeta potential values ranging between −10 mV and +10 mV are considered to be neutral.46 Overall, there was no difference in liposome size and PDI between the cationic and neutral drug-loaded liposome formulations (Table 1).
| Compounds | Formulations | Size, nm | PDI | Zeta potential, mV | EE (%) |
|---|---|---|---|---|---|
| Azidobenzyl-luciferin 9 | DSPC![[thin space (1/6-em)]](https://www.rsc.org/images/entities/char_2009.gif) : :![[thin space (1/6-em)]](https://www.rsc.org/images/entities/char_2009.gif) DC-Chol DC-Chol |
108.0 ± 10.90 | 0.19 ± 0.03 | 24.7 ± 1.70 | 51.8 ± 10.37 |
DSPC![[thin space (1/6-em)]](https://www.rsc.org/images/entities/char_2009.gif) : :![[thin space (1/6-em)]](https://www.rsc.org/images/entities/char_2009.gif) Chol Chol |
129.6 ± 3.48 | 0.27 ± 0.08 | −4.52 ± 0.60 | 16.9 ± 1.08 | |
| Azido-cefoxitin 10 | DSPC![[thin space (1/6-em)]](https://www.rsc.org/images/entities/char_2009.gif) : :![[thin space (1/6-em)]](https://www.rsc.org/images/entities/char_2009.gif) DC-Chol DC-Chol |
181.8 ± 45.75 | 0.25 ± 0.07 | 22.4 ± 2.80 | 15.2 ± 1.11 |
DSPC![[thin space (1/6-em)]](https://www.rsc.org/images/entities/char_2009.gif) : :![[thin space (1/6-em)]](https://www.rsc.org/images/entities/char_2009.gif) Chol Chol |
221.8 ± 66.24 | 0.31 ± 0.10 | −5.74 ± 0.47 | 14.0 ± 1.07 |
Liposomes were then loaded with the azido-compounds, azidobenzyl-luciferin 9 or azido-cefoxitin 10. The efficiency of encapsulation of azidobenzyl-luciferin 9 was significantly higher for the cationic formulation as compared to the neutral formulation (p = 0.05), but this was not observed for azido-cefoxitin 10. The increased loading of azidobenzyl-luciferin 9 but not azido-cefoxitin 10 could be explained by the net negative charge of azidobenzyl-luciferin 9 compound which favoured its interaction with the overall positively charged lipid mixture.
Azido-cefoxitin 10 loaded liposomes were larger than azidobenzyl-luciferin 9 loaded liposomes (p = 0.05 for neutral azido-cefoxitin 10 liposomes compared to neutral azidobenzyl-luciferin 9 liposomes). However, the size and PDI of all the liposomes formed were considered to be within acceptable ranges for drug delivery and cellular uptake.47
The stability of liposomes was evaluated upon incubation at 37 °C for 3 hours, the incubation period of the uptake assay. Based on the results shown in Fig. S7,† both cationic and neutral liposomes were stable upon incubation at 37 °C for the time required to perform the bacterial liposome uptake assay. There was no change in size or drug loading in cationic and neutral liposomes.
2.4 Optimisation of the bioorthogonal fluorescence-based assay for determining liposomal uptake
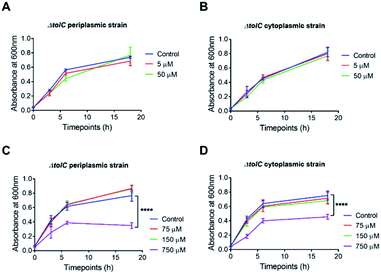
Initial experiments were carried out to determine the optimal concentrations of the azido-modified compounds (luciferin 9 or cefoxitin 10) to be used in the assay. In order to do this, 1 μM of BCN-biotin 1 was incubated at 37 °C with increasing concentrations of azido compounds for 3 hours followed by the addition of 2 μM of tetrazine-BDP-FL 2 (Fig. 10). Fluorescent intensity will decrease with increased uptake of azido modified compounds, due to a decrease in the levels of unreacted BCN-biotin 1, which is then able to react with tetrazine dye 2. Dose response curves were observed for both compounds, with 5 μM of azidobenzyl-luciferin 9 and 75 μM of azido-cefoxitin 10 being chosen as optimal concentrations due to the observable changes from background fluorescence as shown in Fig. 10. Aliphatic azides (as found in azido-cefoxitin 10) are known to react with electron-rich cyclooctynes, such as BCN, slower than aromatic azides (as found in luciferin)19 which could account for the higher concentration of azido-cefoxitin 10 needed for the assay compared to azidobenzyl-luciferin 9.Studies were carried out to determine if the azido compounds had any impact on the growth of the ΔTolC E. coli over 18 h at 37 °C. There was no impact on bacterial growth after exposure to either 5 μM or 50 μM (10-fold excess) of azidobenzyl-luciferin 9 (Fig. 11). After confirming the azidobenzyl-luciferin 9 had no impact on bacterial growth, the impact of the azido-cefoxitin 10 on growth was examined. It was unknown if replacement of the carboxylate group of cefoxitin with an azide-bearing group would impact on antibacterial activity. At 75 and 150 μM azido-cefoxitin 10, the bacterial growth rate was similar to the control. However, at the highest concentration used (10-fold higher than the optimal concentration required for the assay), the absorbance readings at each timepoint for both bacterial strains were 2-fold lower than the control. This indicated that the growth of the ΔTolC E. coli strains were only significantly inhibited (p = 0.001) by 750 μM of azido-cefoxitin 10.
2.5 Impact of formulation in liposomes on drug delivery in E. coli
The bioorthogonal fluorescence assay was performed to investigate the uptake of free or liposome-formulated drug into the periplasm and cytoplasm of ΔTolC E. coli using the optimised conditions and compound concentrations. The fluorescence results were normalised using the following equation (eqn (1)).
 | (1) |
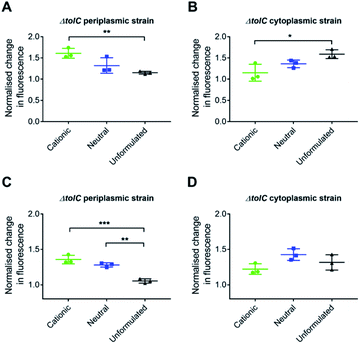
Formulation of 6-[(4-azidobenzyl)oxy]-luciferin 9 into cationic liposomes improved uptake (p = 0.01) into the periplasm of E. coli as demonstrated by the increase in normalised change in fluorescence intensity (Fig. 12A). Neutral liposome also showed a trend towards increased uptake but this was not significant. When examining cytoplasmic delivery, the opposite trend was revealed with significantly less of the cationic formulation reaching the cytoplasm (Fig. 12B).
The assay was then repeated with azido-cefoxitin 10. In the periplasmic strain, uptake of the cationic and neutral formulations were significantly higher (p = 0.001 and p = 0.01) than that of unformulated drug (Fig. 12C). The delivery and uptake of formulated and unformulated azido-cefoxitin 10 was also monitored in the cytoplasmic strain of E. coli (Fig. 12D). However, there was no significant statistical difference in the normalised change in fluorescence intensity between the three groups.
Liposomes are widely used for drug delivery due to various advantages such as controlled release of drug with minimal toxicity, overcoming barriers to cellular and tissue uptake, as well as improving the stability and biodistribution of drugs.23,48,49 The main disadvantages of liposomal formulations are higher production costs and shorter shelf-lives.23
As the OM of Gram-negative bacteria often serves as the permeability barrier against hydrophobic drugs, it has been proposed that the similarity of liposomal phospholipid bilayer to the structure of bacterial cell membranes would facilitate membrane fusion, whereby drug molecules would be directly transported into the bacteria.45 The higher uptake of azido-modified compounds formulated into cationic liposomes into the periplasm is likely due to improved interaction of the positively charged formulation with the anionic bacterial cell surface.45 The results from the studies examining drug localisation in the cytoplasm were less clear, as there appeared to be a trend of lower uptake of azidobenzyl-luciferin 9 in the cytoplasm compared to free drug, however this was not observed for azido-cefoxitin 10. One reason for this may have been due to the fusion mechanism causing a delay in compound reaching the cytoplasm. Expanding on the hypothesis that delivery into the periplasm was mediated by fusion of the liposome with the OM and release of the azido-modified compounds into the periplasm, movement of hydrophilic or charged small molecules into the cytoplasm would then depend on energy-dependent transporters. Compounds which are charged and with sufficient hydrophobicity, such as the azido compounds, could move across the IM with the help of proton motive force (PMF).1 The experiment for azidobenzyl-luciferin 9 was repeated with the incubation time being extended from 3 hours to 5 hours (Fig. S8†). However, the same trend was observed as for 3 h incubation. Therefore, future studies utilising a number of azido-compounds entrapped in liposomes could be done to further elucidate the impact of compound physicochemical characteristics on uptake into the cytoplasm of bacteria following liposomal fusion with the OM.
3 Conclusions
In summary, we have developed a bioorthogonal fluorescence-based assay that is able to detect uptake and accumulation of azido-compounds into TolC-deficient Gram-negative bacteria. This fluorescence-based assay uses the combination of bioorthogonal SPAAC and IEDDA cycloaddition chemistries. Validation of the fluorescence-based assay was conducted against the previously reported mass spectrometry-based assay,11 showing overall comparable uptake and accumulation profiles for a series of azido-coumarin compounds and PMA for the two assays. This newly developed bioorthogonal fluorescence assay allows for a bioactivity-independent, medium-to-high throughput tool for screening compound uptake. Although less sensitive than the LCMS assay,11 this fluorescence assay has a number of benefits. In addition to being more scalable and less time and resource intensive, it allows for detection of compounds that have poor ionisation or suffer degradation, that would otherwise be difficult to detect via LCMS.Future modifications to the assay will examine the use of fluorescent tetrazines that utilise TBET34 instead of FRET, which have been previously shown to have an approximately 1000-fold increase in fluorescence following click reaction. We believe the use of these TBET fluorescent tetrazine would increase the sensitivity of the assay and allow for detection of lower concentrations of BCN-biotin–SA, such as observed in the +TolC E. coli strains. Alternatively, the use of fluorogenic cyclooctynes that become fluorescent following reaction with azide, such as coumBARAC developed by Bertozzi and co-workers,50 would provide a direct measure of azide uptake in cells.
The bioorthogonal assay was able to detect increased bacterial uptake of compounds formulated in cationic liposomes into the periplasm, compared to neutral formulations and the free azido-compounds. This provided support for the hypothesis that the presence of positive surface charge on cationic liposomes mediates the adhesion and fusion with the outer membrane of Gram-negative bacterial cells allowing better delivery compared to uncharged liposomes.51 The metabolic incorporation of BCN probes as previously described,52 that allow localisation of BCN within different compartments or proteins of interest (e.g., within the peptidoglycan layer) could also be examined to provide better insight into the uptake of compounds and liposomes. Lastly, as the bioorthogonal assay was successful in studying the initial uptake of liposomes and delivery of encapsulated drug, the assay could be used to examine the mechanism of uptake of various nanoparticle delivery systems and fate of encapsulated drug within bacteria.
4 Experimental
4.1 General experimental and synthesis of azido-compounds
General experimental details and the synthesis of new azido-functionalised compounds are described in the ESI.†4.2 Assay development
![[thin space (1/6-em)]](https://www.rsc.org/images/entities/char_2009.gif) :
:![[thin space (1/6-em)]](https://www.rsc.org/images/entities/char_2009.gif) 1 MeCN
1 MeCN![[thin space (1/6-em)]](https://www.rsc.org/images/entities/char_2009.gif) :
:![[thin space (1/6-em)]](https://www.rsc.org/images/entities/char_2009.gif) PBS, from 20 mM stock solutions in DMSO. A 5- or 6-point 1
PBS, from 20 mM stock solutions in DMSO. A 5- or 6-point 1![[thin space (1/6-em)]](https://www.rsc.org/images/entities/char_2009.gif) :
:![[thin space (1/6-em)]](https://www.rsc.org/images/entities/char_2009.gif) 1 dilution series was conducted in lysate and 50 μL of each of these solutions was then added to 50 μL of 2 μM of tetrazine-BDP-FL 2 in clarified E. coli lysate in a 96-well plate, to initiate the click-reaction. Fluorescence was measured at 0, 1, 4 and 24 hours on a CLARIOstar plate reader using an end-point fluorescence protocol: excitation at 477, dichroic 497 and emission 525 with default options for other settings.
1 dilution series was conducted in lysate and 50 μL of each of these solutions was then added to 50 μL of 2 μM of tetrazine-BDP-FL 2 in clarified E. coli lysate in a 96-well plate, to initiate the click-reaction. Fluorescence was measured at 0, 1, 4 and 24 hours on a CLARIOstar plate reader using an end-point fluorescence protocol: excitation at 477, dichroic 497 and emission 525 with default options for other settings.Different supplements were added into the minimal media (Table 2) and tested to optimise bacterial growth.
| Supplements | 1 | 2 | 3 |
|---|---|---|---|
| Casamino acid (1%) | + | + | + |
| Glucose (0.4%) | + | ||
| Maltose (0.2%) | + | ||
| CaCl2 (0.1 mM) | + | + | + |
| MgSO4 (2 mM) | + | + | + |
For optimisation assays, the bacterial cultures were grown as previously described,11 where 3 mL of M9 minimal medium supplemented with 0.2% glycerol and kanamycin (50 μg mL−1) was inoculated with E. coli from a frozen glycerol stock and allowed to incubate overnight at 37 °C.
Cultures were diluted to OD600 0.05 in 10 mL of M9 minimal medium supplemented with 0.2% glycerol and kanamycin (50 μg mL−1) and allowed to grow back to mid log phase (approximately 4 hours) at 37 °C. Cultures were again diluted to OD600 0.05 in 20 mL of M9 minimal medium supplemented with 0.2% glycerol and kanamycin (50 μg mL−1) and incubated at 37 °C for 3 hours until cultures reached mid log phase growth (OD600 0.2). Streptavidin expression was induced by adding L-rhamnose (0.2% w/v) and, 10 min post induction, cultures were treated with 40 μM of BCN-biotin 1 and incubated for 16 hours at 37 °C. The cultures were harvested by centrifugation at 1400×g for 10 min and washed three times with 10 mL minimal media supplemented with 0.2% L-rhamnose. Bacteria were resuspended in 2 mL minimal media and 100 μL was transferred into a 96-well plate, followed by incubation at 37 °C for 1 h. Samples were centrifuged at 1000×g for 10 min and resuspended in 50 μL PBS, of which 5 μL was transferred to a clear bottom 96 well-plate and diluted with 95 μL for OD600 measurement. The remaining bacterial samples were then incubated with 50 μL MeCN containing 2 μM tetrazine-BDP-FL 2 (Jena Bioscience) for 1 hour at room temperature. Samples were centrifuged and the supernatant was collected for fluorescence intensity measurement using a POLARstar Omega Microplate reader (BMG Labtech, Germany) at Ex; 485 nm and Em; 520 nm.
SPE plates (Oasis HLB 96-well μElution plate, 30 μm) were preconditioned with 250 μL methanol (+0.1% formic acid), 250 μL 50% methanol in water (+0.1% formic acid), then 250 μL HPLC grade water (+0.1% formic acid). Samples were transferred to the SPE plate and diluted with 300 μL HPLC grade water (+0.1% formic acid) to enable cartridge loading, then washed with an additional 250 μL of water (+0.1% formic acid). The samples were eluted with 60 μL of 50% methanol in water (+0.1% formic acid containing 100 nM of the click product of benzyl azide and BCN-biotin 1 reporter as an internal standard) followed by 60 μL of methanol (+0.1% formic acid) and 50 μL of the resulting eluate was transferred into a 384 well plate.
The resulting samples were then analysed by LCMS for presence of BCN-biotin 1. Samples were separated over 7 minutes via reversed-phase liquid chromatography using an Agilent 1290 UPLC coupled to Agilent 6550 ESI-QTOF with a Phenomenex Luna C8 column (5 μm particle, 100 Å pore size, 2 × 50 mm) with an Agilent Zorbax SB-C8, 5 μm particle, 2.1 × 12.5 mm guard column using gradient elution from 0 to 99% methanol in water (+0.1% formic acid).
Expected masses of BCN-biotin 1 or GSH adduct of BCN-biotin were calculated using ChemBioDraw Ultra software and analysed on Skyline software. Peak areas were normalised by OD600 measurements and internal control giving normalised EIC values. An in vitro standard curve for BCN-biotin 1 (Fig. S2†) was used to determine the concentrations of BCN-biotin 1 in each well of each strain. A 6-point 1![[thin space (1/6-em)]](https://www.rsc.org/images/entities/char_2009.gif) :
:![[thin space (1/6-em)]](https://www.rsc.org/images/entities/char_2009.gif) 1 dilution series BCN-biotin 1 in E. coli lysate, starting at 50 μM, was conducted and analysed by LCMS as above.
1 dilution series BCN-biotin 1 in E. coli lysate, starting at 50 μM, was conducted and analysed by LCMS as above.
4.3 Validation of the bioorthogonal fluorescence-based assay
For fluorescence measurements, the plate was centrifuged (1000×g, 10 min, 4 °C) and 50 μL of supernatant was transferred into a flat-bottom 96-well plate. Measurements were taken on a CLARIOstar plate reader with an end-point fluorescence protocol: Excitation 477, dichroic 497 and emission 525 with default options for other settings. Fluorescence measurements were normalised (Norm. Fl) using the equations below to calculate a relative uptake and accumulation (eqn (2) and (3)).
 | (2) |
 | (3) |
The remaining solution and bacterial pellets were frozen at −80 °C for 16 hours. The samples were then thawed at 37 °C for 20 minutes and 50 μL of DMF was added. The samples were again frozen at −80 °C for 16 hours, after which the samples were thawed at 37 °C and clarified via centrifugation (1000×g, 10 min, 4 °C). The samples were then prepared for LCMS analysis using the procedure in Section 4.2.4. Finally, the results of each azide were normalised using the equations below to calculate relative uptake and accumulation (eqn (4) and (5)).
 | (4) |
 | (5) |
![[thin space (1/6-em)]](https://www.rsc.org/images/entities/char_2009.gif) :
:![[thin space (1/6-em)]](https://www.rsc.org/images/entities/char_2009.gif) 1 MeCN:PBS, from 20 mM stock solutions in DMSO. A 4-point dilution series was conducted in lysate and 50 μL of each of these solutions was then transferred to a 96-well plate containing 50 μL solution of 2 μM BCN-biotin 1 in clarified E. coli lysate, to initiate the click-reaction. The samples were then allowed to incubate at 37 °C for 3 hours. Following which, 100 μL containing 2 μM of tetrazine-BDP-FL 2 in clarified E. coli lysate was added to react with remaining BCN-biotin 1. Fluorescence was measured after 1 hour on a CLARIOstar plate reader using an end-point fluorescence protocol: Excitation 477, dichroic 497 and emission 525 with default options for other settings (Fig. S4†). The same reactions were used for MS analysis (Fig. S5†).
1 MeCN:PBS, from 20 mM stock solutions in DMSO. A 4-point dilution series was conducted in lysate and 50 μL of each of these solutions was then transferred to a 96-well plate containing 50 μL solution of 2 μM BCN-biotin 1 in clarified E. coli lysate, to initiate the click-reaction. The samples were then allowed to incubate at 37 °C for 3 hours. Following which, 100 μL containing 2 μM of tetrazine-BDP-FL 2 in clarified E. coli lysate was added to react with remaining BCN-biotin 1. Fluorescence was measured after 1 hour on a CLARIOstar plate reader using an end-point fluorescence protocol: Excitation 477, dichroic 497 and emission 525 with default options for other settings (Fig. S4†). The same reactions were used for MS analysis (Fig. S5†).4.4 Preparation of liposome formulations
Microfluidic mixing was used to prepare liposomes using NanoAssemblr microfluidic cartridges on a NanoAssemblr Benchtop platform (Precision NanoSystems, Canada). DSPC![[thin space (1/6-em)]](https://www.rsc.org/images/entities/char_2009.gif) :
:![[thin space (1/6-em)]](https://www.rsc.org/images/entities/char_2009.gif) Chol or DC-Chol were dissolved in absolute ethanol at a 73
Chol or DC-Chol were dissolved in absolute ethanol at a 73![[thin space (1/6-em)]](https://www.rsc.org/images/entities/char_2009.gif) :
:![[thin space (1/6-em)]](https://www.rsc.org/images/entities/char_2009.gif) 27 molar ratio. A solution of 6-[(4-azidobenzyl)oxy]-luciferin 9 (270 μM) or azido-cefoxitin 10 (19 mM) in the lipid mixture (final concentration of 10 mg mL−1) was prepared in absolute ethanol. The following microfluidic parameters were used: total flow rate 10 mL min−1 and flow ratio of 4
27 molar ratio. A solution of 6-[(4-azidobenzyl)oxy]-luciferin 9 (270 μM) or azido-cefoxitin 10 (19 mM) in the lipid mixture (final concentration of 10 mg mL−1) was prepared in absolute ethanol. The following microfluidic parameters were used: total flow rate 10 mL min−1 and flow ratio of 4![[thin space (1/6-em)]](https://www.rsc.org/images/entities/char_2009.gif) :
:![[thin space (1/6-em)]](https://www.rsc.org/images/entities/char_2009.gif) 1 (PBS
1 (PBS![[thin space (1/6-em)]](https://www.rsc.org/images/entities/char_2009.gif) :
:![[thin space (1/6-em)]](https://www.rsc.org/images/entities/char_2009.gif) absolute ethanol). Liposome suspensions containing azidobenzyl-luciferin 9 were dialysed overnight against PBS (replaced with fresh PBS 4 times over the 24 hours period) using a 100 kDa molecular weight cut-off membrane while liposomal-azido-cefoxitin 10 was centrifuged at 17
absolute ethanol). Liposome suspensions containing azidobenzyl-luciferin 9 were dialysed overnight against PBS (replaced with fresh PBS 4 times over the 24 hours period) using a 100 kDa molecular weight cut-off membrane while liposomal-azido-cefoxitin 10 was centrifuged at 17![[thin space (1/6-em)]](https://www.rsc.org/images/entities/char_2009.gif) 200×g for 2 h at 4 °C to remove ethanol and un-encapsulated drug.
200×g for 2 h at 4 °C to remove ethanol and un-encapsulated drug.
4.5 Characterisation of liposomes
Dynamic light scattering (DLS; Zetasizer Nano, Malvern Instruments Ltd, UK) was used to measure the size and PDI of liposome particles in PBS. The zeta potential was measured in 10 mM sodium chloride solution at 25 °C (Malvern Instruments, Ltd, UK). After the removal of non-encapsulated drugs, a small volume of each liposome formulation was centrifuged using a Prism R Microcentrifuge (Labnet Inc) at 17![[thin space (1/6-em)]](https://www.rsc.org/images/entities/char_2009.gif) 200×g for 2 h at 4 °C. The obtained pellet was lysed using DMSO and the concentration of active compounds were determined by absorbance at wavelengths of 260 nm for azido-cefoxitin, and at 327 nm for azidobenzyl-luciferin. Quantification was carried out using standard curves of the compounds prepared in DMSO. The encapsulation efficiency (EE) was calculated using the equation below (eqn (6)).
200×g for 2 h at 4 °C. The obtained pellet was lysed using DMSO and the concentration of active compounds were determined by absorbance at wavelengths of 260 nm for azido-cefoxitin, and at 327 nm for azidobenzyl-luciferin. Quantification was carried out using standard curves of the compounds prepared in DMSO. The encapsulation efficiency (EE) was calculated using the equation below (eqn (6)).
 | (6) |
4.6 Stability studies of liposomes
Freshly prepared liposomes were centrifuged to remove ethanol and free azido-compounds. Liposomes were incubated for 3 h at 37 °C and the size and encapsulation were analysed at predetermined time points. The stability studies were replicated 3 times with freshly prepared liposome suspensions.4.7 Optimisation of azido-compound concentrations and toxicity studies
Azidobenzyl-luciferin 9 was serially diluted two-fold in PBS and 50 μL of each concentration was added to 50 μL minimal media containing 2 μM of BCN-biotin 1 probe, resulting in a starting concentration of 20 μM azidobenzyl-luciferin. After incubation at 37 °C for 3 h, 100 μL MeCN containing 2 μM of tetrazine-BDP-FL 2 was added and fluorescence was determined at an excitation wavelength of 485 nm and emission at 520 nm (POLARstar Omega Microplate reader, BMG Labtech). The same procedure was repeated with azido-cefoxitin 10, with a starting concentration of 400 μM.To study the effect of azidobenzyl-luciferin 9 on both ΔTolC E. coli strains, overnight cultures grown in minimal media were diluted to OD600 0.05 and allowed to grow to mid-log phase. The diluted bacterial cultures were then incubated at 37 °C with 5 and 50 μM azidobenzyl-luciferin 9 for 0, 3, 6, 18 h. The absorbance reading at each timepoint was recorded using a plate reader at 600 nm (POLARstar Omega Microplate reader, BMG Labtech). This procedure was repeated for the assessment of azido-cefoxitin 10 (75, 150, and 750 μM) toxicity.
4.8 Bioorthogonal fluorescence-based assay for the determination of liposomal drug delivery in Gram-negative bacteria
Overnight bacteria cultures treated with 40 μM of BCN-biotin 1, grown and induced as described above in Section 4.2.3 using Composition 3, were harvested by centrifugation at 1400×g for 10 min and washed three times with 10 mL of minimal media supplemented with 0.2% L-rhamnose. Cells were resuspended in 2 mL of minimal media and incubated at 37 °C for 20 min. 100 μL aliquots of the resuspended cultures were transferred to the wells of a 96-well plate. 100 μL of each liposomal 6-[(4-azidobenzyl)oxy]-luciferin 9 formulation and free 6-[(4-azidobenzyl)oxy]-luciferin 9 (final concentration of 5 μM) were added and the plate was incubated for 3 or 5 h at 37 °C. Samples were centrifuged at 1000×g for 10 min and resuspended in 50 μL PBS. Bacteria were then incubated with 50 μL MeCN containing 2 μM tetrazine-BDP-FL 2 for 1 hour at room temperature. Samples were centrifuged and the supernatant was collected for fluorescence intensity measurement using a POLARstar Omega Microplate reader (BMG Labtech, Germany) at Ex; 485 nm and Em; 520 nm. The fluorescent intensities of both free and formulated 6-[(4-azidobenzyl)oxy]-luciferin 9 assays were determined and compared. For the azido-cefoxitin 10 assay, the same protocol was repeated with 75 μM of azido-cefoxitin 10. The fluorescence for the samples was normalised (Norm. Fl) to PBS control cultures according to the equation (eqn (1)) in Section 2.5.4.9 Statistical analysis
Graphing and data analysis were carried out using Microsoft Excel 2010 and GraphPad Prism 7 software. All experiments were conducted in triplicate and error bars in all figures represent standard deviation from the mean (SD). Statistical comparisons between the groups were carried out using one-way or two-way (ANOVA) followed by Dunnett's or Tukey's multiple comparison post hoc test to determine statistical significance. Statistical significance is indicated as: * p ≤ 0.05; **p ≤ 0.01; ***p ≤ 0.001; ****p ≤ 0.0001.Author contributions
Conceptualisation: J. M. F., B. S., B. Y. F., A. B. G., S. H.; methodology: J. M. F. O., J. M. F., B. S.; investigation: J. M. F. O., J. M. F., B. S., D. J. W. C.; funding acquisition: J. M. F., A. B. G., S. H.; resources: B. S., A. B. G., S. H.; writing – original draft: J. M. F. O., J. M. F.; writing – review and editing: J. M. F. O., J. M. F., B. S., B. Y. F., A. B. G., S. H.; visualisation: J. M. F. O., J. M. F.; supervision: B. S., B. Y. F., A. B. G., S. H.Conflicts of interest
The authors declare the following competing financial interest(s): B. S. and B. Y. F. are former employees of the Novartis Institutes for Biomedical Research.Acknowledgements
This research was supported by a Health Research Council of New Zealand Explorer Grant (S. Hook), and the MacGibbon PhD travel fellowship (J. M. Fairhall). The authors would also like to thank the NMR and HRMS facility at the Department of Chemistry (Otago) for allowing us to use their facilities, and the University of Otago (J. M. F. Ooi) and the Health Research Council (J. M. Fairhall) for doctoral scholarships. The authors would like to thank Dr Dustin Dovala for providing the mutant streptavidin expressing E. coli strains used in this work as previously reported.11Notes and references
- L. L. Silver, Bioorg. Med. Chem., 2016, 24, 6379–6389 CrossRef CAS PubMed.
- M. Masi, M. Refregiers, K. M. Pos and J. M. Pages, Nat. Microbiol., 2017, 2, 17001 CrossRef CAS PubMed.
- M. Winterhalter and M. Ceccarelli, Eur. J. Pharm. Biopharm., 2015, 95, 63–67 CrossRef CAS PubMed.
- B. F. Jensen, H. H. F. Refsgaard, R. Bro and P. B. Brockhoff, QSAR Comb. Sci., 2005, 24, 449–457 CrossRef CAS.
- B. J. Bennion, N. A. Be, M. W. McNerney, V. Lao, E. M. Carlson, C. A. Valdez, M. A. Malfatti, H. A. Enright, T. H. Nguyen, F. C. Lightstone and T. S. Carpenter, J. Phys. Chem. B, 2017, 121, 5228–5237 CrossRef CAS PubMed.
- W. Shinoda, Biochim. Biophys. Acta, 2016, 1858, 2254–2265 CrossRef CAS PubMed.
- F. Graef, R. Richter, V. Fetz, X. Murgia, C. De Rossi, N. Schneider-Daum, G. Allegretta, W. Elgaher, J. Haupenthal, M. Empting, F. Beckmann, M. Bronstrup, R. Hartmann, S. Gordon and C. M. Lehr, ACS Infect. Dis., 2018, 4, 1188–1196 CrossRef CAS PubMed.
- H. Cai, K. Rose, L. H. Liang, S. Dunham and C. Stover, Anal. Biochem., 2009, 385, 321–325 CrossRef CAS PubMed.
- P. G. S. Mortimer and L. J. V. Piddock, J. Antimicrob. Chemoth., 1991, 28, 639–653 CrossRef CAS PubMed.
- G. Krishnamoorthy, I. V. Leus, J. W. Weeks, D. Wolloscheck, V. V. Rybenkov and H. I. Zgurskaya, mBio, 2017, 8, 5 CrossRef PubMed.
- B. Spangler, D. Dovala, W. S. Sawyer, K. V. Thompson, D. A. Six, F. Reck and B. Y. Feng, ACS Infect. Dis., 2018, 4, 1355–1367 CrossRef CAS PubMed.
- M. L. Blackman, M. Royzen and J. M. Fox, J. Am. Chem. Soc., 2008, 130, 13518–13519 CrossRef CAS PubMed.
- B. L. Oliveira, Z. Guo and G. J. L. Bernardes, Chem. Soc. Rev., 2017, 46, 4895–4950 RSC.
- N. K. Devaraj, S. Hilderbrand, R. Upadhyay, R. Mazitschek and R. Weissleder, Angew. Chem., Int. Ed., 2010, 49, 2869–2872 CrossRef CAS PubMed.
- M. Smeenk, J. Agramunt and K. M. Bonger, Curr. Opin. Chem. Biol., 2021, 60, 79–88 CrossRef CAS PubMed.
- A. C. Knall and C. Slugovc, Chem. Soc. Rev., 2013, 42, 5131–5142 RSC.
- W. Chen, D. Wang, C. Dai, D. Hamelberg and B. Wang, Chem. Commun., 2012, 48, 1736–1738 RSC.
- K. Lang, L. Davis, S. Wallace, M. Mahesh, D. J. Cox, M. L. Blackman, J. M. Fox and J. W. Chin, J. Am. Chem. Soc., 2012, 134, 10317–10320 CrossRef CAS PubMed.
- J. Dommerholt, O. van Rooijen, A. Borrmann, C. F. Guerra, F. M. Bickelhaupt and F. L. van Delft, Nat. Commun., 2014, 5, 5378 CrossRef CAS PubMed.
- D. M. Patterson, L. A. Nazarova and J. A. Prescher, ACS Chem. Biol., 2014, 9, 592–605 CrossRef CAS PubMed.
- J. A. Prescher and C. R. Bertozzi, Nat. Chem. Biol., 2005, 1, 13–21 CrossRef CAS PubMed.
- Z. Wang, Y. Ma, H. Khalil, R. Wang, T. Lu, W. Zhao, Y. Zhang, J. Chen and T. Chen, Int. J. Nanomed., 2016, 11, 4025–4036 CrossRef CAS PubMed.
- L. Sercombe, T. Veerati, F. Moheimani, S. Y. Wu, A. K. Sood and S. Hua, Front. Pharmacol., 2015, 6, 286 Search PubMed.
- Y.-C. Yeh, T.-H. Huang, S.-C. Yang, C.-C. Chen and J.-Y. Fang, Front. Chem., 2020, 8, 286 CrossRef CAS PubMed.
- M. Gersch, F. Gut, V. S. Korotkov, J. Lehmann, T. Bottcher, M. Rusch, C. Hedberg, H. Waldmann, G. Klebe and S. A. Sieber, Angew. Chem., Int. Ed., 2013, 52, 3009–3014 CrossRef CAS PubMed.
- D. K. Struck, D. Hoekstra and R. E. Pagano, Biochemistry, 1981, 20, 4093–4099 CrossRef CAS PubMed.
- S. Sachetelli, H. Khalil, T. Chen, C. Beaulac, S. Senechal and J. Lagace, Biochim. Biophys. Acta, Biomembr., 2000, 1463, 254–266 CrossRef CAS.
- D. Choudhury and S. Saini, Lett. Appl. Microbiol., 2018, 66, 132–137 CrossRef CAS PubMed.
- G. L. Rosano and E. A. Ceccarelli, Front. Microbiol., 2014, 5, 172 Search PubMed.
- J. M. Fairhall, M. Murayasu, S. Dadhwal, S. Hook and A. B. Gamble, Org. Biomol. Chem., 2020, 18, 4754–4762 RSC.
- S. Xie, M. Sundhoro, K. N. Houk and M. Yan, Acc. Chem. Res., 2020, 53, 937–948 CrossRef CAS PubMed.
- J. Dommerholt, F. Rutjes and F. L. van Delft, Top. Curr. Chem., 2016, 374, 16 CrossRef PubMed.
- A. Nocker, P. Sossa-Fernandez, M. D. Burr and A. K. Camper, Appl. Environ. Microbiol., 2007, 73, 5111–5117 CrossRef CAS PubMed.
- J. C. T. Carlson, L. G. Meimetis, S. A. Hilderbrand and R. Weissleder, Angew. Chem., Int. Ed., 2013, 52, 6917–6920 CrossRef CAS PubMed.
- D. Ritz and J. Beckwith, Annu. Rev. Microbiol., 2001, 55, 21–48 CrossRef CAS PubMed.
- P. H. Clarke, J. Gen. Microbiol., 1953, 8, 397–407 CrossRef CAS PubMed.
- B. D. Fairbanks, T. F. Scott, C. J. Kloxin, K. S. Anseth and C. N. Bowman, Macromolecules, 2009, 42, 211–217 CrossRef CAS PubMed.
- R. van Geel, G. J. Pruijn, F. L. van Delft and W. C. Boelens, Bioconjugate Chem., 2012, 23, 392–398 CrossRef CAS PubMed.
- H. Tian, T. P. Sakmar and T. Huber, Chem. Commun., 2016, 52, 5451–5454 RSC.
- S. R. Shouldice, B. Heras, P. M. Walden, M. Totsika, M. A. Schembri and J. L. Martin, Antioxid. Redox Signal., 2011, 14, 1729–1760 CrossRef CAS PubMed.
- B. Ke, W. Wu, W. Liu, H. Liang, D. Gong, X. Hu and M. Li, Anal. Chem., 2016, 88, 592–595 CrossRef CAS PubMed.
- S. S. Matikonda, J. M. Fairhall, F. Fiedler, S. Sanhajariya, R. A. J. Tucker, S. Hook, A. L. Garden and A. B. Gamble, Bioconjugate Chem., 2018, 29, 324–334 CrossRef CAS PubMed.
- D. C. McCutcheon, M. A. Paley, R. C. Steinhardt and J. A. Prescher, J. Am. Chem. Soc., 2012, 134, 7604–7607 CrossRef CAS PubMed.
- R. Abedi Karjiban, N. S. Shaari, U. V. Gunasakaran and M. Basri, J. Chem., 2013, 2013, 931051 Search PubMed.
- D.-Y. Wang, H. C. Van Der Mei, Y. Ren, H. J. Busscher and L. Shi, Front. Chem., 2020, 7, 872 CrossRef PubMed.
- M. C. Smith, R. M. Crist, J. D. Clogston and S. E. McNeil, Anal. Bioanal. Chem., 2017, 409, 5779–5787 CrossRef CAS PubMed.
- M. Danaei, M. Dehghankhold, S. Ataei, F. Hasanzadeh Davarani, R. Javanmard, A. Dokhani, S. Khorasani and M. R. Mozafari, Pharmaceutics, 2018, 10, 57 CrossRef PubMed.
- R. S. Santos, C. Figueiredo, N. F. Azevedo, K. Braeckmans and S. C. De Smedt, Adv. Drug Deliv. Rev., 2018, 136–137, 28–48 CrossRef CAS PubMed.
- N. E. Eleraky, A. Allam, S. B. Hassan and M. M. Omar, Pharmaceutics, 2020, 12, 142 CrossRef CAS PubMed.
- J. C. Jewett and C. R. Bertozzi, Org. Lett., 2011, 13, 5937–5939 CrossRef CAS PubMed.
- Z. Drulis-Kawa, J. Gubernator, A. Dorotkiewicz-Jach, W. Doroszkiewicz and A. Kozubek, Cell. Mol. Biol. Lett., 2006, 11, 360 CAS.
- B. Spangler, S. Yang, C. M. Baxter Rath, F. Reck and B. Y. Feng, ACS Chem. Biol., 2019, 14, 725–734 CrossRef CAS PubMed.
Footnotes |
| † Electronic supplementary information (ESI) available. See https://doi.org/10.1039/d2ra02272a |
| ‡ These authors contributed equally to the work. |
| This journal is © The Royal Society of Chemistry 2022 |

