 Open Access Article
Characteristic analysis of three-ecofriendly reduced graphene oxides (rGOs) and their application in water–ethanol-based fluids with different volume ratios
Jun Xua,
Lingchao Lu a,
Guangbin Duanb and
Weilin Zhao
 *b
*b
aKey Laboratory of Building Materials Preparation and Testing Technology, University of Jinan, 250022 Jinan, People's Republic of China
bSchool of Material Science and Engineering, University of Jinan, 250022 Jinan, People's Republic of China. E-mail: zhaowl_ujn@126.com
First published on 16th February 2022
Abstract
In this paper, three-ecofriendly reduced graphene oxides (rGOs) were obtained by using three green reducing agents (beer, wine and cocoa) to reduce the graphene oxide (GO), and were labeled as B-rGO, W-rGO and C-rGO. Meanwhile, rGO nanofluids with different water–ethanol volume ratios (25![[thin space (1/6-em)]](https://www.rsc.org/images/entities/char_2009.gif) :
:![[thin space (1/6-em)]](https://www.rsc.org/images/entities/char_2009.gif) 75, 50
75, 50![[thin space (1/6-em)]](https://www.rsc.org/images/entities/char_2009.gif) :
:![[thin space (1/6-em)]](https://www.rsc.org/images/entities/char_2009.gif) 50, 75
50, 75![[thin space (1/6-em)]](https://www.rsc.org/images/entities/char_2009.gif) :
:![[thin space (1/6-em)]](https://www.rsc.org/images/entities/char_2009.gif) 25) were prepared based on three-ecofriendly rGOs. The structure properties of the three-ecofriendly rGOs were investigated by XRD, FR-IT, Raman spectroscopy and XPS analysis. Meanwhile, the thermophysical properties of rGO nanofluids were analyzed. Experimental results indicated that the stability and thermophysical properties of rGO nanofluids were slightly different, indicating that the properties of the nanofluids are dependent on the type of base fluids and nanoparticles. When the water–ethanol volume ratio was maintained at 25
25) were prepared based on three-ecofriendly rGOs. The structure properties of the three-ecofriendly rGOs were investigated by XRD, FR-IT, Raman spectroscopy and XPS analysis. Meanwhile, the thermophysical properties of rGO nanofluids were analyzed. Experimental results indicated that the stability and thermophysical properties of rGO nanofluids were slightly different, indicating that the properties of the nanofluids are dependent on the type of base fluids and nanoparticles. When the water–ethanol volume ratio was maintained at 25![[thin space (1/6-em)]](https://www.rsc.org/images/entities/char_2009.gif) :
:![[thin space (1/6-em)]](https://www.rsc.org/images/entities/char_2009.gif) 75, the stability experiment results showed that W-rGO nanofluids presented excellent stability, which indirectly confirmed their excellent thermal conductivity. Furthermore, the contact angle experiment indicated that the contact angles of rGO nanofluids decreased with the increase of temperature. In a word, these three rGOs and their nanofluids exhibited preferable properties that make them promising in the field of heat transfer.
75, the stability experiment results showed that W-rGO nanofluids presented excellent stability, which indirectly confirmed their excellent thermal conductivity. Furthermore, the contact angle experiment indicated that the contact angles of rGO nanofluids decreased with the increase of temperature. In a word, these three rGOs and their nanofluids exhibited preferable properties that make them promising in the field of heat transfer.
1. Introduction
The appearance of graphene in 2004 caused a sensation in the world, triggering a research boom in various fields.1 Graphene is a novel carbon-based nanomaterial with excellent optical, electrical and mechanical properties, which is composed of a hexagonal lattice of carbon atoms and sp2 hybrid orbitals. In view of the above properties, it shows considerable potential for applications in the field of materials science, biomedicine and drug delivery,2–4 and is regarded as an ideal material for the future.Graphene has been prepared in a variety of ways, with the earliest development of mechanical stripping and subsequent development of various preparation methods, such as electrochemical exfoliation,5,6 chemical vapor deposition,7,8 plasma-assisted ball milling9 and oxidation–reduction method.10–12 Among these methods, the REDOX method has the advantage of low cost, high yield, and mass production, which has become one of the effective ways to achieve large-amount preparation of graphene. The main raw materials of REDOX method are GO synthesized by the traditional modified Hummers method13 and reductants (such as hydrazine hydrate (N2H4·H2O)14 and sodium borohydride (NaBH4)15). However, these reducing agents have different degrees of toxicity and corrosiveness, and the preparation process is easy to cause environmental pollution. Therefore, researchers are working to develop efficient, controllable, friendly and inexpensive reductants. In recent years, various research teams have proposed different types of green reducing agents to replace traditional toxic reducing agents.16–20 Fan et al.21 used metallic iron as a reducing agent for the large-amount preparation of graphene nanosheets. The experimental results show that after mixing the iron powder and the GO solution evenly, the graphene can be prepared after 6 h reaction at room temperature. Jin et al.16 proposed a method to prepare graphene from sodium carbonate (Na2CO3). By X-photoelectron spectroscopy, the carbon–oxygen atom ratio of the graphene prepared after reduction increased from 2.48 to 8.15. Bo et al.22 treated GO with caffeic acid to obtain graphene products. Experimental studies have found that when the ratio of caffeic acid powder to GO powder is 50![[thin space (1/6-em)]](https://www.rsc.org/images/entities/char_2009.gif) :
:![[thin space (1/6-em)]](https://www.rsc.org/images/entities/char_2009.gif) 1 and the reaction time is 24 h, the C/O ratio in the graphene product can reach 7.15, and the contact angle increased from 36° to 92°. Cheng et al.23 used urushiol (an extract of natural sumac) to study the reduction of GO. TGA test results found that the reduced graphene sample has only 8% mass loss at 300 °C. Liu's research group24 adopted bovine serum albumin as raw material, and GO can be successfully reduced by adjusting the pH of the reaction. Experimental exploration had further confirmed that graphene nanosheets can be modified with bovine serum albumin, which was embodied as the extracellular matrix embedded on the surface of the graphene sheet. Yari et al.25 proposed using nettle extract synthesize graphene. The experimental results confirmed that the reducibility of nettle is close to hydrazine hydrate, but the graphene product after reduction of nettle has better dispersibility in the polyurethane matrix than hydrazine hydrate.
1 and the reaction time is 24 h, the C/O ratio in the graphene product can reach 7.15, and the contact angle increased from 36° to 92°. Cheng et al.23 used urushiol (an extract of natural sumac) to study the reduction of GO. TGA test results found that the reduced graphene sample has only 8% mass loss at 300 °C. Liu's research group24 adopted bovine serum albumin as raw material, and GO can be successfully reduced by adjusting the pH of the reaction. Experimental exploration had further confirmed that graphene nanosheets can be modified with bovine serum albumin, which was embodied as the extracellular matrix embedded on the surface of the graphene sheet. Yari et al.25 proposed using nettle extract synthesize graphene. The experimental results confirmed that the reducibility of nettle is close to hydrazine hydrate, but the graphene product after reduction of nettle has better dispersibility in the polyurethane matrix than hydrazine hydrate.
Graphene has excellent thermal conductivity and is an excellent choice for preparing nanofluids as nano-additives. Experimental studies have shown that the heat conduction efficiency of monolayer graphene is 3000–5000 W (m−1 K−1). Li et al.26 researched the supercooling degree of graphene/water nanofluids, and the experimental results indicated that the condensation time of graphene nanofluids with a surface mass fraction of 0.1% was 38% lower than that of the base liquid. Sadri et al.27 prepared GO nanofluids using a two-step method. Their experiments resealed the enhancement of thermal conductivity was 24.18% at 45 °C and viscosity was closer to the distilled water viscosity at low concentrations. Mehrali et al.28 adopted Hummer's method to prepare NDGs, and the influence of NDGs particle concentration on thermal conductivity of NDGs nanofluids was investigated. The results found that the electrical conductivity increased with the increase of NDG nanoparticles concentration, reaching 1814.96%. In general, the common base solutions for nanofluids include water, glycol, and methanol.29–33 However, the comparative analysis of the properties of graphene prepared with different reducing agents and its water–alcohol mixed-based nanofluid is still relatively rare.
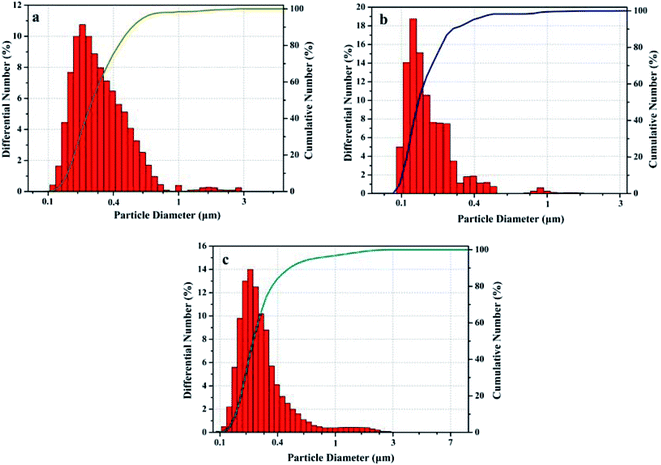
In this paper, the comparative analysis of the properties of graphene prepared with natural reductant (beer, wine, cocoa) and its water–alcohol mixed-based fluids were conducted. The structural differences of the main components of the three natural reducing agents were analyzed, and the microscopic morphology, stability, particle size and thermal conductivity and wettability of the water/ethanol mixed-based fluids of the three prepared reduced graphene oxides were compared. It expected that reduced graphene oxide (rGO) would have a broader application prospect in the field of heat transfer.
2. Experimental section
2.1 Reagents and chemicals
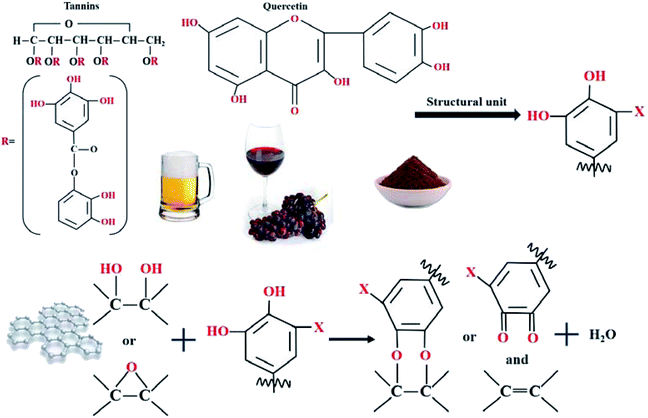
Flake graphite, sodium nitrate (NaNO3), hydrochloric acid (HCl, 37%), sulfuric acid (H2SO4, 98%), potassium permanganate (KMnO4, 99.9%), hydrogen peroxide (H2O2, 30%), sodium carbonate (NaCO3) and ammonia were procured from Alfa Aesar. All drugs are analytically pure. Beer (Budweiser Beer Co. Ltd, China), wine (Yantai Changyu Grape Brewing Co. Ltd, China) and cocoa (No Sikkim Cocoa Food Co. Ltd, China) are bought from a nearby supermarket and simply purified before be used. The content of tannic acid was determined by tannic acid analysis test method based on Chinese forestry standard LY/T 1642-2005. The content of tannic acid in beer, wine and cocoa was 13.35%, 19.92% and 8.75%, respectively. The water used throughout the experiments was DI-water.2.2 Preparation of GO
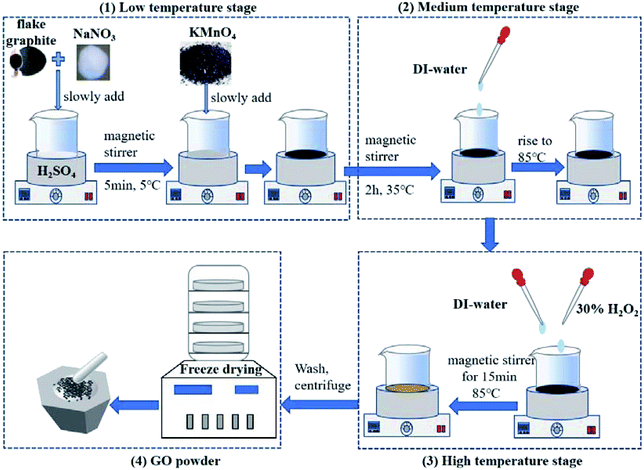
In brief, the steps for the preparation of GO are shown as follows: firstly, flake graphite and NaNO3 were slowly added to H2SO4 treated by ice water bath under the action of magnetic stirrer for 5 min. Then after slowly adding KMnO4, the solution turned dark green. The temperature of the whole reaction process should keep under 5 °C. Secondly, the dark green solution was stirred for 2 h at 35 °C, and then added DI-water drop by drop. After that, the water bath temperature rose to 85 °C, the solution color gradually became brown. Thirdly, the brown solution was stirred in 85 °C water bath for 15 min. After added DI-water and H2O2, the solution turned into bright yellow. Finally, the bright yellow solution was washed, centrifuged, and dried into GO powder. The flowchart of preparation of GO powder is shown in Fig. 1.2.3 Preparation of three-ecofriendly rGO
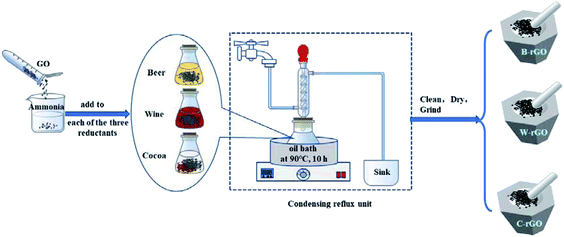
The preparation method of rGO from beer was similar to wine. Firstly, 50 mg GO was dispersed in 50 ml deionized water, and then dispersed evenly by ultrasound and mixed with 200 ml beer or wine the mixed solutions were kept continuously stirring in the oil bath at 90 °C for 10 h. This process requires condensation reflux to allow the reactants to react adequately and avoid loss. In all the synthesis, the final product was washed thoroughly with distilled water and anhydrous ethanol three times, respectively, centrifuged at 10![[thin space (1/6-em)]](https://www.rsc.org/images/entities/char_2009.gif) 000 rpm for 5 min, filtered to collect the precipitate, dried in a freeze dryer for 72 h, and grinded into three rGO powders, which were marked as B-rGO and W-rGO.
000 rpm for 5 min, filtered to collect the precipitate, dried in a freeze dryer for 72 h, and grinded into three rGO powders, which were marked as B-rGO and W-rGO.
When cocoa was used as reducing agent, it was necessary to adjust the pH of GO solution to 8 with 3 ml of 25% ammonia solution in advance, and the dosage of cocoa was 2.5 g. Other operation steps were the same as beer and wine. The flowchart of preparation is displayed in Fig. 2.
2.4 Characterization
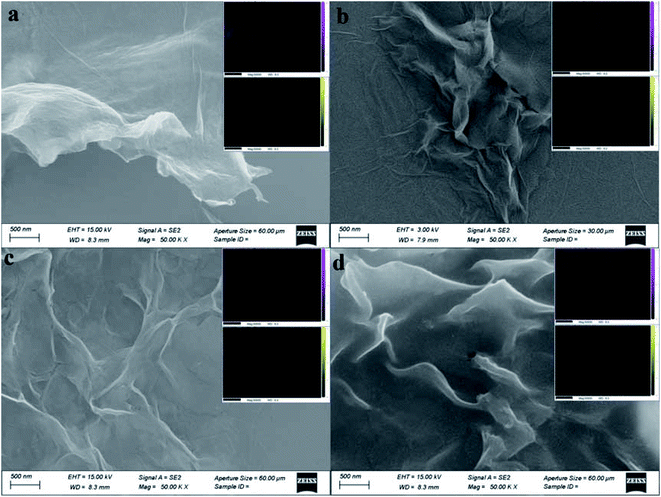
In this paper, a series of characterization methods were adopted to analyze the morphology and structure of GO and rGO. The morphology and element analysis of the GO and rGO was characterized by field-emission scanning electron microscope (FE-SEM) (Zeiss Sigma 300) and energy spectrum (Smart EDX). The structural properties of GO and rGO was represented by Fourier transform infrared (FT-IR) spectra (Nicolet 380, Thermo, American), Raman analysis (HORIBA Scientific LabRAM HR Evolution) and X-ray diffraction (XRD) (D8-ADVANCE, BRUKER, Germany). UV-visible spectrophotometer (UV-3600, Shimadzu, Japan), thermal conductivity meter (KD2-Pro, CEM, American), particle size analyzer (LS-13-320, Beckman Kurt, American) and contact angle meter (JC2000D1, Shanghai, China) were used to analyze the suspension stability, thermal conductivity, particle size and contact angle of rGO nanofluids. Furthermore, the measurement uncertainty of thermal conductivity meter is ±5%, and the measurement accuracy of contact angle is 0.1°. For accuracy, all data was measured twice to take the average value.3. Results and discussion
3.1 Characterization analysis of three-ecofriendly rGO
| C (weight%) | C (atomic%) | Error% | O (weight%) | O (atomic%) | Error% | |
|---|---|---|---|---|---|---|
| GO | 53.72 | 60.72 | 5.23 | 46.28 | 39.28 | 9.91 |
| B-rGO | 71.31 | 76.80 | 4.38 | 28.69 | 23.20 | 13.01 |
| W-rGO | 80.57 | 84.64 | 3.11 | 19.43 | 15.33 | 11.36 |
| C-rGO | 71.77 | 77.20 | 4.13 | 22.80 | 28.23 | 12.61 |
![[double bond, length as m-dash]](https://www.rsc.org/images/entities/char_e001.gif) O (carboxyl, epoxy), the stretching vibration peak of C
O (carboxyl, epoxy), the stretching vibration peak of C![[double bond, length as m-dash]](https://www.rsc.org/images/entities/char_e001.gif) C and the bending vibration peak of OH. While the band at 1004 cm−1 can be assigned to (C–O–C) group.34 The oxygen-containing bands of C
C and the bending vibration peak of OH. While the band at 1004 cm−1 can be assigned to (C–O–C) group.34 The oxygen-containing bands of C![[double bond, length as m-dash]](https://www.rsc.org/images/entities/char_e001.gif) O, C–O–C and C
O, C–O–C and C![[double bond, length as m-dash]](https://www.rsc.org/images/entities/char_e001.gif) C stretching are gradually eliminated with the presence of reducing agents, it can be seen that the peak of oxygen-containing functional groups in the three kinds of rGO is significantly weakened, while the intensity of the hydroxyl band at 3450 cm−1 was clearly decremental.35 Raman test analysis was conducted to further characterize GO and three-ecofriendly rGO. As shown in Fig. 4(b), Raman spectra indicated that there were three main characteristic peaks: the G peak is the main characteristic peak of rGO located near 1592 cm−1, which arise from the in-plane vibration of sp2 carbon atoms. While the D peak generally regards as the disordered vibration peak of rGO and used to characterize structural defects or edges in rGO samples, which appear at 1353 cm−1. The more defects there are in the preparation and composite process, the stronger the strength of D peak is. The strength ratio of ID/IG serves as a measure of the disorder degree of rGO carbon nanomaterials. Meanwhile, the intensity ratio (ID/IG) of GO was 0.89, the ID/IG of B-rGO, W-rGO and C-rGO was 0.93, 1.08 and 0.95, respectively. The variational strength ratio may be mainly due to the reduction of rGO with the introduction of reducing agent, which increases the order degree of graphene.36 In addition, the XRD patterns of graphite, GO and rGO were shown in Fig. 4(c) and (d). It can be seen from Fig. 6 that the natural graphite powder has a sharp and strong diffraction peak at 2θ = 26°, corresponding to the characteristic diffraction peak of graphite. In contrast, the diffraction peak at 2θ = 10.2° is a characteristic peak of GO and corresponds to the (002) crystal plane. Furthermore, when GO was reduced to rGO, the diffraction peak of the crystal plane (002) of GO disappears, and a new diffraction peak appears at around 2θ = 23° and shows the initial amorphous structure, indicating that the functional groups of GO have been efficiently eliminated.35 The XRD characterization results of the reported graphene are consistent, further illustrating the formation of rGO.37,38 At the same time, the diffraction peak width of rGO increased due to the reduction of the size of rGO and the appearance of incomplete crystal structure. Compared to the XRD curves of three kinds of rGO, W-rGO has the highest peak intensity and the most complete reduction, while B-rGO and C-rGO has other small diffraction peaks, indicating that the number of layers is large.
C stretching are gradually eliminated with the presence of reducing agents, it can be seen that the peak of oxygen-containing functional groups in the three kinds of rGO is significantly weakened, while the intensity of the hydroxyl band at 3450 cm−1 was clearly decremental.35 Raman test analysis was conducted to further characterize GO and three-ecofriendly rGO. As shown in Fig. 4(b), Raman spectra indicated that there were three main characteristic peaks: the G peak is the main characteristic peak of rGO located near 1592 cm−1, which arise from the in-plane vibration of sp2 carbon atoms. While the D peak generally regards as the disordered vibration peak of rGO and used to characterize structural defects or edges in rGO samples, which appear at 1353 cm−1. The more defects there are in the preparation and composite process, the stronger the strength of D peak is. The strength ratio of ID/IG serves as a measure of the disorder degree of rGO carbon nanomaterials. Meanwhile, the intensity ratio (ID/IG) of GO was 0.89, the ID/IG of B-rGO, W-rGO and C-rGO was 0.93, 1.08 and 0.95, respectively. The variational strength ratio may be mainly due to the reduction of rGO with the introduction of reducing agent, which increases the order degree of graphene.36 In addition, the XRD patterns of graphite, GO and rGO were shown in Fig. 4(c) and (d). It can be seen from Fig. 6 that the natural graphite powder has a sharp and strong diffraction peak at 2θ = 26°, corresponding to the characteristic diffraction peak of graphite. In contrast, the diffraction peak at 2θ = 10.2° is a characteristic peak of GO and corresponds to the (002) crystal plane. Furthermore, when GO was reduced to rGO, the diffraction peak of the crystal plane (002) of GO disappears, and a new diffraction peak appears at around 2θ = 23° and shows the initial amorphous structure, indicating that the functional groups of GO have been efficiently eliminated.35 The XRD characterization results of the reported graphene are consistent, further illustrating the formation of rGO.37,38 At the same time, the diffraction peak width of rGO increased due to the reduction of the size of rGO and the appearance of incomplete crystal structure. Compared to the XRD curves of three kinds of rGO, W-rGO has the highest peak intensity and the most complete reduction, while B-rGO and C-rGO has other small diffraction peaks, indicating that the number of layers is large.
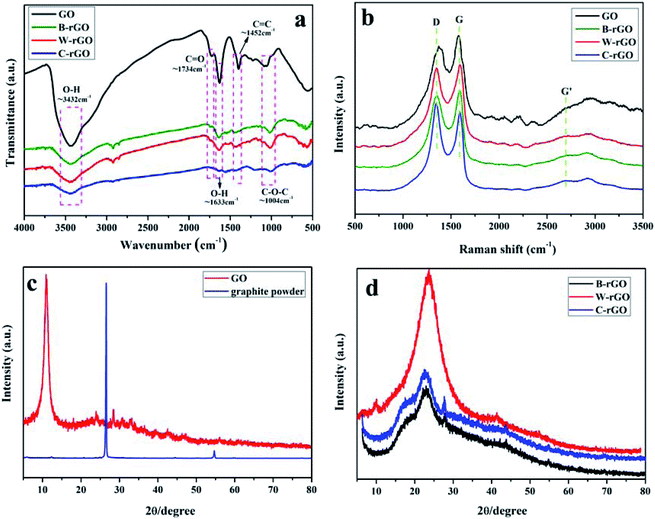 | ||
| Fig. 4 (a) FT-IR spectrum and (b) Raman spectrum of GO, B-rGO, W-rGO and C-rGO, (c) XRD pattern of GO and graphite powder, (d) XRD pattern of B-rGO, W-rGO and C-rGO. | ||
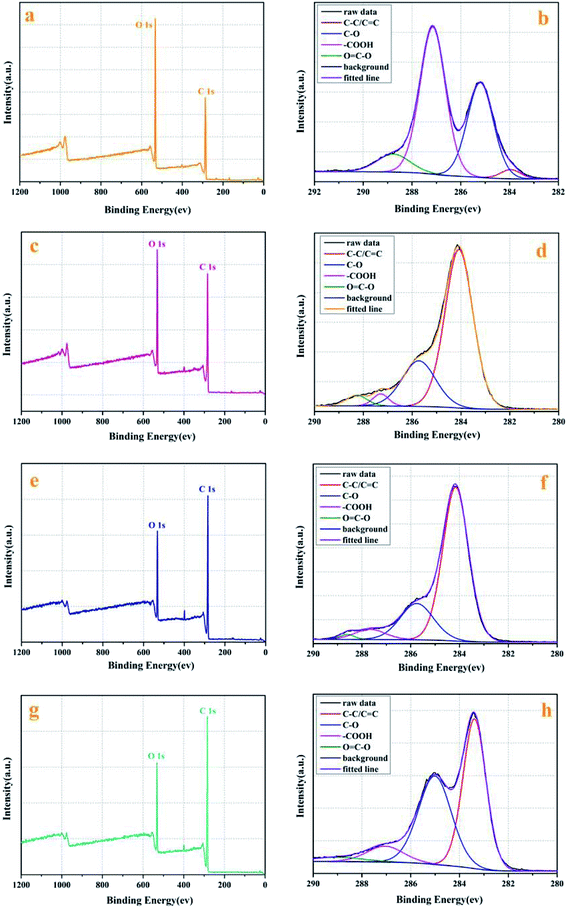
![[double bond, length as m-dash]](https://www.rsc.org/images/entities/char_e001.gif) C (∼284.1 eV), C–O (∼285.7 eV), a carboxyl group (–COOH) at ∼287.2 eV and O
C (∼284.1 eV), C–O (∼285.7 eV), a carboxyl group (–COOH) at ∼287.2 eV and O![[double bond, length as m-dash]](https://www.rsc.org/images/entities/char_e001.gif) C–O (288.2 eV), separately. By comparing the full survey spectra of GO and rGO, it can be found that the content of O element of unreduced GO was relatively high, which was related to a large amount of C
C–O (288.2 eV), separately. By comparing the full survey spectra of GO and rGO, it can be found that the content of O element of unreduced GO was relatively high, which was related to a large amount of C![[double bond, length as m-dash]](https://www.rsc.org/images/entities/char_e001.gif) O bonds. The content of O element in the three rGO was reduced, which was attributed to the reduction of reducing agent. However, it could be seen that the reduction was not complete due to the limited reduction components of the reducing agent, which was consistent with the test results of FT-IR spectrum.
O bonds. The content of O element in the three rGO was reduced, which was attributed to the reduction of reducing agent. However, it could be seen that the reduction was not complete due to the limited reduction components of the reducing agent, which was consistent with the test results of FT-IR spectrum.3.2 Performance analysis applied in nanofluids
![[thin space (1/6-em)]](https://www.rsc.org/images/entities/char_2009.gif) :
:![[thin space (1/6-em)]](https://www.rsc.org/images/entities/char_2009.gif) 75, 50
75, 50![[thin space (1/6-em)]](https://www.rsc.org/images/entities/char_2009.gif) :
:![[thin space (1/6-em)]](https://www.rsc.org/images/entities/char_2009.gif) 50 and 75
50 and 75![[thin space (1/6-em)]](https://www.rsc.org/images/entities/char_2009.gif) :
:![[thin space (1/6-em)]](https://www.rsc.org/images/entities/char_2009.gif) 25, respectively) to obtain rGO nanofluids with a concentration of 0.1 mg ml−1. Furthermore, in the process of preparing rGO nanofluids, rGO were mixed with the base fluids according to a certain concentration, and at room temperature for 15 min in the ultrasonic dispersion of ultrasonic vibration, to disperse the nanoparticles evenly and reduce agglomeration. In order to prevent adverse effects of excessive local temperature on nanofluids, the ultrasonic mode selected in the experiment was intermittent, with ultrasonic every 60 s and ultrasonic time of one time being 60 s.
25, respectively) to obtain rGO nanofluids with a concentration of 0.1 mg ml−1. Furthermore, in the process of preparing rGO nanofluids, rGO were mixed with the base fluids according to a certain concentration, and at room temperature for 15 min in the ultrasonic dispersion of ultrasonic vibration, to disperse the nanoparticles evenly and reduce agglomeration. In order to prevent adverse effects of excessive local temperature on nanofluids, the ultrasonic mode selected in the experiment was intermittent, with ultrasonic every 60 s and ultrasonic time of one time being 60 s.Excellent suspension stability is the basis for the application of nanofluids. In this paper, the stability of three rGO nanofluids was evaluated by natural sedimentation method and absorbance method. Fig. 8 displays the sedimentation results of three rGO nanofluids (from left to right are B-rGO nanofluids, W-rGO nanofluids and C-rGO nanofluids) with a water/ethanol-based solution (25![[thin space (1/6-em)]](https://www.rsc.org/images/entities/char_2009.gif) :
:![[thin space (1/6-em)]](https://www.rsc.org/images/entities/char_2009.gif) 75) after standing for 10, 20 and 30 days, respectively. By comparison, it can be found that W-rGO nanofluids have no obvious precipitation phenomenon within 30 days, indicating its excellent stability, which is consistent with the results of particle size distribution.
75) after standing for 10, 20 and 30 days, respectively. By comparison, it can be found that W-rGO nanofluids have no obvious precipitation phenomenon within 30 days, indicating its excellent stability, which is consistent with the results of particle size distribution.
 | ||
Fig. 8 Static diagram of three rGO nanofluids with a water/ethanol-based solution (25![[thin space (1/6-em)]](https://www.rsc.org/images/entities/char_2009.gif) : :![[thin space (1/6-em)]](https://www.rsc.org/images/entities/char_2009.gif) 75): (a) 10 days, (b) 20 days, (c) 30 days. 75): (a) 10 days, (b) 20 days, (c) 30 days. | ||
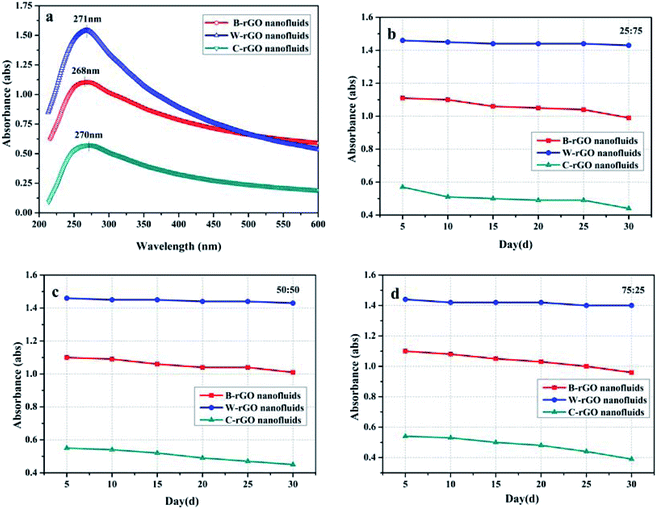
To further characterize the dispersion of the three rGO nanofluids, the absorbance of rGO nanofluids was measured using an ultraviolet-visible spectrophotometer. Due to rGO splits at 270 nm in the UV-vis spectrum is mainly related to the two conjugation effects of the π–π* conjugate system,42,43 and its maximum absorption wavelength is located at 270 nm on the UV-vis spectrum (shown in Fig. 9(a)), therefore 270 nm was selected for measurement. Fig. 9(b)–(d) display the absorbance of three rGO nanofluids in three water/ethanol mixed-based fluids varied with time. It can be found that within 30 days, the absorbance of rGO nanofluids decreased slightly, indicating that the prepared rGO nanofluids were relatively stable. In addition, in the three water/ethanol mixed-based fluids, W-rGO nanofluids had the smallest change in absorbance within 30 days, with rates of change of about 3.6%, 7.27% and 3.63%, respectively, indicating that W-rGO nanofluids had the best stability, which is consistent with the results of the static figure in Fig. 8.
![[thin space (1/6-em)]](https://www.rsc.org/images/entities/char_2009.gif) :
:![[thin space (1/6-em)]](https://www.rsc.org/images/entities/char_2009.gif) 75, 50
75, 50![[thin space (1/6-em)]](https://www.rsc.org/images/entities/char_2009.gif) :
:![[thin space (1/6-em)]](https://www.rsc.org/images/entities/char_2009.gif) 50, and 75
50, and 75![[thin space (1/6-em)]](https://www.rsc.org/images/entities/char_2009.gif) :
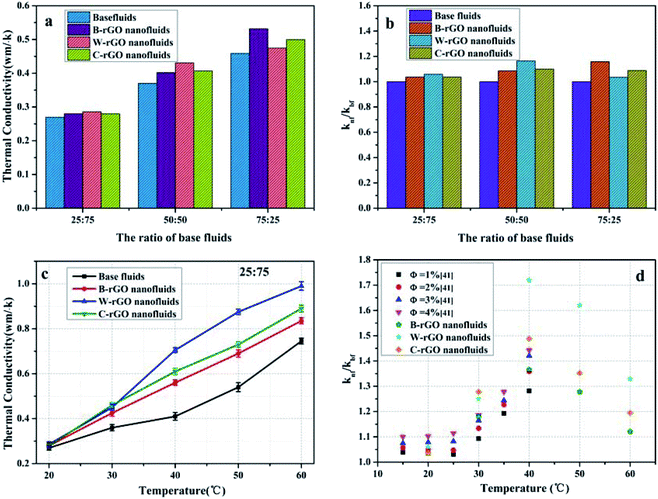
:![[thin space (1/6-em)]](https://www.rsc.org/images/entities/char_2009.gif) 25 water/ethanol mixed-based fluids at room temperature. The thermal conductivity of rGO nanofluids is higher than that of the base fluids. Fig. 10(b) displays the thermal conductivity ratio of the rGO nanofluids to base fluids. As we can see, the thermal conductivity ratio of W-rGO nanofluids is 1.165 at the ratio of 50
25 water/ethanol mixed-based fluids at room temperature. The thermal conductivity of rGO nanofluids is higher than that of the base fluids. Fig. 10(b) displays the thermal conductivity ratio of the rGO nanofluids to base fluids. As we can see, the thermal conductivity ratio of W-rGO nanofluids is 1.165 at the ratio of 50![[thin space (1/6-em)]](https://www.rsc.org/images/entities/char_2009.gif) :
:![[thin space (1/6-em)]](https://www.rsc.org/images/entities/char_2009.gif) 50, while the ratio of B-rGO nanofluids is 1.159 at the ratio of 75
50, while the ratio of B-rGO nanofluids is 1.159 at the ratio of 75![[thin space (1/6-em)]](https://www.rsc.org/images/entities/char_2009.gif) :
:![[thin space (1/6-em)]](https://www.rsc.org/images/entities/char_2009.gif) 25. Furthermore, the tendency of thermal conductivity of four fluids with temperature at 25
25. Furthermore, the tendency of thermal conductivity of four fluids with temperature at 25![[thin space (1/6-em)]](https://www.rsc.org/images/entities/char_2009.gif) :
:![[thin space (1/6-em)]](https://www.rsc.org/images/entities/char_2009.gif) 75 water/ethanol-based fluids ratios were analyzed (Fig. 10(c)). The Brownian motion of the rGO sheet layer inside the nanofluid becomes intense with the increase of temperature, and the microconvection between it and the base fluid is enhanced, which accelerates the energy transfer. Therefore, the thermal conductivity of the rGO nanofluids increases with the increase of temperature. Fig. 10(d) compares the experimental data with the references data.41 It can be seen that both the experimental data and the reference data show the maximum value of knf/kbf at 40 °C, indicating that the thermal conductivity increases the most and the heat transfer effect is the best at 40 °C, and the experimental data is also higher than the data in the reference, which indicates the rGO nanofluids in the experiment have better heat transfer effect.
75 water/ethanol-based fluids ratios were analyzed (Fig. 10(c)). The Brownian motion of the rGO sheet layer inside the nanofluid becomes intense with the increase of temperature, and the microconvection between it and the base fluid is enhanced, which accelerates the energy transfer. Therefore, the thermal conductivity of the rGO nanofluids increases with the increase of temperature. Fig. 10(d) compares the experimental data with the references data.41 It can be seen that both the experimental data and the reference data show the maximum value of knf/kbf at 40 °C, indicating that the thermal conductivity increases the most and the heat transfer effect is the best at 40 °C, and the experimental data is also higher than the data in the reference, which indicates the rGO nanofluids in the experiment have better heat transfer effect.
![[thin space (1/6-em)]](https://www.rsc.org/images/entities/char_2009.gif) :
:![[thin space (1/6-em)]](https://www.rsc.org/images/entities/char_2009.gif) 75, 50
75, 50![[thin space (1/6-em)]](https://www.rsc.org/images/entities/char_2009.gif) :
:![[thin space (1/6-em)]](https://www.rsc.org/images/entities/char_2009.gif) 50 and 75
50 and 75![[thin space (1/6-em)]](https://www.rsc.org/images/entities/char_2009.gif) :
:![[thin space (1/6-em)]](https://www.rsc.org/images/entities/char_2009.gif) 25, respectively. It can be seen that the wettability of B-rGO nanofluids with water–ethanol mixed-based fluids ratio is preferably. While it intuitively observed from Fig. 11 that the contact angle of the nanofluids with different base fluids ratios changes, and the contact angle increases with the increase of the proportion of water in the base fluids.
25, respectively. It can be seen that the wettability of B-rGO nanofluids with water–ethanol mixed-based fluids ratio is preferably. While it intuitively observed from Fig. 11 that the contact angle of the nanofluids with different base fluids ratios changes, and the contact angle increases with the increase of the proportion of water in the base fluids.
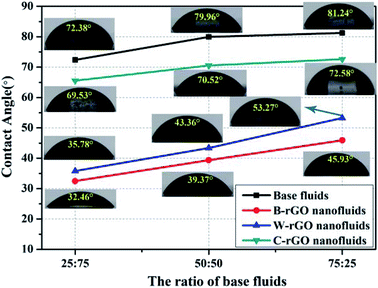 | ||
| Fig. 11 Contact angle of base fluids and rGO nanofluids at different ratios of water–ethanol mixed-based fluids. | ||
At room temperature, the contact angle of different fluids with ratios of 25![[thin space (1/6-em)]](https://www.rsc.org/images/entities/char_2009.gif) :
:![[thin space (1/6-em)]](https://www.rsc.org/images/entities/char_2009.gif) 75, 50
75, 50![[thin space (1/6-em)]](https://www.rsc.org/images/entities/char_2009.gif) :
:![[thin space (1/6-em)]](https://www.rsc.org/images/entities/char_2009.gif) 50 and 75
50 and 75![[thin space (1/6-em)]](https://www.rsc.org/images/entities/char_2009.gif) :
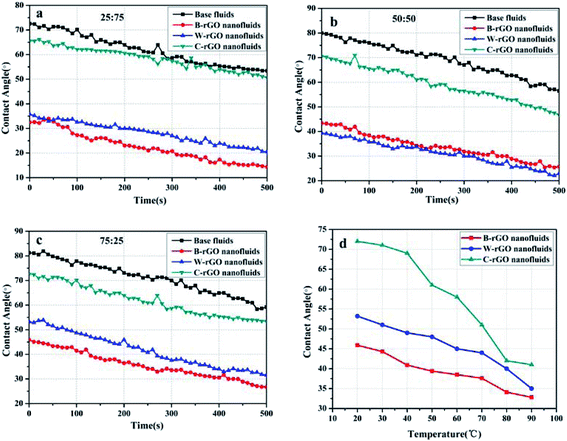
:![[thin space (1/6-em)]](https://www.rsc.org/images/entities/char_2009.gif) 25 was measured over time. The trend is shown in Fig. 12(a)–(c). As you can see, with the increase of time, the contact angle of the four fluids decreases gradually, and the decrease degree of the contact angle of the effluent was larger than that of the nanofluids in the three different water–ethanol ratio fluids. For example, in the 25
25 was measured over time. The trend is shown in Fig. 12(a)–(c). As you can see, with the increase of time, the contact angle of the four fluids decreases gradually, and the decrease degree of the contact angle of the effluent was larger than that of the nanofluids in the three different water–ethanol ratio fluids. For example, in the 25![[thin space (1/6-em)]](https://www.rsc.org/images/entities/char_2009.gif) :
:![[thin space (1/6-em)]](https://www.rsc.org/images/entities/char_2009.gif) 75 ratio of water–ethanol mixed-based fluids, the decrease rate of base fluids is 0.038° s−1, while the rate of B-rGO nanofluids, W-rGO nanofluids and C-rGO nanofluids is 0.036° s−1, 0.0334° s−1 and 0.0297° s−1, respectively, which is seem to related to the interaction between the nanoparticles and the base fluids in the nanofluids. It has been reported to analyze the relationship between dynamic contact angle and time.45 Furthermore, temperature is an important factor, which can affect the contact angle of nanofluids. Taking three rGO nanofluids with a water–ethanol ratio of 75
75 ratio of water–ethanol mixed-based fluids, the decrease rate of base fluids is 0.038° s−1, while the rate of B-rGO nanofluids, W-rGO nanofluids and C-rGO nanofluids is 0.036° s−1, 0.0334° s−1 and 0.0297° s−1, respectively, which is seem to related to the interaction between the nanoparticles and the base fluids in the nanofluids. It has been reported to analyze the relationship between dynamic contact angle and time.45 Furthermore, temperature is an important factor, which can affect the contact angle of nanofluids. Taking three rGO nanofluids with a water–ethanol ratio of 75![[thin space (1/6-em)]](https://www.rsc.org/images/entities/char_2009.gif) :
:![[thin space (1/6-em)]](https://www.rsc.org/images/entities/char_2009.gif) 25 as an example, the change in contact angle at different temperature was measured, and the effect of temperature on contact angles was explored. Fig. 12(d) shows the contact angle of B-rGO nanofluids, W-rGO nanofluids and C-rGO nanofluids at different temperature. As the temperature increases, the contact angle of the three rGO nanofluids all decreases. In general, the higher the temperature, the more violent the movement of nanoparticles in the nanofluids, the stronger the fluidity of the nanofluids, and the smaller the contact angle. The reduction degree in the contact angle of B-rGO nanofluids is the smallest, and the affection of temperature is the least, which indicating that B-rGO nanofluids can better adapt to the temperature change in the heat transfer process.44
25 as an example, the change in contact angle at different temperature was measured, and the effect of temperature on contact angles was explored. Fig. 12(d) shows the contact angle of B-rGO nanofluids, W-rGO nanofluids and C-rGO nanofluids at different temperature. As the temperature increases, the contact angle of the three rGO nanofluids all decreases. In general, the higher the temperature, the more violent the movement of nanoparticles in the nanofluids, the stronger the fluidity of the nanofluids, and the smaller the contact angle. The reduction degree in the contact angle of B-rGO nanofluids is the smallest, and the affection of temperature is the least, which indicating that B-rGO nanofluids can better adapt to the temperature change in the heat transfer process.44
4. Conclusion
Beer, wine and cocoa were used as green reductants to prepare three kinds of rGO successfully through REDOX method, and the differences in microstructure and stability of these rGO were analyzed due to the different reductants. The analysis results show that the three kinds of rGO have certain differences in particle size distribution and stability, in which W-rGO particle size distribution is more concentrated, and the stability is relatively excellent within 30 days. Furthermore, nine rGO nanofluids were prepared using mixtures of different volume ratios of water and ethanol (25![[thin space (1/6-em)]](https://www.rsc.org/images/entities/char_2009.gif) :
:![[thin space (1/6-em)]](https://www.rsc.org/images/entities/char_2009.gif) 75, 50
75, 50![[thin space (1/6-em)]](https://www.rsc.org/images/entities/char_2009.gif) :
:![[thin space (1/6-em)]](https://www.rsc.org/images/entities/char_2009.gif) 50 and 75
50 and 75![[thin space (1/6-em)]](https://www.rsc.org/images/entities/char_2009.gif) :
:![[thin space (1/6-em)]](https://www.rsc.org/images/entities/char_2009.gif) 25) as the base fluids, and the thermal conductivity and wetting properties of the rGO nanofluids were characterized. When water–ethanol volume ratio is 25
25) as the base fluids, and the thermal conductivity and wetting properties of the rGO nanofluids were characterized. When water–ethanol volume ratio is 25![[thin space (1/6-em)]](https://www.rsc.org/images/entities/char_2009.gif) :
:![[thin space (1/6-em)]](https://www.rsc.org/images/entities/char_2009.gif) 75 and 50
75 and 50![[thin space (1/6-em)]](https://www.rsc.org/images/entities/char_2009.gif) :
:![[thin space (1/6-em)]](https://www.rsc.org/images/entities/char_2009.gif) 50, W-rGO nanofluids have a relatively good thermal conductivity, while B-rGO nanofluids have the best thermal conductivity when the volume ratio is 75
50, W-rGO nanofluids have a relatively good thermal conductivity, while B-rGO nanofluids have the best thermal conductivity when the volume ratio is 75![[thin space (1/6-em)]](https://www.rsc.org/images/entities/char_2009.gif) :
:![[thin space (1/6-em)]](https://www.rsc.org/images/entities/char_2009.gif) 25. Therefore, the thermal conductivity of the nanofluids is affected not only nanoparticles but also base fluids. In addition, the contact angle of rGO nanofluids decreases with the increase of time and temperature. It seems that the decrease degree of contact angle is different due to the different force of different nanoparticles on the base fluids.
25. Therefore, the thermal conductivity of the nanofluids is affected not only nanoparticles but also base fluids. In addition, the contact angle of rGO nanofluids decreases with the increase of time and temperature. It seems that the decrease degree of contact angle is different due to the different force of different nanoparticles on the base fluids.
Conflicts of interest
There are no conflicts to declare.Acknowledgements
This research is support by the National Natural Science Foundation of China-Shandong Joint Fund (No. U1806222) and the Natural Science Foundation of Shandong Province (No. ZR2016QL004).References
- K. S. Novoselov, A. K. Geim, S. V. Morozov, D. Jiang, Y. Zhang, S. V. Dubonos, I. V. Grigorieva and A. A. Firsov, Science, 2004, 306(66), 6–9 Search PubMed.
- C. Zhu, D. Du and Y. Lin, Biosens. Bioelectron., 2017, 89, 43–55 CrossRef CAS PubMed.
- C. A. Ubani, M. A. Ibrahim, M. A. M. Teridi, K. Sopian, J. Ali and K. T. Chaudhary, Sol. Energy, 2016, 137, 531–550 CrossRef CAS.
- A. Nélia, V. César, D. Daniel, A. F. A. Nuno, G. Gil, L. P. João, A. A. P. M. Paula, N. Rogério and N. Victor, Mater. Today: Proc., 2015, 2, 171–177 Search PubMed.
- O. Yasin, K. Hossein, A. Omid, A. Mahnaz, H. Shilan, K. Salah and S. N. Masoud, J. Alloys Compd., 2020, 848, 156495 CrossRef.
- Š. Václav, H. Jiří, B. Jana, E. Petra and K. Martin, Ultrason. Sonochem., 2015, 24, 65–71 CrossRef PubMed.
- X. Li, L. Colombo and R. S. Ruoff, Adv. Mater., 2016, 28, 6247–6252 CrossRef CAS PubMed.
- Y. Shi, C. Hamsen, X. Jia, K. K. Kim, A. Reina, M. Hofmann, A. L. Hsu, K. Zhang, H. Li, Z. Y. Juang, M. S. Dresselhaus, L. J. Li and J. Kong, Nano Lett., 2010, 10, 4134–4139 CrossRef CAS PubMed.
- C. Lin, L. Yang, L. Ouyang, J. Liu, H. Wang and M. Zhu, J. Alloys Compd., 2017, 728, 578–584 CrossRef CAS.
- C. A. Amarnath, C. E. Hong, N. H. Kim, B. C. Ku, T. Kuila and J. H. Lee, Carbon, 2011, 49, 3497–3502 CrossRef CAS.
- S. Wakeland, R. Martinez, J. K. Grey and C. C. Luhrs, Carbon, 2010, 48, 3464–3470 CrossRef.
- Z. Fan, K. Wang, T. Wei, J. Yan, L. Song and B. Shao, Carbon, 2010, 48, 1686–1689 CrossRef CAS.
- W. S. Hummers and R. E. Offeman, J. Am. Chem. Soc., 1958, 80, 1339 CrossRef CAS.
- S. Stankovich, D. A. Dikin, R. D. Piner, K. A. Kohlhaas, A. Kleinhammes, Y. Jia, Y. Wu, S. T. Nguyen and R. S. Ruoff, Carbon, 2007, 45(7), 1558–1565 CrossRef CAS.
- H. J. Shin, K. K. Kim, A. Benayad, S. M. Yoon, H. K. Park, I. S. Jung, M. H. Jin, H. K. Jeong, J. M. Kim, J. Y. Choi and Y. H. Lee, Adv. Funct. Mater., 2009, 19(12), 1987–1992 CrossRef CAS.
- D. Chen, L. Li and L. Guo, Nanotechnology, 2011, 22, 325601 CrossRef PubMed.
- Y. Jin, S. Huang, M. Zhang, M. Jia and D. Hu, Appl. Surf. Sci., 2013, 268, 541–546 CrossRef CAS.
- K. Tewatia, A. Sharma, M. Sharma and A. Kumar, Mater. Today: Proc., 2021, 44, 3933–3938 CAS.
- S. W. Chong, C. W. Lia and S. B. A. Hamid, Ceram. Int., 2015, 41, 9505–9513 CrossRef CAS.
- A. T. Mahmoud, T. Azam, D. Vivek, Y. R. Kyong and S. J. Park, J. Ind. Eng. Chem., 2014, 20, 4327–4331 CrossRef.
- Z. J. Fan, W. Kai, J. Yan, T. Wei, L. J. Zhi, J. Feng, Y. Ren, L. P. Song and F. Wei, ACS Nano, 2011, 5(1), 191–198 CrossRef CAS PubMed.
- Z. Bo, X. Shuai, S. Mao, H. Yang, J. Qian, J. Chen, J. Yan and K. Cen, Sci. Rep., 2014, 4, 4684 CrossRef PubMed.
- H. Cheng, J. Lin, Y. Su, D. Chen, X. Zheng and H. Zhu, Mater. Today Commun., 2020, 23, 100938 CrossRef CAS.
- J. Liu, S. Fu, B. Yuan, Y. Li and Z. Deng, J. Am. Chem. Soc., 2010, 132(21), 7279–7281 CrossRef CAS PubMed.
- M. Mahmudzadeh, H. Yari, B. Ramezanzadeh and M. Mahdavian, J. Ind. Eng. Chem., 2019, 78, 125–136 CrossRef CAS.
- X. Li, Y. Chen, Z. Cheng, L. Jia, S. Mo and Z. Liu, Appl. Energy, 2014, 130(5), 824–829 CrossRef CAS.
- R. Sadri, M. Hosseini, S. Kazi, S. Bagheri, N. Zubir, G. Ahmadi, M. Dahari and T. Zaharinie, Chem. Phys. Lett., 2017, 675, 92–97 CrossRef CAS.
- M. Mehrali, E. Sadeghinezhad, M. M. Rashidi, A. R. Akhiani, S. T. Latibari, M. Mehrali and H. S. C. Metselaar, J. Nanopart. Res., 2015, 17(6), 267 CrossRef.
- M. Mohammad, S. Emad, A. Reza, R. A. Amir, T. L. Sara, M. Mehdi and S. C. M. Hendrik, Energy Convers. Manage., 2016, 118, 459–473 CrossRef.
- Y. P. Hu, Y. R. Li, L. Lu, Y. J. Mao and M. H. Li, Int. J. Therm. Sci., 2020, 152, 106309 CrossRef CAS.
- V. V. Wanatasanapan, M. Z. Abdullah and P. Gunnasegaran, J. Mater. Res. Technol., 2020, 9, 13781–13792 CrossRef CAS.
- T. J. Choi, S. H. Kim, S. P. Jang, J. D. Yang and Y. M. Byeon, Appl. Therm. Eng., 2020, 180, 115780 CrossRef CAS.
- S. N. Abbas Shah, S. Shahabuddin, M. F. Mohd Sabri, M. F. Mohd Salleh, A. M. Ali, N. Hayat, N. A. Che Sidik, M. Samykano and R. Saidur, Int. J. Heat Mass Transfer, 2020, 150, 118981 CrossRef.
- K. Kanishka, H. D. Silva, H. H. Huang and M. Yoshimura, Appl. Surf. Sci., 2018, 447, 338–346 CrossRef.
- T. Kuila, S. Bose, P. Khanra, A. K. Mishra, N. H. Kim and J. H. Lee, Carbon, 2012, 50, 914–921 CrossRef CAS.
- Z. Ma, P. Song, Z. Yang and Q. Wang, Appl. Surf. Sci., 2019, 465, 625–634 CrossRef CAS.
- K. Wang, Q. Ma, K. Pang, B. Ding, J. Zhang and Y. Duan, Carbohydr. Polym., 2018, 194, 146–153 CrossRef CAS PubMed.
- H. R. Zhao, B. Y. Xu, J. H. Ding, Z. Wang and H. B. Yu, ACS Sustainable Chem. Eng., 2019, 7(23), 18819–18825 CrossRef CAS.
- R. Kamatchi and G. Kumaresan, Chin. J. Chem. Eng., 2018, 26, 445–454 CrossRef CAS.
- B. E. Mary and M. E. Marguerite, Nutr. Res., 2004, 24, 695–706 CrossRef.
- M. Mohammad, S. Emad, R. A. Amir, T. L. Sara, T. Sepehr, D. P. Alireza, C. M. Hendrik Simon and M. Mehdi, J. Cleaner Prod., 2016, 137, 555–566 CrossRef.
- S. Coe, E. Axelsson, V. Murphy, M. Santos, J. Collett, M. Clegg, H. Izadi, J. M. Harrison, E. Buckingham and H. Dawes, Clin. Nutr. ESPEN, 2017, 21, 20–25 CrossRef CAS PubMed.
- Y. L. Xu, H. X. Li, C. B. Zhou, X. S. Xiao, Z. C. Bai, Z. P. Zhang and S. J. Qin, Optik, 2020, 219, 165015 CrossRef CAS.
- J. Chinnam, D. Das, R. Vajjha, R. Vajjha and J. Satti, Int. Commun. Heat Mass Transfer, 2015, 62, 1–12 CrossRef CAS.
- M. J. Vega, D. Seveno, G. Lemaur, M. H. Adao and J. De Coninck, Langmuir, 2005, 21, 9584–9590 CrossRef CAS PubMed.
| This journal is © The Royal Society of Chemistry 2022 |

