 Open Access Article
A novel metallic silvery color caused by pointillistic mixing of disordered nano-to micro-pixels of iridescent colors†
Xijin Pan ,
Haoyang Chi,
Chunyi Luo,
Xin Feng
 ,
YongChun Huang and
Gangsheng Zhang*
School of Resources, Environment and Materials, Guangxi University, 100 Daxue Road, Nanning, Guangxi 530004, China. E-mail: zhanggs@gxu.edu.cn
First published on 16th February 2022
Abstract
Rich iridescent structural colors in nature, such as peacock feathers, butterfly wings, beetle scales, and mollusc nacre, have attracted extensive attention for a long time and they generally result from the interaction between light and periodic structures. However, non-iridescent structural colors, such as silvery structural colors, have received relatively little attention, and they usually result from non-periodic structures. Here, using optical microscopy, fiber-optic spectrometry, field emission scanning electron microscopy (FE-SEM), X-ray diffraction (XRD), Fourier-transform infrared spectroscopy (FTIR), and laser Raman spectroscopy, we investigate the origin of a novel structural color occurring at the edge of a bivalve shell (i.e., an otter shell). We find that: (1) the structural colors are observed to be uniform metallic silvery when viewed with the naked eye; (2) they are surprisingly multicolored with various colorful pixels juxtaposed together when viewed with an optical microscope; (3) each individual pixel shows a single color originating from a periodic, multilayered organic film with definite spacing (d); and (4) different pixels vary significantly in size, shape, and color with different d values (202–387 nm). Finally, we confirm that the macroscopic silvery color results from the pointillistic mixing of nano-to microscale iridescent pixels. We also discuss the special photonic structure responsible for the silvery color. We hope that this work can not only accelerate our comprehension of photonic materials, but also provide new inspiration for the synthesis of silvery white materials.
1. Introduction
Color is a visual effect that is produced when light reflected from objects stimulates our eyes and brain.1–5 It can be simply divided into chemical and structural colors,3,6 which are mainly related to the material's chemical composition or structure, respectively.3,6 To date, structural color is extremely attractive in a variety of fields such as materials science, since it does not require toxic dyes to prevent it from fading, and it can find a wide range of applications such as in displays, decorations, cosmetics, and textile dyeing.7–9The structures that can produce colors usually exhibit nanoscale variations in their refractive index in 1-, 2-, or 3-dimension (D), and are, therefore, called 1D, 2D, or 3D photonic structures (reflectors), respectively.10 Among these, 1D photonic structures, also called multilayer reflectors, are widespread both in the artificial and natural world and have been heavily studied.11 Essentially, multilayer reflectors are made of alternating films of high and low refractive index materials, and can usually be divided into two types: periodic and amorphous.1,11 The former reflect light with specific wavelengths, which results in defined structural colors and so are called narrow-band reflectors, while the latter reflect most or all wavelengths of light, which results in silvery (or golden) structural colors and so are called broadband reflectors.12 So far, four types of broadband reflectors have been found in nature (Fig. 1):1,13–17 (a) chirped, where the film thickness (t) changes systematically; (b) chaotic, where t and the center-to-center distance of two adjacent films (d) change randomly; (c) triple composite, where three narrow-band reflectors are superimposed together, each tuned to a different wavelength or color; and (d) curved, where both t and d are constant but the film direction (N) changes globally.
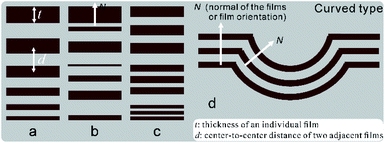 | ||
| Fig. 1 A schematic diagram of types of natural broadband reflectors (adapted from ref. 12, 13, 15 and 16): (a) chirped, (b) chaotic, (c) triple composite, and (d) curved. t: film thickness; d: center-to-center distance of two adjacent films. | ||
The latter two types of reflectors have the following characteristics: (a) locally, films are orderly arranged with uniform t and d, which act as small narrow-band reflectors (named “photonic crystallites” in this work) and result in specific pure colors (named “color units” or “pixels” in this work); (b) globally, t, d and N may vary in different crystallites; (c) these composite or curved reflectors often lead to an unusual mixing of colors (i.e. pointillistic mixing).
To date, silvery structural colors have been found in numerous species of organisms such as butterflies, fish, and spiders.17–19 They invariably originate from the four broadband reflectors as described above and are depicted in Fig. 1. Moreover, little has been reported for mollusc shells.
Here, we aim to investigate (1) the silvery structural colors occurring in the shell layers of bivalve animals named Lutraria lutraria (Fig. 2b); (2) the corresponding nanostructure and composition of the shell layers responsible for the silvery color. We first report that this color is caused by pointillistic mixing of iridescent pixels, resulting from a novel composite broadband reflector. We hope that this natural broadband reflector offers a potential strategy in the future for the design of ideal reflectance-based materials, such as the back reflector used in the field of solar cells.20,21
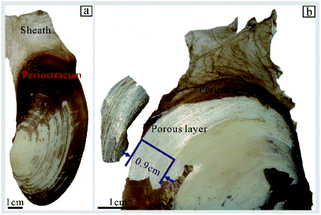 | ||
| Fig. 2 Photographs of Lutraria lutraria: (a) a general view of the shell in the wet state, and (b) the brilliant silvery white color at the surface of the shell. | ||
2. Materials and characterization
The Lutraria lutraria was obtained alive from the seafood market of Nanning in Guangxi Province, southern China. The samples were processed as follow: (1) the soft tissues were gently removed from the shell by a scalpel; (2) the remaining shells were washed by deionized water, then air-dried for one day at room temperature; (3) the shells were dried by baking in an oven at 43 °C for one day; (4) the periostracum was gently removed with tweezers to expose the porous layer (Fig. 1b) with a silver color at the edge of the shell; (5) the powder of the porous layer was prepared for X-ray diffraction (XRD) and Fourier transform infrared (FTIR) spectroscopy analysis by scraping the porous layer with a scalpel after which the scraped loose materials ground by a mortar and pestle.We took the optical micrographs of different magnifying scales of the spherulitic layer using a Sony camera, an optical microscope (Optec MIT300) with a digital camera (Tucsen, USB2.0, GT5.0), and a halogen lamp light source. The reflectance spectra of the porous layer were collected using a fiber-optic spectrometer (AvaSpec-2048, Avantes) with its probe perpendicular to the spherulitic layer surface. In addition, the reflectance spectra were collected from the porous layer using an optical microscope (Optec MIT300) with a fiber optic spectrometer (AvaSpec-2048, Avantes). Both measurements used a Teflon white reference tile (WS-2, Avantes) for reflectance calibration.
The XRD pattern was collected by a diffractometer (Rigaku D/max-2500) using Cu Kα radiation (λ = 0.15406 nm) at 40 kV (200 mA), and the qualitative analysis was performed using the program MDI Jade 6.0. The powder of the porous layer also was collected by a FTIR spectrometer (PE Frontier Spotlight 2000; resolution: 2 cm−1 over a scanning range of 500 to 2000 cm−1). Raman spectra of the surface of the porous layer were collected by a laser Raman spectrometer (Renishaw inVia Reflex; grating: 1200 I/mm), which was equipped with a Leica microscope (DM2700) and a 50× objective. The diode laser (785 nm) was used as the light source of the microscope when measuring. The microstructure of the shell was observed by scanning electron microscopy (SEM) (Hitachi, SU8020) at 10 kV.
3. Results
3.1. SEM analysis
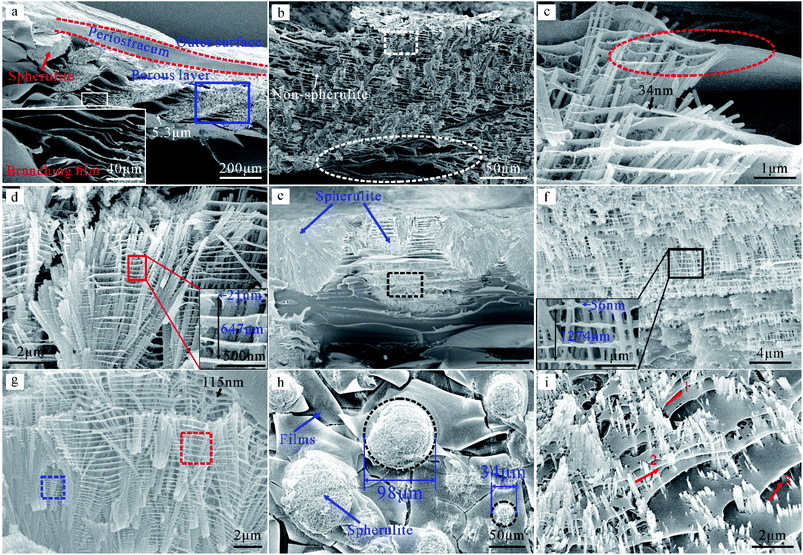
To elucidate the origin of this silvery color, we carried out structural analysis of the porous layer at two viewing angles.The shell of Lutraria lutraria consists of the periostracum, porous layer, and the crossed-lamellar layer.22 Fig. 3a and b shows that the porous layer consists of a non-spherulite, spherulite (hemispherical), and branching film. Fig. 3a–c also shows that t (5.3 μm) is gradually changed to a thin film (34 nm). Fig. 3c–e shows nano-thin films in the non-spherulite. Fig. 3e shows two different morphologies, one appears densely packed and the other is multi-layered. This is because the break face of the sample is across the centroid of the spherulite, so the dense profile of the spherulite is observed by accident. Fig. 3g shows the multi-thin film at the edge of the dense spherulite, as well as crystallites (marked by dotted red and blue boxes).
The top view of the non-spherulite is observed in Fig. S1a–c† and corresponds well to cross-sectional view. The top view of the spherulite is observed in Fig. 3h–i. The mixture of the fiber and film is termed as “spherulite”. The distribution of spherulite is island-like. Fig. 3i shows that the discrete fibers are approximately perpendicular to the thin films and d varies with position, such as the position marked with numbers, which is consistent with the cross-sectional observation. Please note that the detailed formation process of this structure has been reported in our previous study.22
3.2. Phase analysis
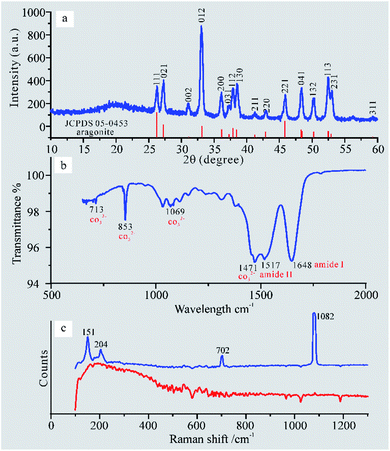
To evaluate the refractive index, we carried out compositional analysis of the porous layer by XRD, FTIR, and laser Raman spectroscopy.Fig. 4a exhibits sharp peaks that match well with JCPDS file no. 05-0453 (aragonite) which confirms that this layer contains crystalline aragonite. In addition, this pattern shows a broad peak at 2θ = 23°, which indicates a spherulitic layer with a high content of amorphous phase. Fig. 4b shows the characteristic peaks of CO32− at 713 cm−1, 853 cm−1, 1609 cm−1, and 1471 cm−1 and some characteristic peaks of proteinaceous organic materials at 1648 cm−1 (amide I) and 1517 cm−1 (amide II).23 In summary, both analyses prove that the porous layer constitutes only two phases of materials, namely aragonite and organic materials.
Aiming to distinguish the composition of the fiber and films, we carried out in situ analyses at the surface of the porous layer by laser Raman spectroscopy. Based on existing research results,24 the Raman peak at the blue line of Fig. 4c is caused by aragonite. Therefore, we confirm that the fiber and films consist of aragonite and organic materials, respectively.
3.3. Optical analysis
To explore the origin of the silvery color, we used bright field images to analysis the size, shape, and arrangement of pixels.Fig. 2 shows an optical photo of the surface of the Lutraria lutraria shell. The brown protective sheath is a typical characteristic of Lutraria lutraria,25 which directly connects with the periostracum. Under this layer, bright silvery and yellow-white colors are observed at edge and middle part of the shell, respectively. We term this silvery part as the “porous layer”.
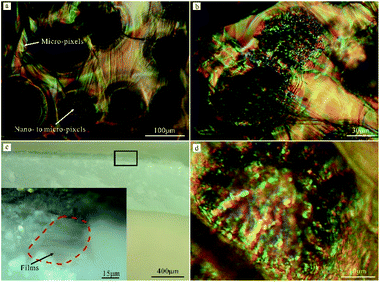
Interestingly, the porous layer is not silvery but shows a thin-film interference-like color at the micro-scale. The color of non-spherulite is shown in Fig. S1d and e.† Fig. S1d† indicates that ring-like micro-pixels exist around the single non-spherulite. The number of rings is about six and the total size is about 46 μm. Fig. S1e† shows that silk-like micro-pixels exist around the non-spherulites. The color of the spherulite is shown in Fig. 5a, b, and d. Fig. 5a shows that silk-like micro-pixels exist around the spherulite. Fig. 5b and d show that point-like nano-to micro-pixels (621 nm to 3.6 μm) are present at the surface of the spherulite. The various colorful pixels juxtapose together and then form a pixelated surface. Further, the cross-sectional color of the shell is studied to confirm that these colorful pixels belong to structural color. Fig. 5c shows that the film is brown when light is parallel to it. Therefore, these pixels are a typical structural color which is caused by a multilayer thin film. In addition, because the size of these pixels, such as red, green, and blue, is unidentifiable to the naked eye, the color mixing effect is adopted by Lutruria lutraria to form a bright silvery color at the shell edge.
3.4. Optical reflection properties
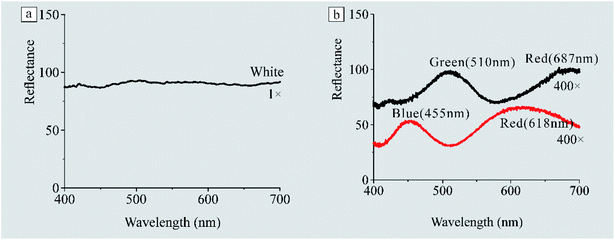
To confirm that the pixelated surface includes the essential red, green, and green pixels, we carried out spectral reflectance measurements.Two kinds of reflectance spectrums of the porous layer at different scales are shown in Fig. 6. The reflectance spectrum measured with a probe at a 1× scale (Fig. 6a) shows that there is no obvious reflection peak, namely white reflection, which is consistent with the naked eye observation. However, the reflectance spectrum measured with the optical microscope (the probe is replaced with an optic fiber, and then fiber is connected to the interfacing connection type C of the microscope) at a 400× scale shows an obvious reflection peak. The representative reflectance spectrums at a 400× scale are shown in Fig. 6b, which suggests that RGB colors with central wavelengths at 618, 510, and 455 nm had been detected. It is widely known that whiteness will be created when three kinds of colors, red, green, and blue, are mixed in appropriate proportions. Therefore, we can confirm that the silvery white color is the result of the mixing of nano-to micro-pointillistic pixels. Please note that the reflectance spectrum at a 400× scale is extremely varies with a change in the position and focal length of the microscope (the surface is uneven) (Fig. S2†). In addition, because the device used in this work does not support measurements by specifying points, we cannot precisely determine the probe point at the film or spherulite. However, there is no doubt that red, green, and blue had been detected at the 400× scale.
3.5. Theoretical calculations
Here, we try to predict the optical properties of the porous layer. We assume that the incident light is normal to the shell surface with the silvery color.It is well known that multi-thin film interference can be calculated using the following format:
2(nudu![[thin space (1/6-em)]](https://www.rsc.org/images/entities/char_2009.gif) cos cos![[thin space (1/6-em)]](https://www.rsc.org/images/entities/char_2009.gif) θu + nada θu + nada![[thin space (1/6-em)]](https://www.rsc.org/images/entities/char_2009.gif) cos cos![[thin space (1/6-em)]](https://www.rsc.org/images/entities/char_2009.gif) θa) = mλ θa) = mλ
| (1) |
The Fourier tool, developed by Prum and Torres,27 is particularly effective in predicting the reflectance spectra of quasi-ordered arrays in biology. The theoretical calculation process is as follows. (1) We turn the SEM image into a binary image using Image J and QIA-64 (Fig. 7a and b); (2) the refractive index of the thin film is estimated to be 1.4; (3) the predicted reflectance spectrum is calculated by the Fourier tool. The predicted reflectance spectrum is shown in Fig. 7c, which has three peaks at 460, 530, and 650 nm. The predicted fitting curve does not match well with the reflectance spectrums of the surface of the porous layer under normal incidence (Fig. 6b, black line). This result is not surprising owning to this branching multi-layered structure being irregular. In other words, only when the structure using the Fourier calculation is coincident with the experimental measurement, the fitting result will be identical with the measurement result. Due to the interval of the alternating film gradually changing, this fitting result can be used as an approximate simulation result.
 | ||
| Fig. 7 Fourier analysis of the multi-thin film. (a) An SEM image from Fig. 3g, and (b) a binary image. (c) Predicted reflectance spectrum and fitting curve (red line). | ||
In addition, we calculated the reflectance spectra of crystallite (Fig. S3†). The results indicate that the total reflectance spectra of the porous layer are the sum of spectra of different crystallites.
4. Discussion
The class Bivalvia contains about 10![[thin space (1/6-em)]](https://www.rsc.org/images/entities/char_2009.gif) 000 species.28 However, the iridescent color of the bivalve shell is uncommon. Studies on the iridescent color of the shell are relatively limited and focus on regular multilayers, such as of mother of pearl (nacre).29,30 To the best of our knowledge, there are few studies that report a silvery color of the bivalve shell.
000 species.28 However, the iridescent color of the bivalve shell is uncommon. Studies on the iridescent color of the shell are relatively limited and focus on regular multilayers, such as of mother of pearl (nacre).29,30 To the best of our knowledge, there are few studies that report a silvery color of the bivalve shell.
Interestingly, we found a distinctive silvery color at the shell edge of Lutraria lutraria. We found that the organic film act as a broadband reflector, which consists of different photonic crystallites. Accordingly, the various pixels juxtapose together, and then form a pixelated surface (the pixelated surface consists of many ordered or disordered color units, which are beyond the resolution of the naked eye21,31,32). Finally, this surface gives rise to a silvery color due to pointillistic mixing.
In contrast with the four types of broadband reflectors that have been discovered (as detailed in the Introduction, Fig. 1), the broadband reflector in this work has the following characteristics: (1) as compared with type (a), t changes horizontally rather than vertically; (2) as compared with type (b), t and d change gradually rather than randomly; (3) as compared with type (c), the number of crystallites are far more than three (there are only three crystallites in the single scale33); (4) as compared with type (d), t and d change gradually but N is constant. These characteristics indicate that the broadband reflector in this research is unusual. Accordingly, we hereby term this reflector as a “hybrid broadband reflector”.
For the whole structure in the porous layer, the aragonite fiber is rigid while the organic film is flexible. We believe that the whole structure formed a tensegrity system to self-balance. In addition, this structure may play a key role for buffering from the viewpoint of the Lutraria lutraria live in soft substrates such as sand.
5. Conclusions
The shell edge of Lutraria lutraria shows a bright silvery color, which is caused by the pointillistic mixing of iridescent pixels. The causes of these pixels were studied via examining the structure of the surface and a cross-section of the porous layer of the shell using SEM, XRD, FTIR, and laser Raman spectroscopy. Through Fourier analysis, we have demonstrated that the silvery color originates from the organic film, which acts as a broadband reflector. Moreover, we also confirm that this reflector consists of different photonic crystallites, which lead to different pixels with different colors. Finally, we hope that this organic–inorganic composite structure can provide new inspiration for the design and synthesis of photonic materials.Conflicts of interest
There are no conflicts to declare.Acknowledgements
We appreciate financial support from the National Natural Science Foundation of China (Grant no. 41762004).References
- J. Sun, B. Bhushan and J. Tong, RSC Adv., 2013, 3, 14862 RSC.
- Z. Xuan, J. Li, Q. Liu, F. Yi, S. Wang and W. Lu, Innovation, 2021, 2, 100081 Search PubMed.
- S. K. Shevell, The Science of Color[M], Elsevier, 2003 Search PubMed.
- S. Kinoshita, S. Yoshioka and J. Miyazaki, Rep. Prog. Phys., 2008, 71, 076401 CrossRef.
- S. D. Rezaei, Z. Dong, J. Y. E. Chan, J. Trisno, R. J. H. Ng, Q. Ruan, C. Qiu, N. A. Mortensen and J. K. W. Yang, ACS Photonics, 2020, 8, 18 CrossRef.
- B. Lgic, D. F. Lippens, M. Xiao, A. Chan, D. Hanley, P. R. L. Brennan, T. Grim, G. I. N. Waterhouse, M. E. Hauber and M. D. Shawkey, J. R. Soc., Interface, 2015, 12, 20141210 CrossRef PubMed.
- R. K. Nagi, D. E. Montanari and M. H. Bartl, Bioinspiration Biomimetics, 2018, 13, 035003 CrossRef PubMed.
- Y. Fu, C. A. Tippets, E. U. Donev and R. Lopez, Wiley Interdiscip. Rev.: Nanomed. Nanobiotechnol., 2016, 8, 758 Search PubMed.
- Y. Fang, X. Liu, H. Zheng and H. Liu, J. Cleaner Prod., 2021, 295, 126523 CrossRef CAS.
- B. A. Palmer, V. J. Yallapragada, N. Schiffmann, E. Me. Wormser, N. Elad, E. D. Aflalo, A. Sagi, S. Weiner, L. Addadi and D. Oron, Nat. Nanotechnol., 2020, 15, 138 CrossRef CAS PubMed.
- D. Gur, B. A. Palmer, S. Weiner and L. Addadi, Adv. Funct. Mater., 2017, 27, 1603514 CrossRef.
- A. E. Seago, P. Brady, J. Vigneron and T. D. Schultz, J. R. Soc., Interface, 2009, 6, S165 CrossRef PubMed.
- A. R. Parker, J. Opt. A: Pure Appl. Opt., 2000, 2, R15 CrossRef.
- H. Zhou, J. Xu, X. H. Liu, H. W. Zhang, D. T. Wang, Z. H. Chen, D. Zhang and T. X. Fan, Adv. Funct. Mater., 2017, 28, 1705309 CrossRef.
- J. P. Vigneron, M. Ouedraogo, J. Colomer and Ma. Rassart, Phys. Rev. E: Stat., Nonlinear, Soft Matter Phys., 2009, 79, 021907 CrossRef PubMed.
- S. Yoshioka and S. Kinoshita, Optical effects of highly curved multilayer structure found in the scale of structurally colored moth, International Society for Optics and Photonics, 2009, 7401 Search PubMed.
- P. Vukusic, R. Kelly and I. Hooper, J. R. Soc., Interface, 2009, 6, S193 Search PubMed.
- D. Gur, B. Leshem, D. Oron, S. Weiner and L. Addadi, J. Am. Chem. Soc., 2014, 136, 17236 CrossRef CAS PubMed.
- S. Kariko, J. V. I. Timonen, J. C. Weaver, D. Gur, C. Marks, L. Leiserowitz, M. Kolle and L. Li, J. R. Soc., Interface, 2018, 15, 20170930 CrossRef PubMed.
- A. Soman and A. Antony, Sol. Energy, 2018, 162, 525 CrossRef CAS.
- X. Liu, D. Wang, Z. Yang, H. Zhou, Q. Zhao and T. Fan, Adv. Opt. Mater., 2019, 7, 1900687 CrossRef.
- G. S. Zhang, CrystEngComm, 2013, 15, 10183 RSC.
- G. S. Zhang and Z. Q. Huang, Biochemistry, 2011, 76, 1227 Search PubMed.
- I. M. Weiss, N. Tuross, L. Addadi and S. Wwiner, J. Exp. Zool., 2002, 293, 478 CrossRef CAS PubMed.
- S. Hunt, Comp. Biochem. Physiol., Part B: Biochem. Mol. Biol., 1973, 45, 311 CrossRef CAS.
- M. R. Snow, A. Pring, P. Self, D. Losic and J. Shapter, Am. Mineral., 2004, 89, 1353 CrossRef CAS.
- R. O. Prum and R. H. Torres, Integr. Comp. Biol., 2003, 43, 591 CrossRef PubMed.
- E. Gosling, Marine Bivalve Molluscs, John Wiley & Sons, 2015 Search PubMed.
- A. H. Pfund, J. Franklin Inst., 1917, 183, 453 CrossRef CAS.
- T. L. Tan, D. Wong and P. Lee, Opt. Express, 2004, 12, 4847 CrossRef CAS PubMed.
- Y. Y. Diao and X. Y. Liu, Opt. Express, 2011, 19, 9232 CrossRef PubMed.
- S. N. Gorb and E. V. Gorb, Functional Surfaces in Biology III, Springer, 2018, ch. 3, p. 78 Search PubMed.
- E. J. Denton and J. A. C. Nicol, J. Mar. Biol. Assoc. U. K., 1965, 45, 711 CrossRef.
Footnote |
| † Electronic supplementary information (ESI) available. See DOI: 10.1039/d1ra08573e |
| This journal is © The Royal Society of Chemistry 2022 |

