
 Open Access Article
 This Open Access Article is licensed under a Creative Commons Attribution-Non Commercial 3.0 Unported Licence
Li4SiO4 Doped-Li7P2S8I solid electrolytes with high lithium stability synthesised using liquid-phase shaking†
Kazuhiro Hikima a,
Ho Jia Lera,
Radian Febi Indrawana,
Hiroyuki Mutoab and
Atsunori Matsuda*a
a,
Ho Jia Lera,
Radian Febi Indrawana,
Hiroyuki Mutoab and
Atsunori Matsuda*a
aDepartment of Electrical and Electronic Information Engineering, Toyohashi University of Technology, 1-1 Hibarigaoka, Tempaku, Toyohashi, Aichi 441-8580, Japan. E-mail: matsuda@ee.tut.ac.jp
bInstitute of Liberal Arts and Sciences, Toyohashi University of Technology, 1-1 Hibarigaoka, Tempaku, Toyohashi, Aichi 441-8580, Japan
First published on 7th March 2022
Abstract
In this study, mechanical milling and liquid-phase shaking are used to synthesise 3Li2S·P2S5 LiI·xLi4SiO4 (Li7P2S8I·xLi4SiO4) solid electrolytes. When mechanical milling is used, the electrolyte samples doped with 10 mol% of Li4SiO4 (Li7P2S8I·10Li4SiO4) have the highest ionic conductivity at ∼25–130 °C. When liquid-phase shaking is used, they exhibit a relatively high conductivity of 0.85 mS cm−1 at ∼20 °C, and low activation energy for conduction of 17 kJ mol−1. A cyclic voltammogram shows that there are no redox peaks between −0.3 and +10 V, other than the main peaks near 0 V (v.s. Li/Li+), indicating a wide electrochemical window. The galvanostatic cycling test results demonstrate that the Li7P2S8I·10Li4SiO4 has excellent long-term cycling stability in excess of 680 cycles (1370 h), indicating that it is highly compatible with Li. Thus, Li7P2S8I solid electrolytes doped with Li4SiO4 are synthesised using the liquid-phase shaking method for the first time and achieve a high ionic conductivity of 0.85 mS cm−1 at 25 °C. This work demonstrates the effects of Li4SiO4 doping, which can be used to improve the ionic conductivity and stability against Li anodes with Li7P2S8I solid electrolytes.
Introduction
All-solid-state lithium-ion batteries contain electrolytes consisting of solid Li+-conducting materials, utilising the discovery of ionic conductors in solid-state ionics. These batteries are of great interest due to their gravimetric and volumetric energy densities, as well as their operational temperature range, safety, low flammability, and resistance to short circuits, in comparison to conventional organic liquid-electrolyte batteries. They represent a new avenue of exploration for electrochemical energy storage, and have great potential for large-scale power generation and storage systems.In general, Li+-conducting solid electrolytes can be divided into two categories: oxide-type and sulphide-type.1 Oxide-type solid electrolytes include framework host structures such as perovskites, sodium (Na) super ionic conductors (NASICONs), and garnets, which have been widely reported. They typically have better chemical and electrochemical stability, higher electrochemical oxidation voltages, and greater air stability than sulphide-type solid electrolytes. However, their ionic conductivities typically plateau at 10−3 to 10−4 S cm−1, one order of magnitude lower than that of organic liquid electrolytes, because they exhibit high grain-boundary resistance. Another disadvantage is their stiffness, which causes poor interfacial contact and necessitates high-temperature sintering to improve the contacts between the electrodes and electrolytes.
In contrast, sulphide-type solid electrolytes such as Li3PS4,2 Li6PS5Cl,3 Li7P3S11,4,5 and Li10GeP2S126 reportedly have superior Li+ conductivity at room temperature. They also have soft crystal lattices, which means they are easy to deform and electrolyte particles can be connected by pressing them together to facilitate ion transport across grain boundaries. However, their application in all-solid-state batteries is limited by their chemical and electrochemical instability, H2S gas emissions, narrow electrochemical windows, and low compatibility with positive/negative electrodes.
Li2S·P2S5·LiI based materials, which have high ionic conductivity and Li stability, are commonly used as solid electrolytes in all-solid-state batteries.7 Li7P2S8I solid electrolytes have been synthesised using mechanical milling methods, and can achieve a high ionic conductivity of 6.5 mS cm−1 (ref. 8) at room temperature (R.T.). Liquid-phase synthesis has also been used, but the ionic conductivity was less than 1.0 mS cm−1 at R.T., which is considerably lower than that obtained using mechanical milling,7–11 although liquid-phase synthesis enables large-scale production of solid electrolytes at low cost. To improve the ionic conductivity, some studies have tried doping Li7P2S8I with other materials. In particular, Li7P2S8I·Li3PO4 solid electrolytes have shown relatively high ionic conductivity and lithium stability.12
In this study, 3Li2S·P2S5·LiI·xLi4SiO4 (Li7P2S8I·xLi4SiO4) solid electrolytes will be synthesised using mechanical milling and liquid-phase shaking methods. The electrochemical properties of the electrolytes will be investigated using cyclic voltammetry (CV) and galvanostatic cycling test. To the authors' knowledge, this has not been reported previously, and the results will contribute to the development of all-solid-state lithium-ion batteries with improved performance.
Experimental details
Solid electrolyte synthesis
The starting materials Li2S (99.9%, Mitsuwa), P2S5 (99%, Merck), and LiI (99.99%, Aldrich) were weighed out with a molar ratio of 3![[thin space (1/6-em)]](https://www.rsc.org/images/entities/char_2009.gif) :1:1 (Li2S = 0.3827 g, P2S5 = 0.6172 g, and LiI = 0.3717 g). The amount of Li4SiO4 (99.9%, Toshima, x = 10 mol%, 0.0665 g) used for doping was based on the molar weight of Li3PS4 (3Li2S·1P2S5).
:1:1 (Li2S = 0.3827 g, P2S5 = 0.6172 g, and LiI = 0.3717 g). The amount of Li4SiO4 (99.9%, Toshima, x = 10 mol%, 0.0665 g) used for doping was based on the molar weight of Li3PS4 (3Li2S·1P2S5).
For the mechanical milling method, the mixture was manually ground for 15 min, then placed in a 45 mL zirconia (ZrO2) milling pot with ten 4 mm-diameter zirconia balls, which were used to enhance the kinetics of the reactions between the starting materials. These steps were conducted in an Ar-filled glove box so that the starting materials were not exposed to humidity in the air. Next, the prepared powder was mixed using a planetary ball mill (PULVERISETTE 7; FRITSCH) at 400 rpm for 20 h, which produced the desired solid electrolyte powder. No pre-annealing or post-heat treatments were applied during the preparation.
For the liquid-phase shaking method, the four starting materials were mixed together in a 45 mL centrifuge tube (polypropylene, Labcon) along with 10 mL of EP (ethyl propionate, Aldrich) solvent and approximately 33 g of zirconia balls (ZrO2 balls, 4 mm). The mixture was then shaken for 3 h at 1500 rpm under a 30 °C in an Ar atmosphere. After shaking, another 6 mL of EP solvent was added to the suspension, which was then dried under low pressure, starting at room temperature, then heated to 70 °C for 1 h, followed by 110 °C for 2 h. The pressure was controlled using a rotary vacuum pump (GHD-031A, ULVAC, Inc). Samples of the resulting electrolyte powder were then heat treated at temperatures of 130–200 °C for 2 h using a tubular furnace (FT-01VAC-30, FULL-TECH). All the processes after the shaking were conducted in a dry Ar-filled glove box.
Characterisation
Crystal structures were assigned to the samples by X-ray diffraction (XRD; Ultima IV, Rigaku). The samples were sealed in specialised holders equipped with a Be window (Rigaku) in an Ar-filled glove box to prevent exposure to humidity. Thermogravimetric differential thermal analysis (TG-DTA; EVO II, Rigaku) was used to evaluate the thermal properties of the solid electrolytes in an Ar-filled glove box. Approximately 8 mg samples of the powders were put in Al pans in an Ar-filled glove box, then heated by 5 °C min−1 to 450 °C with Ar gas flow. The morphologies of the samples were examined using a scanning electron microscope (SEM; Hitachi High-Tech, S-4800). A very small amount of each sample was applied and gently distributed on an SEM holder. The SEM images were taken at 5 kV with magnifications of 2.5–25 k (20–2 μm) and they were used to evaluate the microstructures of the samples at different scales.Electrochemical properties
The temperature dependence of the ionic conductivities of the samples were measured using alternating-current (AC) electrochemical impedance spectroscopy (EIS; SI 1260 Solartron) between 1 MHz and 10 Hz, under an Ar flow atmosphere. A sample weighing approximately 120 mg was uniaxially pressed at 254 MPa at room temperature (approximately 25 °C) to form a pellet 10 mm in diameter. The prepared pellets were placed in a holder made from polyether ether ketone (PEEK) with two blocking electrodes made from stainless steel (SUS). The temperature was increased from room temperature (approximately 25 °C) to 130 °C in 20 °C intervals, the temperature was held at each interval for 1 h before taking the impedance measurement.CV was conducted using a potentiostat (SI-1287, Solartron). A sample weighing approximately 120 mg was formed into a pellet and uniaxially cold-pressed at 254 MPa at room temperature (approximately 25 °C). Next, a Li-metal sheet 8 mm in diameter and 0.1 mm thick was attached to one side of the prepared pellet, which had a diameter of 10 mm. This was sandwiched between two SUS electrodes. The SUS served as the reference and counter electrodes. The prepared cell (SUS/Li/solid electrolyte/SUS) was measured at a scan rate of 5 mV s−1 with a voltage range of −0.3 to +10 V for three cycles.
The galvanostatic cycling test was conducted using Li-metal sheets as the non-blocking electrodes on both sides of the pelletised sample, then sandwiching this between SUS electrodes. The pellet had a diameter of 10 mm and was prepared by uniaxially cold-pressing a 120 mg sample at 254 MPa. The prepared cell (SUS/Li/solid electrolyte/Li/SUS) was electrochemically cycled using a charge–discharge device (BTS-2004H, Nagano) under a dry Ar atmosphere at 30 °C. The current density was fixed at 0.1 mA cm−2 and each cycle consisted of 1 h for charging and 1 h for discharging.
Results and discussion
Determination of the doping level
Fig. 1(a) shows the XRD patterns for the ball-milled Li7P2S8I samples doped with 5–30 mol% of Li4SiO4. Halo patterns were observed for all the samples, which indicates that the Li7P2S8I·Li4SiO4 solid electrolytes synthesised using the ball-milling process were amorphous.13,14 To an extent, two broad peaks were observed at approximately 20° and 29°. However, the x = 30 sample showed sharp peaks that were attributed to one of the starting materials, Li2S. The presence of residual Li2S crystals in the x = 30 sample indicates that the sample became Li-rich when it was doped with 30 mol% of Li4SiO4.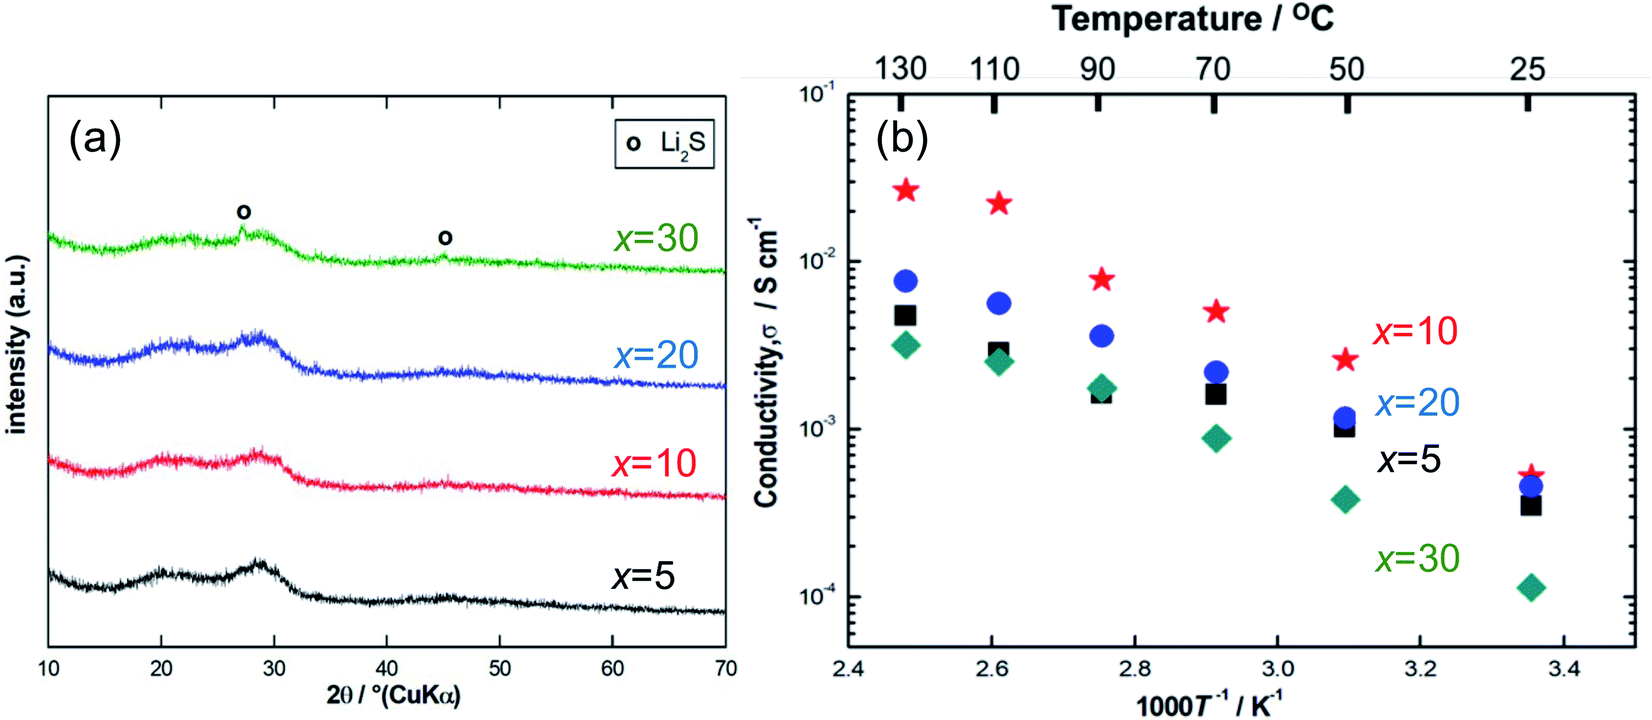 | ||
| Fig. 1 (a) X-ray diffraction patterns, (b) the temperature dependence of ionic conductivity of the ball-milled samples at a Li4SiO4-doping composition range of 5 mol% to 30 mol%. | ||
Fig. 1(b) shows the temperature dependence of the ionic conductivity of the Li7P2S8I·xLi4SiO4 solid electrolytes (x = 5, 10, 20, and 30). The x = 10 sample had the highest ionic conductivity between room temperature (approximately 25 °C) and 130 °C. At room temperature (approximately 25 °C) the conductivity of the x = 20 sample was only slightly lower than that of the x = 10 sample, however, at high temperatures the ionic conductivity of the x = 20 sample was much weaker, not exceeding 10−2 S cm−1, and it was similar to the x = 30 sample. Table 1 summarises the ionic conductivity of all the samples (x = 5, 10, 20, and 30) at 25 °C. Notably, the ionic conductivity of the x = 10 sample increased from 0.52 to 1.4 mS cm−1 at 25 °C a substantial increase of one order of magnitude, after the temperature-dependence EIS measurement. In contrast, the x = 20 and 30 samples had similar results before and after the EIS measurement, showing no enhancement in their conductivities. This is compatible with the XRD pattern for the x = 10 sample after the EIS measurement, which indicates the presence of highly conductive thio-LISICON II analogue phase11,15–17 as shown in Fig. S2.† The x = 10 samples exhibited the highest ionic conductivity, so this doping level was explored further using the liquid-phase shaking method. The TG-DTA curves for the x = 10 sample are shown in Fig. S1(a).† The TG curve (blue) showed roughly weight loss of approximately 1% at 300 °C. The DTA curve (red) contained just one exothermic peak at approximately 180 °C, which was caused by the crystallization of Li7P2S8I. The DTA curve of the samples after heat treatment at 150 °C contained no peaks (Fig. S1b)†.
| Li7P2S8I·xLi4SiO4 | Ionic conductivity at 25 °C before EIS (mS cm−1) | Ionic conductivity at 25 °C after EIS (mS cm−1) |
|---|---|---|
| x = 5 | 0.35 | — |
| x = 10 | 0.52 | 1.4 |
| x = 20 | 0.46 | 0.46 |
| x = 30 | 0.11 | 0.18 |
Liquid phase shaking synthesis
Fig. 2(a) shows the XRD patterns for Li7P2S8I·xLi4SiO4 (x = 0 and 10) solid electrolytes synthesised using the liquid-phase shaking method. It should be noted that no starting material residues, including LiI, were observed in either sample. One peak at 15° was observed in both XRD patterns, this was attributed to the Li4PS4I phase, which is poorly conductive of Li+ (0.1 mS cm−1 at approximately 25 °C).15 More peaks attributed to the Li4PS4I phase were located between 20° and 40° (2θ = 21°, 27.9°, 29.3°, 29.9°, and 33.4°). In addition, diffraction peaks at 2θ = 20°, 25°, and 30° in both samples were attributed to the highly conductive thio-LISICON analogue phase.11,16,17 Next, the effect of Li4SiO4-doping on Li7P2S8I was considered. The peaks attributed to Li4SiO4 were not identified and no peak shifts were observed in Li7P2S8I·10Li4SiO4. This indicates that Si and O were not incorporated into the Li7P2S8I crystal lattice, and that no solid solution was formed. These XRD patterns have a certain degree of similarity with Li7P2S8I results reported previously.11,16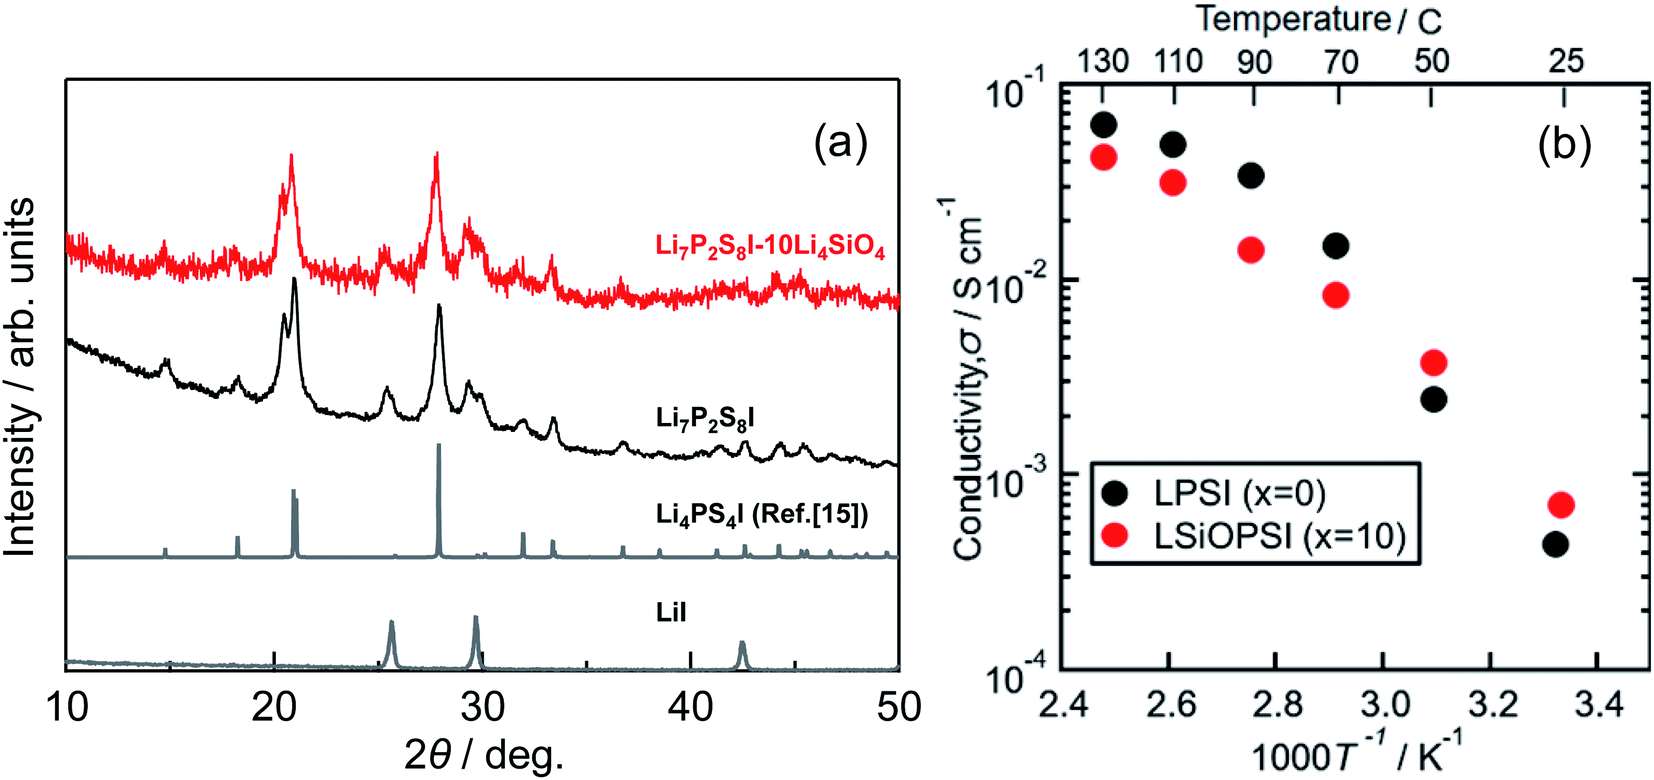 | ||
| Fig. 2 (a) X-ray diffraction patterns, (b) the temperature dependence of the ionic conductivity of the Li7P2S8I·xLi4SiO4 (x = 0 (LPSI), x = 10 (LSiOPSI)) solid electrolytes synthesized by liquid phase shaking method with the heat treatment at 150 °C. | ||
Fig. S3† shows the SEM images for the Li7P2S8I·xLi4SiO4 (x = 0 and 10) solid electrolytes. The primary particle sizes in Li7P2S8I and Li7P2S8I·10Li4SiO4 were approximately 5 μm and 2–3 μm, respectively. Although the SEM observations showed no significant differences between the samples, Li4SiO4-doping slightly reduced the particle size. Fig. 2(b) shows the ionic conductivity of the Li7P2S8I·xLi4SiO4 (x = 0 and 10) solid electrolytes synthesised using the liquid-phase shaking method. The room-temperature conductivity of Li7P2S8I·10Li4SiO4 was twice that of the undoped sample, increasing from 0.35 to 0.85 mS cm−1. In addition, the activation energy was calculated for the temperature range of 25 °C to 70 °C for Li7P2S8I and Li7P2S8I·10Li4SiO4 respectively, because the temperature dependence of the ionic conductivity of Li7P2S8I was inconsistent with a linear fitting above 90 °C, although this reason is unclear. As a result, the activation energy reduced from 28 to 17 kJ mol−1. As Li4SiO4 itself contains lithium ions (4 Li+), the addition of Li4SiO4 increased the concentration of Li+ in the Li7P2S8I host material, indicating that an increase in mobile Li+ improved the ionic conductivity. This finding is supported by previous studies.18,19 In addition, Li4SiO4 doping also causes changes in the activation energy. Several earlier studies revealed that Si can reduce energy barriers and Li-site energy for ionic conduction at LGPS-type structures.19,20 Therefore, it is reasonable to conclude that Li4SiO4 is a promising doping candidate for the development of Li+ solid-state conductors with high ionic conductivity at room temperature and a low activation energy.
Effects of Li4SiO4 doping
Fig. 3 shows the CV results for the Li7P2S8I·xLi4SiO4 (x = 0 and 10) solid electrolytes synthesised using the liquid-phase shaking method. In both samples, sharp cathodic and anodic peaks were observed at approximately 0.6 V, indicating the occurrence of Li deposition (Li+ + e− → Li) and dissolution (Li → Li+ + e−). The symmetry of the oxidation–reduction peaks in the CV plots confirmed the good reversibility of Li deposition and dissolution. Moreover, no other large redox peaks were detected between −0.3 and +10 V, demonstrating that Li7P2S8I·xLi4SiO4 (x = 0 and 10) did not decompose in the potential region. In summary, the Li4SiO4-doping did not compromise the wide electrochemical windows properties of the solid electrolytes.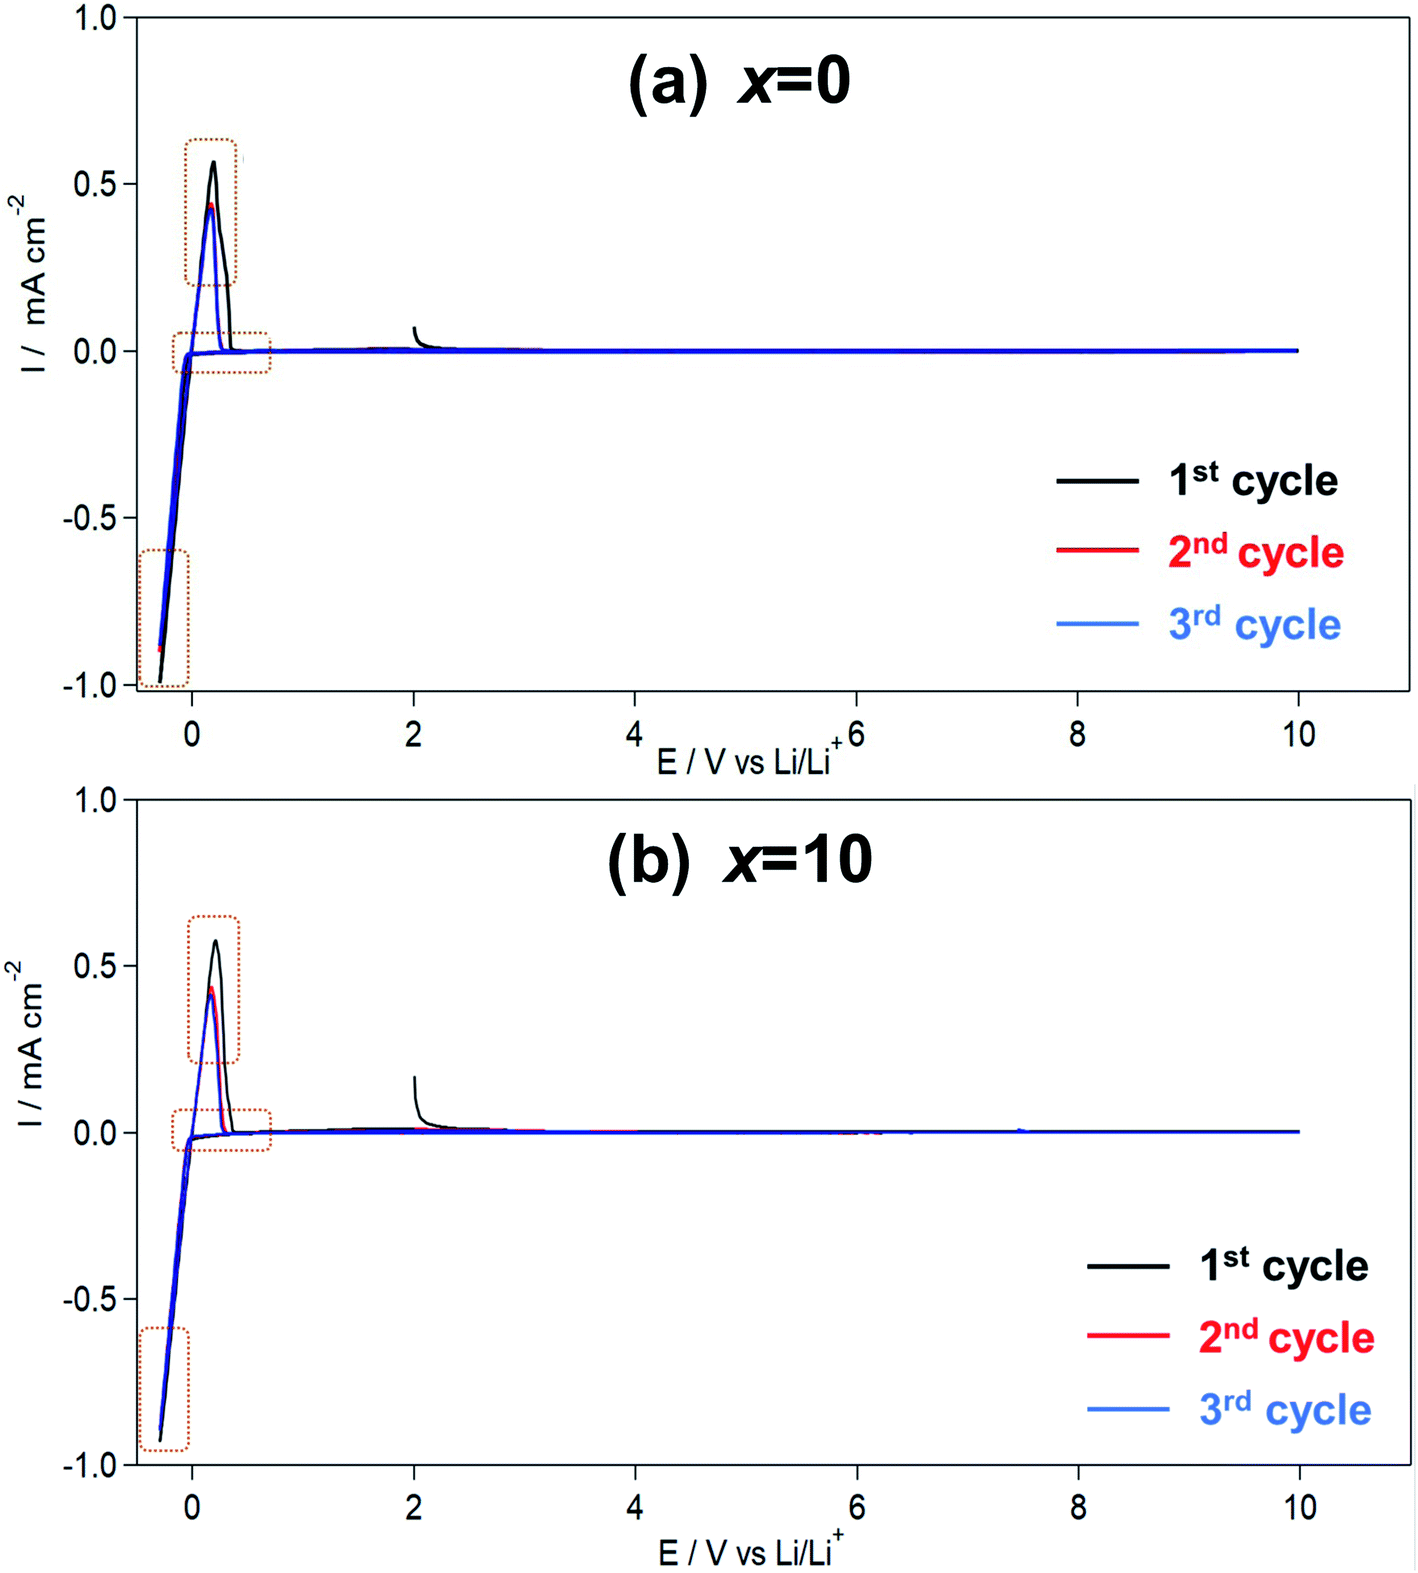 | ||
| Fig. 3 (a) Cyclic voltammogram of the Li7P2S8I·xLi4SiO4 ((a) x = 0, (b) x = 10) solid electrolytes synthesized by liquid phase shaking method with the heat treatment at 150 °C. | ||
Fig. 4 shows the galvanostatic cycling test results for the Li7P2S8I·xLi4SiO4 (x = 0 and 10) solid electrolytes up to 685 cycles (1370 h). A constant current density of 0.1 mA cm−2 was applied at room temperature (approximately 25 °C) for 2 h per charge/discharge cycle. The initial voltages of the undoped Li7P2S8I (x = 0) and Li7P2S8I·10Li4SiO4 solid electrolytes were 23 and 18 mV, respectively. After 50 cycles (100 h), the undoped sample started to reveal signs of voltage increases, and it reached 30 mV by the 130th cycle (160 h), an increase of 23%. In contrast, the doped sample only increased to 20 mV over the same number of cycles. The voltage response of the undoped sample eventually reached 45 mV by the 250th cycle (500 h), almost double its starting voltage. Over the same number of cycles, the polarization of the doped sample remained stable at 20 mV. After running for more than 250 cycles, the voltage of the undoped solid electrolyte increased by 96%, from 23 to 45 mV, whereas the voltage of the doped solid electrolyte was remarkably consistent increasing from 18 to 20 mV, an increase of just 11%. Therefore, Li4SiO4-doping greatly improved the long-term cycling stability of the Li7P2S8I host material with a Li-metal electrode for more than 1300 h of cycling, demonstrating its suitability as a highly Li-compatible and low-resistance interphase. The oxide materials have high Li stability,1 so this result could reflect the introduction of an oxide ion into Li7P2S8I through the Li4SiO4 doping, which is similar to the Li3PO4 doped Li7P2S8I.
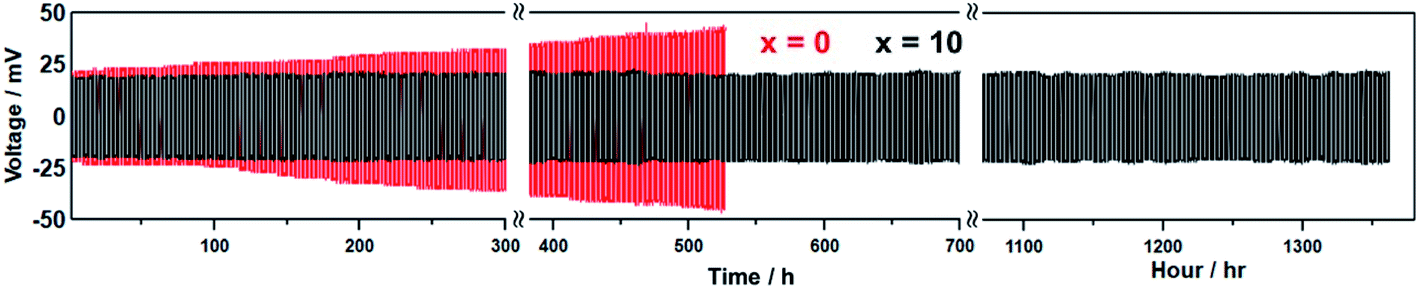 | ||
| Fig. 4 Galvanostatic cycling test results of the Li7P2S8I·xLi4SiO4 (x = 0, 10) solid electrolytes synthesized by liquid phase shaking method with the heat treatment at 150 °C using Li/solid electrolyte/Li cells. | ||
There are several previous reports about Li4SiO4 doped Li2S–SiS2 type glass solid electrolytes. The Li4SiO4 doped Li2S–SiS2 type glass solid electrolytes formed the Si2OS66−, which consists of one oxygen atom and six sulfur atoms.21 This Si2OS66− improved the ionic conductivity, because the oxygen atom is introduced as cross-linked oxygen atom with weak trapping of the lithium ion. Therefore, Li4SiO4 doped Li7P2S8I solid electrolytes could include the small amount of Si2OS66−, although there were no direct evidence. This point is different from our previous report of Li3PO4 doped-Li7P2S8I.
Conclusion
In this study, 3Li2S·P2S5·LiI·xLi4SiO4 (Li7P2S8I·xLi4SiO4) solid electrolytes were synthesised using the mechanical milling and liquid-phase shaking methods. With mechanical milling, 10 mol%-Li4SiO4 doping (Li7P2S8I·10Li4SiO4) produced the highest ionic conductivity between room temperature (approximately 25 °C) and 130 °C. Therefore, the composition was fixed as the Li7P2S8I·10Li4SiO4 for the liquid-phase shaking method. The CV measurement and the galvanostatic cycling test results showed that the electrochemical properties of the Li7P2S8I solid electrolyte were improved by doping with Li4SiO4. In particular, the doped electrolyte showed long-term cycling stability against Li-metal over more than 1300 h. This study proved that doping Li7P2S8I solid electrolytes with Li4SiO4 has good effects on Li stability.Author contributions
Conceptualisation, A. M.; methodology, K. H., H. J. L, R. F. I.; software, H. J. L., R. F. I.; validation, K. H., H. J. L., R. F. I.; formal analysis, H. J. L., R. F. I.; investigation, K. H., H. J. L., R. F. I.; resources, K. H., H. M., A. M.; data curation, K. H., H. J. L., R. F. I.; writing – original draft preparation, K. H., H. J. L.; writing – review and editing, K. H., H. J. L., and A. M.; visualisation, K. H., H. J. L.; supervision, K. H., H. M., A. M.; project administration, K. H., H. M., A. M.; funding acquisition, H. M., A. M.; all authors have read and agreed to the published version of the manuscript.Conflicts of interest
There are no conflicts to declare.Acknowledgements
This study was supported by the Advanced Low Carbon Technology Specially Promoted Research for Innovative Next Generation Batteries (JST-ALCA-SPRING, JPMJAL1301) program of the Japan Science and Technology Agency (JST). We would like to thank Ms. Reiko Matsuda and Ms. Masayo Takahashi for experimental assistance.References
- A. Manthiram, X. Yu and S. Wang, Nat. Rev. Mater., 2017, 2, 16103 CrossRef CAS.
- Z. Liu, W. Fu, E. A. Payzant, X. Yu, Z. Wu, N. J. Dudney, J. Kiggans, K. Hong, A. J. Rondinone and C. Liang, J. Am. Chem. Soc., 2013, 135, 975–978 CrossRef CAS PubMed.
- S. Boulineau, M. Courty, J.-M. Tarascon and V. Viallet, Solid State Ionics, 2012, 221, 1–5 CrossRef CAS.
- F. Mizuno, A. Hayashi, K. Tadanaga and M. Tatsumisago, Electrochem. Solid-State Lett., 2005, 8, A603 CrossRef CAS.
- H. Yamane, M. Shibata, Y. Shimane, T. Junke, Y. Seino, S. Adams, K. Minami, A. Hayashi and M. Tatsumisago, Solid State Ionics, 2007, 178, 1163–1167 CrossRef CAS.
- N. Kamaya, K. Homma, Y. Yamakawa, M. Hirayama, R. Kanno, M. Yonemura, T. Kamiyama, Y. Kato, S. Hama, K. Kawamoto and A. Mitsui, Nat. Mater., 2011, 10, 682 CrossRef CAS PubMed.
- E. Rangasamy, Z. Liu, M. Gobet, K. Pilar, G. Sahu, W. Zhou, H. Wu, S. Greenbaum and C. Liang, J. Am. Chem. Soc., 2015, 137, 1384–1387 CrossRef CAS PubMed.
- X. Feng, P.-H. Chien, S. Patel, J. Zheng, M. Immediato-Scuotto, Y. Xin, I. Hung, Z. Gan and Y.-Y. Hu, Energy Storage Mater., 2019, 22, 397–401 CrossRef.
- T. Yamamoto, N. H. H. Phuc, H. Muto and A. Matsuda, Electron. Mater. Lett., 2019, 15, 409–414 CrossRef CAS.
- S.-J. Choi, S.-H. Lee, Y.-C. Ha, J.-H. Yu, C.-H. Doh, Y. Lee, J.-W. Park, S.-M. Lee and H.-C. Shin, J. Electrochem. Soc., 2018, 165, A957–A962 CrossRef CAS.
- K. Hikima, T. Yamamoto, N. H. H. Phuc, R. Matsuda, H. Muto and A. Matsuda, Solid State Ionics, 2020, 354 CrossRef CAS.
- R. F. Indrawan, T. Yamamoto, H. H. P. Nguyen, H. Muto and A. Matsuda, Solid State Ionics, 2020, 345 CrossRef CAS.
- S. Ujiie, T. Inagaki, A. Hayashi and M. Tatsumisago, Solid State Ionics, 2014, 263, 57–61 CrossRef CAS.
- B. Fan, H. Fu, H. Li, B. Xue, X. Zhang, Z. Luo and H. Ma, J. Alloys Compd., 2018, 740, 61–67 CrossRef CAS.
- S. J. Sedlmaier, S. Indris, C. Dietrich, M. Yavuz, C. Dräger, F. von Seggern, H. Sommer and J. Janek, Chem. Mater., 2017, 29, 1830–1835 CrossRef CAS.
- S.-J. Choi, S.-H. Choi, A. D. Bui, Y.-J. Lee, S.-M. Lee, H.-C. Shin and Y.-C. Ha, ACS Appl. Mater. Interfaces, 2018, 10, 31404–31412 CrossRef CAS PubMed.
- M. Takahashi, T. Watanabe, K. Yamamoto, K. Ohara, A. Sakuda, T. Kimura, S. Yang, K. Nakanishi, T. Uchiyama, M. Kimura, A. Hayashi, M. Tatsumisago and Y. Uchimoto, Chem. Mater., 2021, 33, 4907–4914 CrossRef CAS.
- M. Tatsumisago, K. Yoneda, N. Machida and T. Hinami, J. Non-Cryst. Solids, 1987, 95–96, 857–864 CrossRef CAS.
- S. P. Ong, Y. Mo, W. D. Richards, L. Miara, H. S. Lee and G. Ceder, Energy Environ. Sci., 2013, 6, 148–156 RSC.
- A. Kuhn, O. Gerbig, C. Zhu, F. Falkenberg, J. Maier and B. V. Lotsch, Phys. Chem. Chem. Phys., 2014, 16, 14669–14674 RSC.
- T. Minami, A. Hayashi and M. Tatsumisago, Solid State Ionics, 2000, 136–137, 1015–1023 CrossRef CAS.
Footnote |
| † Electronic supplementary information (ESI) available. See DOI: 10.1039/d1ra09348g |
| This journal is © The Royal Society of Chemistry 2022 |