
 Open Access Article
 This Open Access Article is licensed under a Creative Commons Attribution-Non Commercial 3.0 Unported Licence
Optical properties and photoactivity of carbon nanodots synthesized from olive solid wastes at different carbonization temperatures†
Shadi Sawalha *a,
Mohyeddin Assalib,
Ameerah Nasasrah‡
a,
Maha Salman‡a,
Majd Nasasrah‡a,
Madleen Jitan‡a,
Hikmat S. Hilalc and
Ahed Zyuodc
*a,
Mohyeddin Assalib,
Ameerah Nasasrah‡
a,
Maha Salman‡a,
Majd Nasasrah‡a,
Madleen Jitan‡a,
Hikmat S. Hilalc and
Ahed Zyuodc
aDepartment of Chemical Engineering, An-Najah National University, Nablus, Palestine. E-mail: sh.sawalha@najah.edu
bDepartment of Pharmacy, Faculty of Medicine and Health Sciences, An Najah National University, Nablus, Palestine
cDepartment of Chemistry, Faculty of Science, An-Najah National University, Nablus, Palestine
First published on 3rd February 2022
Abstract
Carbon nanodots (CNDs) have many fascinating properties, such as optical properties (UV-Visible absorption and fluorescence emission), which make them good candidates in many applications, such as photocatalysts for the degradation of several organic pollutants. This study aims to synthesize CNDs from olive solid wastes at different carbonization temperatures from 300 to 900 °C and study the effect on the optical properties of the CNDs, such UV-Vis, fluorescence, quantum yield, and energy bandgap, in addition to the influence on the photoactivity of the CNDs as photocatalysts for the degradation of methylene blue (MB). CNDs were prepared from olive solid wastes (OSWs) by pyrolysis at different temperatures (300–900 °C) for conversion to carbonized material, and then oxidized chemically in the presence of hydrogen peroxide (H2O2). It was found that an increase in the carbonization temperature of the OSWs leads to an increase in the product yield with a maximum value at 500 °C, and it then decreased dramatically. On the other hand, a decrease in fluorescence due to the diminishment of oxygen groups and the destruction of the surface of the CNDs was observed. The higher quantum yield (5.17%) and bandgap (2.77 eV) were achieved for CNDs prepared from OSWs that carbonized at 300 °C. The rate and degradation efficiency of MB were studied with the different synthesized CNDs, and it was found that an increase in the carbonization temperature leads to a decrease in the rate and degradation efficiency of MB, with the highest degradation rate of 0.0575 min−1 and degradation efficiency of 100% after 120 minutes of light irradiation being realized for the sample carbonized at 300 °C.
Introduction
In 2004, carbon nano-dots (CNDs) were discovered accidentally during the purification of single-walled carbon nanotubes.1,2 These new carbon materials are quasi-spherical nanoparticles with a size of less than 10 nm.3,4 CNDs are rich in functional groups, such as hydroxyl, carboxylate, epoxide, etc.5–7 These groups may enable the uniform dispersal of CNDs in polar solvents8 and confer good water solubility.9,10 CNDs have many significant properties, such as quantum optical characteristics,11 small size,12 uniform shape and composition,13–15 low toxicity and biocompatibility,16,17 fluorescence emission,18 ease of functionalization,19 good conductivity,20 and low cost preparation procedures.21There are two routes for the synthesis of CNDs: top-down and bottom-up.22 In the first approach, the “top-down” synthetic route, bulk materials such as graphite are broken down into CNDs. This route involves laser ablation,23,24 arc discharge,13 or chemical oxidization techniques.25 The second approach, the “bottom-up” synthetic route, involves synthesizing CNDs by hydrothermal/solvothermal treatment26 or microwave pyrolysis27 from small precursors such as carbohydrates, citrate, and polymer silica nanocomposites.19 Both methods are carried out using a physical, chemical and electrochemical process.
CNDs have been synthesized from a wide range of precursors, including both man-made (e.g. candle soot,28 graphite,29 fullerene,30 ethanolamine,31 and citric acid32) and natural resources (e.g. orange juice,33 lemon juice,34 broccoli,35 milk and milk protein,36,37 coffee grounds,38 egg white,39 and banana40). Moreover, some waste materials have also been well utilized for the synthesis of CNDs, such as paper pieces,41 tire soot,42 cigarette butts,43 and olive solid wastes,5 which not only reduces the CND production costs but also abates environmental pollution. Pyrolysis is one of the methods that is used widely to synthesize CNDs from biomass using strong acidic or alkaline media to cleave carbon-based precursors into nanoparticles.44 The properties of CNDs are highly affected by the selected method, precursor, synthesis conditions, pre-treatment, and post-treatment, and the intended applications are also influenced. For instance, the carbonization temperature of sago waste highly affected the fluorescence and sensing parameters of the synthesized carbon nanodots.45
CNDs, due to their peculiar properties, have been used in many applications,46 the most important of which are bioimaging,47 biomedical sensing,46,48 drug delivery,49 cancer phototherapy,50 optronics,51 fingerprint recovery,22,52 light emitting diodes,53 antimicrobials,54 antioxidants, AChE enzyme inhibitors,55 and photocatalysis56 as a photosensitizer in water splitting,57 organic pollutant degradation58 and the degradation of organic dyes (e.g. methylene blue).59
CNDs may be one of the best candidates for the photocatalytic degradation of organic dyes (MB).60 Photocatalysis is an energy conversion process that can be initiated by light absorption in semiconductor materials. Light exposure can generate electrons and holes during photocatalysis.61 CNDs with an energy bandgap between 1.5–3.5 eV![[thin space (1/6-em)]](https://www.rsc.org/images/entities/char_2009.gif) 62 are considered semiconductors with high visible-light absorption and excellent light-trapping ability, generating electron–hole pairs that are needed for photocatalysis and the degradation of organic dyes.
62 are considered semiconductors with high visible-light absorption and excellent light-trapping ability, generating electron–hole pairs that are needed for photocatalysis and the degradation of organic dyes.
In this work, CNDs are synthesized from olive solid wastes by combined pyrolysis-chemical oxidation methods at different carbonization temperatures from 300 to 900 °C, and the effects of the different carbonization temperatures on the optical properties of the CNDs, such UV-Vis, fluorescence, quantum yield, and energy bandgap, are studied. The influence of carbonization temperature on the photoactivity of CNDs as photocatalysts for the degradation of methylene blue (MB) will also be investigated, estimating the degradation efficiency and rate.
Experimental
Materials and methods
Olive solid wastes (OSWs) were obtained from the olive oil extraction plant in Der-Istia (Palestine). All required chemicals and reagents were purchased from Sigma Aldrich, and used without further purification. Milli-Q grade water (>18.2 MΩ cm resistivity) was used in the synthesis of carbon nanodots and distilled water was used to prepare methylene blue solutions.A Beckman Coulter DU 800 Spectrophotometer was used to record UV-Vis spectra from 200 to 800 nm. In the emission range of 320 to 650 nm, steady-state fluorescence spectrum measurements were performed using a PerkinElmer LS50B Fluorescence Spectrophotometer. The spectra were taken at different excitation wavelengths from 320 to 460 nm with an increment of 20 nm. AFM images and profiles were acquired by a Nanosurf CoreAFM microscope and were analyzed by Gwyddion software. AFM samples were prepared by drop-casting a diluted solution of CNDs on a mica substrate and then drying under vacuum at 110 °C. A Thermo Scientific Nicolet IS5 FTIR device equipped with ATR sampling apparatus was used to record Fourier Transform Infrared spectra of the carbonized olive solid wastes and synthesized CNDs in powder form in the range of 4000–650 cm−1 with 8 cm−1 resolution and 64 scans. ζ-Potential measurements were performed by phase analysis light scattering (PALS) for all samples using a NanoBrook Omni instrument. X-ray photoelectron spectroscopy (XPS) measurements were carried out by an A SPECS SAGE HR 100 system using an MgKα X-ray source.
Synthesis of carbon nanodots (CNDs)
The first step in the preparation of CNDs was pyrolysis of the olive solid wastes (OSWs) at different temperatures from (300–900) °C with 100 °C increments for 1 h. The OSWs were purified from impurities and the remaining oil by washing several times using hot water. The purified OSWs were dried in an oven for 24 h and then cooled to room temperature. Carbonization (pyrolysis) was performed by inserting a dried, weighed, well-covered OSW sample in a muffle furnace at different temperatures for 1 h. After completion of carbonization, the samples were cooled to room temperature inside a desiccator. 100 mg of carbonized olive solid waste (COSW) were ground manually using a mortar and pestle to a fine powder and then mixed with 10 ml of MilliQ-water and sonicated for 5 min. 200 μl of 30 wt% H2O2 was added into the previous solution and sonicated by using an Elmasonic S 100H sonicator for 20 min, and then the solution was refluxed for 90 min. After the completion of the reaction, the resulting solution was centrifuged by using a universal 320 centrifuge at 8000 rpm for 20 min. The resulting supernatant was filtered through a 0.2 μm microfilter. A brown powder of CNDs was obtained after lyophilization of the CND solution for 36 h. The as-synthesized CNDs for further characterization and application have been named CD300, CD400, …, CD900. The modified synthesis method conducted in this work is based on the protocol followed previously by Sawalha et al.5 The synthesis process is illustrated in (Fig. 1). | ||
| Fig. 1 The synthesis process of the CNDs. | ||
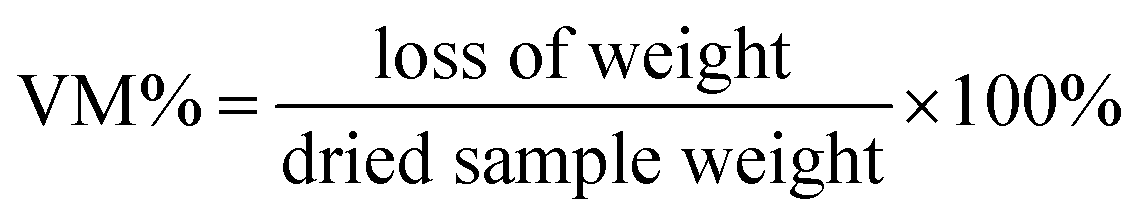
Proximate analysis
Proximate analysis of virgin olive solid wastes and pyrolyzed (carbonized) samples at temperatures from (300–900) °C were performed to determine the moisture content, volatile matter, ash content, and fixed carbon. In brief, a moisture content test was performed by inserting 1 g of sample into a crucible and heating for 1 h at (107 ± 3) °C; the sample was then cooled inside a desiccator and weighed. On the other hand, volatile matter measurement was conducted after the moisture content test by heating the sample inside a lid-covered crucible in a muffle furnace at (950 ± 20) °C for 7 min, and after cooling to ambient temperature the crucible was weighed and the volatile matter was calculated as in eqn (1):
 | (1) |
Moreover, the ash content was obtained after burning the sample in an open-lid crucible in a furnace operated at (700–750) °C for 4 h. The remaining material was weighed after cooling to room temperature.63 Finally, the fixed carbon could be estimated directly from the following formula eqn (2):
| % FC = 100 − (% moisture + % VM + % ash) | (2) |
Quantum yield estimation
The following formula eqn (3) was used to determine the fluorescence quantum yield (% QY) of the CNDs:
 | (3) |
QY is the quantum yield, I is the measured integrated emission intensity, n is the refractive index, and A is the absorption of the sample. The subscript R refers to the reference fluorophore of known quantum yield. For water, n is equal to 1.33. Quinine sulfate in 0.1 M H2SO4 (QR = 0.54 at 360 nm) was chosen as a reference. To minimize re-absorption effects, the absorbencies in the 10 mm cuvette were kept under 0.1 at the excitation wavelength.64,65
Photodegradation of methylene blue (MB)
Methylene blue (MB) was prepared at a concentration of 35 μM by weighing 0.011 g of MB powder and dissolving it in 1 L of deionized water. To determine the wavelength of maximum absorption, a UV-Vis spectrum scan was performed for the MB solution.MB solution in the absence of CNDs was irradiated for 120 min by a tungsten visible light source of 50 W, and the UV-Vis absorption of MB was recorded at 664 nm (maximum absorption peak) at 10 min intervals.
500 μL of 0.27 mg ml−1 CNDs were spiked into 3 ml of MB solution and first left in the dark for 10 min to achieve absorption–desorption equilibrium between the solution moieties. The final obtained concentration of CNDs was 45 mg L−1. For all photodegradation tests, the MB\CNDs solution was irradiated for 120 min and the UV-Vis absorption at 664 nm was also recorded. The same procedure was repeated for the CD300, CD400, CD500, and CD600 synthesized CNDs.
Results and discussion
Carbonization of olive solid wastes and CND synthesis
The first step in the synthesis of CNDs was the carbonization of olive solid wastes at different temperatures to produce a carbon-based material through a bottom-up approach. During this process, drying occurred in the first stage, followed by volatile matter liberation and carbon core build-up from the conversion of the hemicellulose, lignin, and cellulose contents of the olive solid wastes.66The degree of conversion highly depends on the carbonization temperature and time, which can be indicated initially from the weight loss. The weight loss is affected by the carbonization temperature as shown in (Fig. 2a). The weight loss is increased dramatically (from 11.3 to 25.9%) when the temperature increases from 300 to 500 °C and then remains nearly constant (≈27%). The weight loss is related to the drop in moisture and volatile matter and the conversion of organic-based components into fixed carbon. To support the above findings proximate analysis was conducted to find the percentages of moisture, volatile, ash, and fixed carbon content, and the proximate analyses at different carbonization temperatures are reported in (Table S1) in the ESI.†
 | ||
| Fig. 2 (a) Weight loss at different carbonization temperatures, and (b) percentage of fixed carbon and volatile matter vs. carbonization temperature. | ||
Furthermore, Fig. 2b illustrates how volatile matter is lost and the fixed carbon content increased with increasing temperature.
The volatile matter content is high at low carbonization temperature (i.e., 66.7% at 300 °C), but then decreased dramatically after increasing the temperature to 400 °C (22.8%); on the other hand, the fixed carbon content increased from 29.3 to 67.63% in the same temperature range. A further increase in the pyrolysis temperature would lead to partial combustion, high volatile matter loss, ash formation, and an increase in apparent density.67
The conversion of organic matters such as cellulose, lignin, and hemicellulose to carbonaceous materials can be followed by FTIR acquisition of the virgin olive solid wastes and carbonized particles at different temperatures (300, 400, 500, 600, 700, 800, and 900 °C) showing a gradual conversion of these organic compounds into carbon through the loss of oxygenated groups,68 indicating that the carbonization arrived at completion at 400 or 500 °C and a further increase in temperature may cause significant damage to the surface functional groups69 as shown in Fig. 3b.
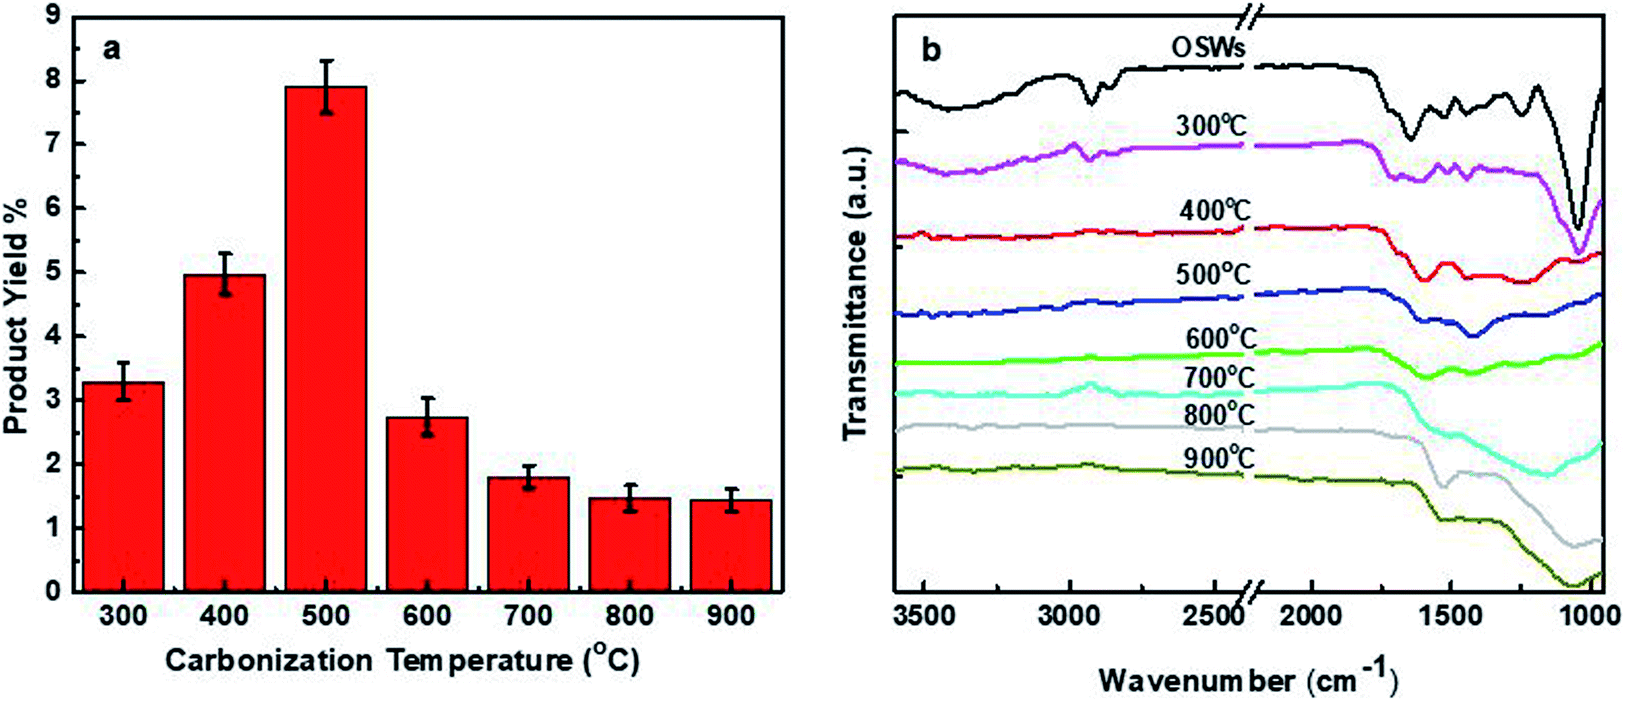 | ||
| Fig. 3 (a) Effect of carbonization temperature on the product yield, and (b) FTIR of olive solid wastes and carbonized particles at different temperatures. | ||
The carbonized olive solid wastes through a top-down approach were subjected to chemical oxidation by hydrogen peroxide as an oxidant to facilitate the breaking down and extraction of carbon dots from the rich carbon particles prepared at different carbonization temperatures. CNDs are successfully obtained for all mentioned temperatures with various product yields. The product yield, as shown in Fig. 3a, increases from about 3.3% at 300 °C to 8% at 500 °C, and then decreased significantly when elevated temperatures were used in the carbonization of the olive solid wastes. The increase in product yield is related to the increase in the amount of fixed carbon with a sufficient content of volatile matter, which might facilitate the penetration of hydrogen peroxide into the carbon particles and break them down into small dots, or the volatile matter may contribute as a carbon source in producing CNDs. Although carbonization at high temperatures gave high fixed carbon, the product yield was very low because of the high loss of volatile matter and the formation of ash, which in their turns resulted in highly compacted rigid carbon particles that hinder the ability of hydrogen peroxide to extract more CNDs.
Size and surface chemical groups
To study the morphology and size of the prepared CNDs at different temperatures, AFM measurements were performed. Fig. 4a and b show the AFM image and height profile of CD300, showing well-dispersed CNDs with a height in the range of 0.3–8.5 nm and having an average size of 3.27 ± 1.05 nm as illustrated in the size distribution histogram (Fig. 4c). The other synthesized CNDs, CD400, CD500 and CD600, also show good size distributions with an average of 3.33 ± 1.3, 3.74 ± 1.2, and 3.37 ± 1.1 nm, respectively. The AFM images, profiles, and histograms are presented in Fig. S1–S3.† | ||
| Fig. 4 (a) AFM image, (b) height profile, and (c) size distribution histogram of the prepared CD300. | ||
The chemical functional groups on the surface of the synthesized CNDs were investigated by FTIR spectroscopy, and the acquisition was done for powder CNDs obtained after lyophilization as shown in Fig. 5. The FTIR spectrum of the CNDs prepared from the precursor carbonized at 300 °C (named CD300) shows different peaks at 3256, 2820, 1711, 1600, 1397, 1326, 1230, and 1066/1038 cm−1, which can be assigned to –OH (hydroxyl)/N–H, C–H, C![[double bond, length as m-dash]](https://www.rsc.org/images/entities/char_e001.gif) O (carbonyl), COO− (carboxylates), C–N, C–O–C (epoxides) and hydroxyl groups, respectively.5–7 Some of these groups originated from the used precursors and others are formed during the oxidation step by hydrogen peroxide. The presence of acidic and oxygenated groups on the surface was also confirmed by ζ-potential measurements with a strong negative charge of −33.6 ± 0.25 mV; this value indicates that the synthesized CNDs are well-dispersed in water.70–73 The other synthesized C-dots, CD400, CD500 and CD600, show similar spectra to the CD300 spectrum but with the lack of some functional groups, such as CO, C–N, and C–O–C, in addition to the reduction in the intensity of the C–OH peaks at 3256 and 1066 cm−1, and also the formation of an intense CC band. These differences are attributed to the original precursor lacking these oxygenated groups because of carbonization at elevated temperatures.63
O (carbonyl), COO− (carboxylates), C–N, C–O–C (epoxides) and hydroxyl groups, respectively.5–7 Some of these groups originated from the used precursors and others are formed during the oxidation step by hydrogen peroxide. The presence of acidic and oxygenated groups on the surface was also confirmed by ζ-potential measurements with a strong negative charge of −33.6 ± 0.25 mV; this value indicates that the synthesized CNDs are well-dispersed in water.70–73 The other synthesized C-dots, CD400, CD500 and CD600, show similar spectra to the CD300 spectrum but with the lack of some functional groups, such as CO, C–N, and C–O–C, in addition to the reduction in the intensity of the C–OH peaks at 3256 and 1066 cm−1, and also the formation of an intense CC band. These differences are attributed to the original precursor lacking these oxygenated groups because of carbonization at elevated temperatures.63
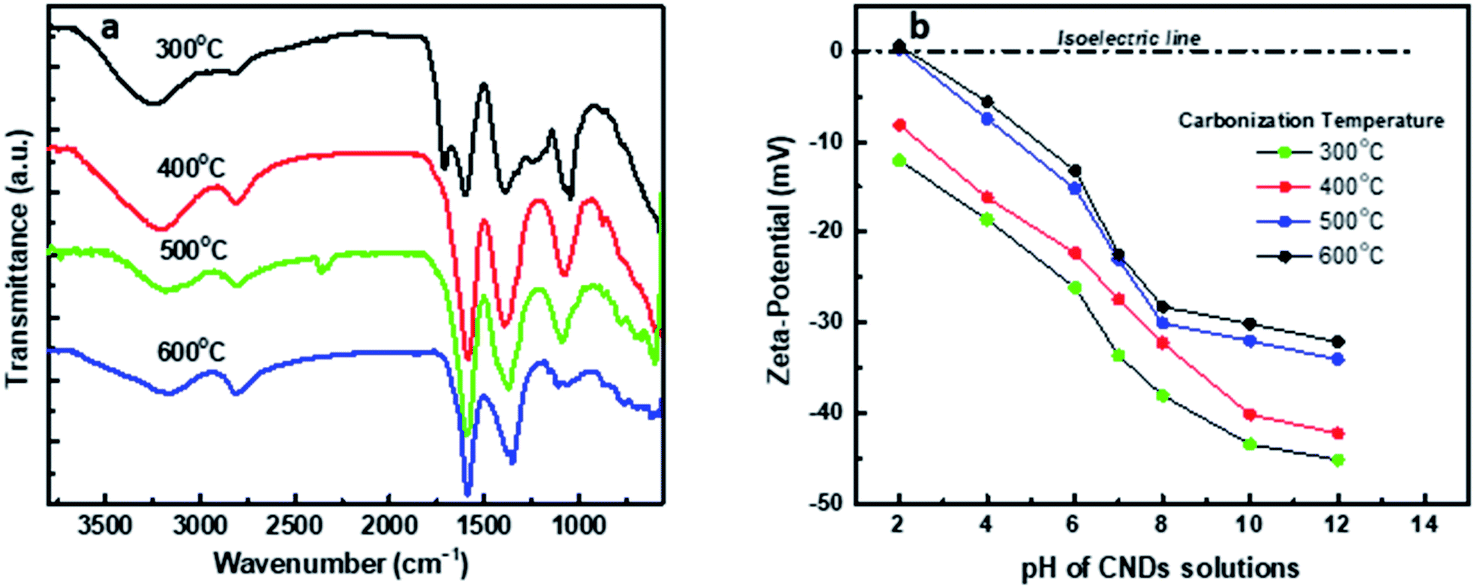 | ||
| Fig. 5 (a) FTIR spectra of the synthesized CNDs. (b) Effect of pH on the z-potential of the synthesized CNDs at different carbonization temperatures. | ||
The lack or decay of oxygenated groups was also confirmed by the ζ-potential, showing a drop in negativity as the carbonization temperature increased, from −33.6 for CD300 to −22.4 ± 0.23 for CD600. The negativity of CD400 and CD500 was −27.4 ± 0.85 and −23.01 ± 0.15 mV, respectively. PALS ζ-potential curves of CD300 and CD400 are shown in Fig. S4.†
Moreover, the effect of pH on the surface charge (ζ-potential) was investigated for the synthesized CNDs, showing that they are negatively charged in a wide range of pH values from 2–12, except for CNDs synthesized at 500 and 600 °C which show an isoelectric point at pH < 3 with low positive charges of 0.15 and 0.55 mV, respectively (see Fig. 5b). These findings confirm the stability and good dispersity of the synthesized CNDs in different media for a long time (more than 6 months) without the formation of any precipitates and as followed up by absorption and fluorescence spectra.
To support the findings of FTIR, XPS acquisition was conducted for CD300. The XPS survey spectrum as illustrated in Fig. S5† shows three peaks at 285, 400 and 532 eV, indicating that the synthesized CNDs are composed of C, O and N with an atomic percentage of 61.3, 34.2 and 4.6%, respectively. The high-resolution spectra of C1s, O1s and N1s can be deconvoluted into different peaks, suggesting the existence of CD surface functional groups as reported in Table 1.
The XPS investigations match well with the FT-IR spectra, confirming that the oxygenated groups are present in the CD structure as carbonyl, carboxylate, hydroxyl and epoxide groups.
Optical properties
The optical properties of the synthesized CNDs were explored by conducting the UV-Vis and photoluminescence spectral acquisition. All of the synthesized CNDs (CD300–CD600) are pale yellow colored and transparent under daylight, while they emit bright blue fluorescence under UV light. The absorption spectrum of the prepared CNDs as illustrated in Fig. 6a appears generally in the UV region with a tail extending towards the visible region, which is usually considered as the fingerprint of most CNDs.79 No significant differences in the formed peaks have been observed between the different synthesized CNDs. The only difference that could be noticed is the value of the wavelength where CNDs start to absorb energy in the visible region; this discrepancy leads to different values of energy bandgap. The energy bandgap (optical) could be estimated using indirect bandgap calculations based on UV-Vis absorption spectrum calculations and by plotting (ahν)0.5 versus hν, where h is Plank's constant, A is the measured absorption, ν is the frequency and hν is equal to 1240/wavelength.80 This plot (the Tauc plot) includes a region with a linear relationship that is extrapolated to the x-axis to give the value of the energy bandgap in eV as presented in Fig. 6b. The bandgap for the synthesized CNDs (CD300–CD600) has been estimated as shown in Fig. S6† and the results are 2.77, 2.65, 2.51, and 2.46 eV, respectively. The values of the energy bandgap for the synthesized CNDs from 2.46 to 2.77 eV are in the visible region and are consistent with other studies showing C-dots with values in the range of 1.5–3.5 eV.4,62 The carbon dots synthesized from carbonized olive solid wastes at 300 °C (named CD300) show the highest energy bandgap of 2.77 eV, and this high value compared to the other CNDs (CD400, CD500, and CD600) could be attributed to the existence of oxygenated groups such as CO, C–O–C, and C–OH on the surface and its highest electron withdrawing charge capacity.81.
 | ||
| Fig. 6 (a) The absorption spectra of the prepared CNDs, and (b) Tauc plot of CD300. | ||
Photoluminescence (PL) measurements for the CD300 solution were carried out at different excitation wavelengths. The fluorescence spectra of the CNDs in Fig. 7a show a maximum emission at 440 nm at an excitation wavelength of 360 nm. By exciting from 300 to 360 nm, the CND emission intensity is increased. At excitation wavelengths higher than 360 nm, the maximum emission wavelength shifted to lower energy values with a simultaneous decrease in the fluorescence intensity; this emission excitation dependence is a well-known phenomenon of CNDs82–84 and could be ascribed to surface defects, different functional groups and emissive surface energy traps.85–87
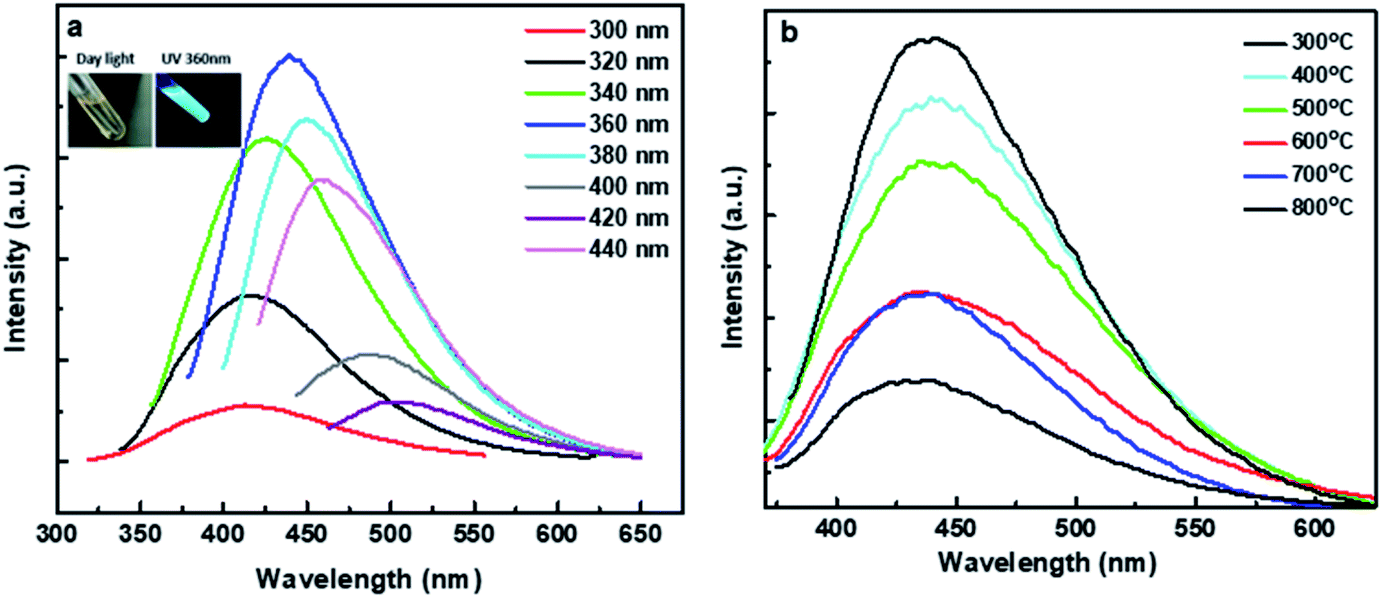 | ||
| Fig. 7 (a) Photoluminescence (PL) intensity at different excitation wavelengths for CD300, and (b) PL intensity at 360 nm with different carbonization temperatures. | ||
The fluorescence of the other synthesized CNDs (CD300–CD800) was measured at an excitation wavelength of 360 nm (maximum intensity) as illustrated in Fig. 7b. The fluorescence intensity is decreased when the carbonization temperature increases from 300 to 800 °C. Furthermore, the fluorescence quantum yield was measured with quinine sulfate (% QY = 54%) as a standard reference. Fig. 8 shows the QY% for all samples. It is obvious that the QY decreases when the carbonization temperature is altered, with a drop of about 2 fold when the temperature is increased from 300 to 800 °C; this decay could be attributed to the loss of surface defects and the loss of some PL emission-responsive oxygenated groups (such as carbonyl, carboxyl, epoxide and hydroxyl groups88) during carbonization at elevated temperatures,67 and the partial inability to reform these groups during the chemical oxidation step of CND synthesis. This was clear from the FTIR acquisition for both the raw carbon and synthesized CNDs (Fig. 3b and 5). The detailed calculation of the quantum yield is reported in Table S2.†
 | ||
| Fig. 8 Quantum yield of the synthesized CNDs. | ||
Photodegradation of methylene blue (MB)
The degradation of MB by the CNDs synthesized at different carbonization temperatures was investigated. 500 μl of 0.27 mg ml−1 CNDs were added to MB solution to obtain a final CND dose of 45 mg L−1 and then irradiated for 120 minutes by a visible tungsten light of 50 W. Every 10 minutes, the UV-Vis absorptions were recorded at 664 nm as shown in Fig. 9a, and the degradation efficiency was evaluated and plotted versus time.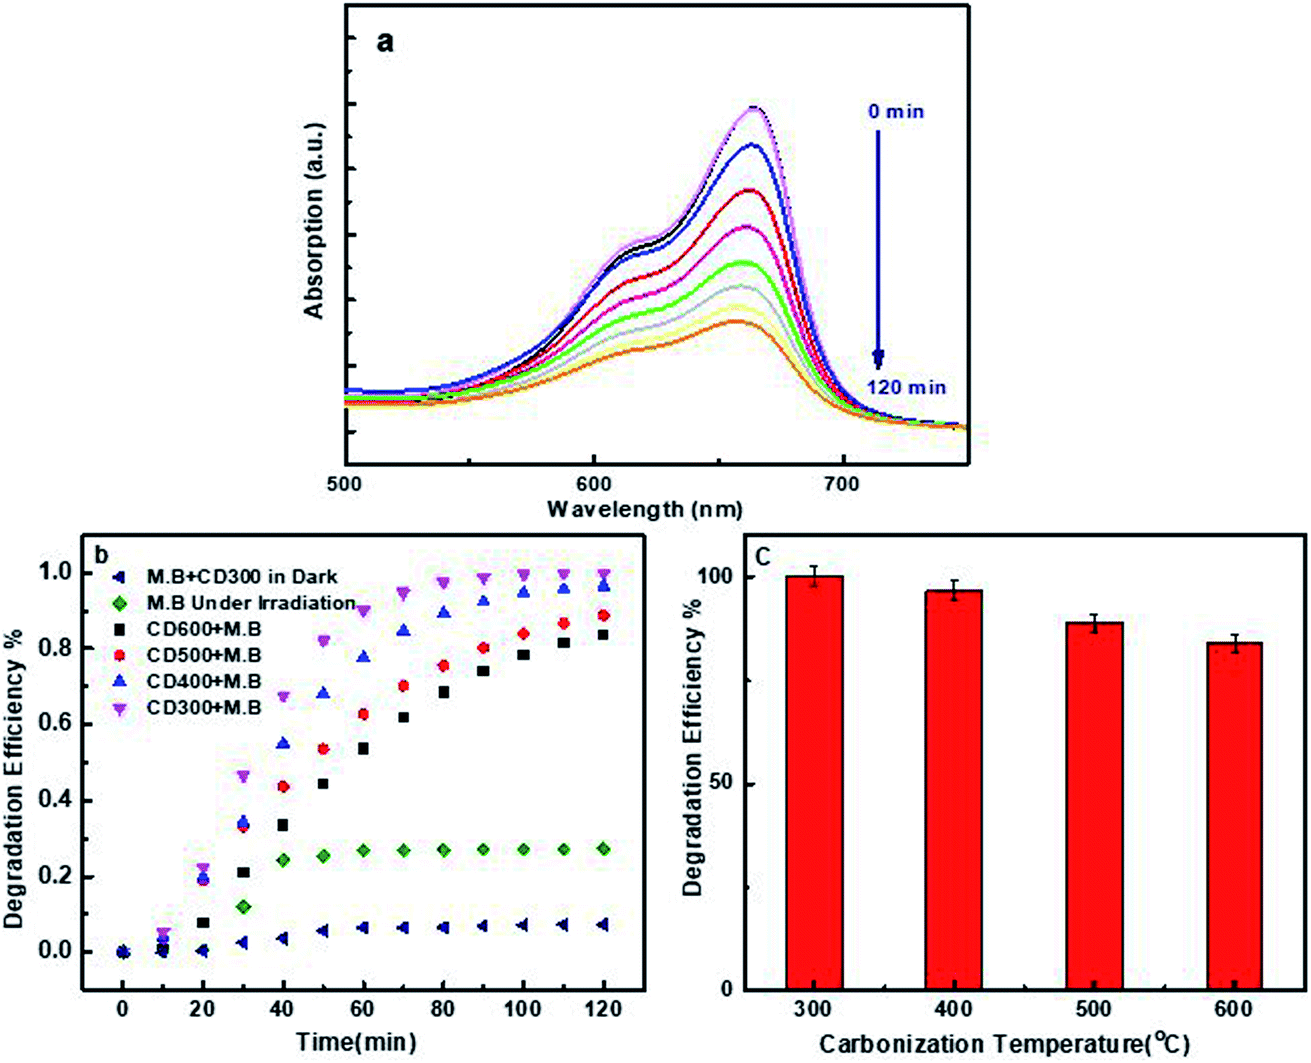 | ||
| Fig. 9 (a) UV-Vis spectrum of MB solution spiked with 500 μl of CNDs and irradiated by 50 W visible light for 120 minutes. (b) Degradation efficiency of CNDs at different times. (c) Degradation efficiency of MB spiked with CNDs under light irradiation after 120 min. | ||
For the prepared CNDs (CD300–CD600) and as shown in Fig. 9b, the degradation efficiency at 120 min increased from 27.4% in the absence of the photocatalyst up to 100% in the presence of CD300. The degradation efficiency was estimated using the following equation eqn (4):
 | (4) |
Because the MB dye is a heterocyclic aromatic chemical compound with three coupled aromatic rings and functional groups (C–S), (CN), and (CN), there was no degradation in the dark. Because of the complicated carbon-bonding in the MB structure, the adsorption reaction between the CNDs and MB molecules was difficult.6 The poor degradation of methylene blue in the absence of a photocatalyst (27%) can be attributed to the lone pairs present at the nitrogen and sulfur atoms in MB. After being exposed to light, these electron-rich areas become active. They possess repulsive forces between the bond pair electrons, which creates instability, and therefore they attack the water molecules in their environment to form a stable bond.7 MB spiked by CNDs shows very little degradation (≈7.3%) in the dark, which could be attributed to the adsorption of cationic MB onto the surface of the anionic CNDs.
The photodegradation of the MB solution was also examined by the use of the other prepared CNDs (CD400, CD500, and CD600) with the same dose and previously followed procedure. The degradation efficiency decreased slightly with increasing the carbonization temperature of the olive solid wastes, as illustrated in Fig. 9b and c.
The degradation rate is another important degradation parameter that should be considered. In this work, the Langmuir–Hinshelwood dynamic model was suggested,89 where the degradation kinetics of MB can be simplified using the pseudo-first-order kinetic equation as indicated in eqn (5)
 | (5) |
 | ||
| Fig. 10 (a) Fitting of the Langmuir–Hinshelwood dynamic model at 45 mg L−1 CD300. (b) Degradation rate of MB at different carbonization temperatures of the CNDs. | ||
CD300 gives the highest degradation rate of the MB solution at 0.0575 min−1, in addition to a degradation efficiency of 100% after 120 min. The degradation rate is gradually decreased when the carbonization temperature increases, decreasing by 3.25 fold when the temperature is raised from 300 to 600 °C. The high degradation efficiency and the rate at 300 °C are ascribed to a wide bandgap compared to the other synthesized CNDs, because an increase in bandgap energy in the visible region from 2.46 to 2.77 eV can increase the separation of holes (h+) and electrons (e−) and hinder and delay the rapid recombination process of charge carriers h+ and e−.90
When high-energy photons excite the CNDs, electrons are excited from the ground state (valence band) to the excitation state (conduction band), resulting in excess electrons (e−) and holes (h+). Because of the abundance of surface defects on the CNDs, some excited carriers are trapped, preventing e− and h+ recombination. As a result, the methylene blue might be immediately oxidized by h+, resulting in degradation.66 Meanwhile, some of the e− may be caught by oxygen dissolved in the solution, resulting in superoxide radicals, while some of the h+ may interact with surface-adsorbed H2O, resulting in hydroxyl radicals. Organic dyes are known to be degraded by reactive oxygen species (ROS), superoxide radicals,91 and hydroxyl radicals.66,92 The degradation mechanism is summarized in (Fig. 11).
 | ||
| Fig. 11 The degradation mechanism of methylene blue. | ||
It is worth pointing out that the CNDs prepared in this work are shown to be very promising candidates for dye photodegradation, environmental protection, and cleanliness. The CNDs synthesized at different carbonization temperatures have been compared with other works in terms of MB photodegradation efficiency and rate, showing excellent results as summarized in Table 2.
| CND precursor | Efficiency | Rate (min−1) | Dose (mg L−1) | Degradation time (min) | Light source | Photocatalyst | Dye | Ref. |
|---|---|---|---|---|---|---|---|---|
| a Not reported by the author and calculated from available data.b NR: not reported. | ||||||||
| Graphite rods | 94.45 | 0.0080 | 1000 | 120 | Tungsten light (400 W) | CQDs/Bi2O2CO3 | M.B | 93 |
| Ascorbic acid | 56.00 | 0.0284a | 500 | 90 | Tungsten light (400 W) | Mesoporous hematite + CQD | M.B | 94 |
| Citric acid and O-phosphoryl ethanol amine | 91.5a | 0.0808a | 2000 | 25 | Xenon lamp (300 W) | CQDs/TiO2 | M.B | 95 |
| Solid tire wastes | 90.00 | 0.0852a | 0.4 | 1560 | UV (10 W high-pressure Hg lamp) | ZnO–P-CNDs | M.B | 96 |
| Pear juice | 99.50 | 0.03889a | N. Rb | 130 | Tungsten lamp (60 W) | CQDs | M.B | 66 |
| Frying oil | 88.00 | 0.0777a | N. Rb | 1800 | UV light | CNDs | M.B | 97 |
| Uric acid, HCL, and glucose | 50.00 | 0.0248a | N. Rb | 1500 | Tungsten light (20 W) | CNDs | M.B | 98 |
| Uric acid, HCl, and glucose | 95.00a | 0.0867a | 0.4 | 1800 | Tungsten light (20 W) | ZnO + CNDS | M.B | 98 |
| Glucose + sodium hydroxide + acetic acid | 29.00a | 0.0107a | 2000 | 30 | Xenon lamp (400 W) | Magnetic CNDs | M.B | 99 |
| Citric acid and urea | 99.90 | 0.0447 | 1000 | 90 | Solar light | CQDs + TiO2 | M.B | 100 |
| Citric acid | 99.90 | 0.0240 | 3000 | 170 | High power mercury-xenon light source set at 310 W | CNDs | M.B | 101 |
|
||||||||
| Olive solid wastes | ||||||||
| CD300 | 100.00 | 0.0575 | 45 | 120 | Tungsten light (50 W) | CNDs | M.B | In this work |
| CD400 | 96.50 | 0.0348 | 45 | 120 | Tungsten light (50 W) | CNDs | M.B | |
| CD500 | 88.80 | 0.0194 | 45 | 120 | Tungsten light (50 W) | CNDs | M.B | |
| CD600 | 83.80 | 0.0177 | 45 | 120 | Tungsten light (50 W) | CNDs | M.B | |
Conclusions
\In this work, carbon nanodots were synthesized by the combination of pyrolysis (carbonization) of olive solid wastes and chemical oxidation of the produced carbonaceous material, and it was clarified that the carbonization temperature had a significant effect on the production yield of CNDs, with an increase by increasing the temperature up to 500 °C followed by a decrease to very low values. Furthermore, the carbonization temperature strongly affected the properties and intended applications of the synthesized CNDs. Negativity, quantum yield, energy bandgap, and photoactivity are the main affected properties with maximum values obtained for CNDs produced from olive solid wastes at 300 °C, due to the presence of oxygenated functional groups on the surface. The prepared CNDs were efficient visible-light photocatalysts used successfully to photodegrade methylene blue with an efficiency of 100% after 120 minutes and a rate equal to 0.0575 min−1. It was also obvious that an increase in carbonization temperature from 300 to 600 °C resulted in a decrease of the degradation rate of about 3.25 folds, which could be ascribed to rapid electron–hole recombination in the CNDs produced by carbonization at elevated temperatures.Author contributions
Shadi Sawalha: Supervision, Conceptualization, Investigation, Methodology, Visualization, Formal analysis, and Writing-review and editing. Mohyeddin Assali: Conceptualization, Investigation, Methodology, Visualization, Validation and Writing-review and editing. Ameerah Nasasrah, Maha Salman, Majd Nasasrah and Madleen Jitan: Conceptualization, Investigation, Methodology, Visualization and Writing original draft. Ahed Zyuod and Hikmat Hilal: Resources and Validation.Conflicts of interest
There are no conflicts to declare.Acknowledgements
The authors would like to thank Mr Nafez Dweikat, the technician in the department of chemistry (An-Najah National University) for his help in performing Infrared spectra acquisitions. Also, we would like to thank Prof. Maurizio Prato and his group at CIC BiomaGUNE, San Sebastian-Spain for their help in performing XPS measurements.References
- A. T. Sheardy, D. M. Arvapalli and J. Wei, J. Phys.l Chem. C, 2020, 124, 4684–4692 CrossRef CAS.
- C. Xu, K. Xu, H. Gu, R. Zheng, H. Liu, X. Zhang, Z. Guo and B. Xu, J. Am. Chem. Soc., 2004, 126, 9938–9939 CrossRef CAS.
- X. Gao, C. Du, Z. Zhuang and W. Chen, J. Mater. Chem. C, 2016, 4, 6927–6945 RSC.
- H. Li, Z. Kang, Y. Liu and S.-T. Lee, J. Mater. Chem., 2012, 22, 24230–24253 RSC.
- S. Sawalha, A. Silvestri, A. Criado, S. Bettini, M. Prato and L. Valli, Carbon, 2020, 167, 696–708 CrossRef CAS.
- P. Das, M. Bose, S. Ganguly, S. Mondal, A. K. Das, S. Banerjee and N. C. Das, Nanotechnology, 2017, 28, 195501 CrossRef.
- K. Radhakrishnan, P. Panneerselvam and M. Marieeswaran, Anal. Methods, 2019, 11, 490–506 RSC.
- A. Yadav, L. Bai, Y. Yang, J. Liu, A. Kaushik, G. J. Cheng, L. Jiang, L. Chi and Z. Kang, Nanoscale, 2017, 9, 5049–5054 RSC.
- Q. Wu, W. Li, J. Tan, Y. Wu and S. Liu, Chem. Eng. J., 2015, 266, 112–120 CrossRef CAS.
- S. Y. Park, H. U. Lee, E. S. Park, S. C. Lee, J.-W. Lee, S. W. Jeong, C. H. Kim, Y.-C. Lee, Y. S. Huh and J. Lee, ACS Appl. Mater. Interfaces, 2014, 6, 3365–3370 CrossRef CAS PubMed.
- S. B. Aziz, O. G. Abdullah, M. Brza, A. K. Azawy and D. A. Tahir, Results Phys., 2019, 15, 102776 CrossRef.
- X. T. Zheng, A. Ananthanarayanan, K. Q. Luo and P. Chen, Small, 2015, 11, 1620–1636 CrossRef CAS PubMed.
- W. Kwon, G. Lee, S. Do, T. Joo and S. W. Rhee, Small, 2014, 10, 506–513 CrossRef CAS PubMed.
- M. Y. Pudza, Z. Z. Abidin, S. Abdul-Rashid, F. M. Yassin, A. S. M. Noor and M. Abdullah, ChemistrySelect, 2019, 4, 4140–4146 CrossRef CAS.
- Y. Wang, P. Anilkumar, L. Cao, J.-H. Liu, P. G. Luo, K. N. Tackett, S. Sahu, P. Wang, X. Wang and Y.-P. Sun, Exp. Biol. Med., 2011, 236, 1231–1238 CrossRef CAS PubMed.
- G. Leménager, E. De Luca, Y.-P. Sun and P. P. Pompa, Nanoscale, 2014, 6, 8617–8623 RSC.
- N. C. Verma, A. Yadav and C. K. Nandi, Nat. Commun., 2019, 10, 1–4 CrossRef CAS.
- W.-J. Wang, J.-M. Xia, X. Hai, M.-L. Chen and J.-H. Wang, Environ. Sci., 2017, 4, 1037–1044 CAS.
- P. Miao, K. Han, Y. Tang, B. Wang, T. Lin and W. Cheng, Nanoscale, 2015, 7, 1586–1595 RSC.
- N. A. M. Nor, H. Nakao, J. Jaafar and J.-D. Kim, Int. J. Hydrogen Energy, 2020, 45, 9979–9988 CrossRef.
- R. M. El-Shabasy, M. F. Elsadek, B. M. Ahmed, M. F. Farahat, K. M. Mosleh and M. M. Taher, Processes, 2021, 9, 388 CrossRef CAS.
- N. Papaioannou, A. Marinovic, N. Yoshizawa, A. E. Goode, M. Fay, A. Khlobystov, M.-M. Titirici and A. Sapelkin, Sci. Rep., 2018, 8, 1–10 CAS.
- D. Tan, Y. Yamada, S. Zhou, Y. Shimotsuma, K. Miura and J. Qiu, Carbon, 2014, 69, 638–640 CrossRef.
- R. Das, R. Bandyopadhyay and P. Pramanik, Mater. Today Chem., 2018, 8, 96–109 CrossRef CAS.
- B.-P. Qi, L. Bao, Z.-L. Zhang and D.-W. Pang, ACS Appl. Mater. Interfaces, 2016, 8, 28372–28382 CrossRef CAS PubMed.
- P.-C. Hsu and H.-T. Chang, Chem. Commun., 2012, 48, 3984–3986 RSC.
- A. A. Kokorina, E. S. Prikhozhdenko, G.B. Sukhorukov, A. V. Sapelkin and I. Yu. Goryacheva, Russian Chemical Reviews, November, 2017, vol. 86 Search PubMed.
- H. Liu, T. Ye and C. Mao, Angew. Chem., 2007, 119, 6593–6595 CrossRef.
- Q. Wang, H. Zheng, Y. Long, L. Zhang, M. Gao and W. Bai, Carbon, 2011, 49, 3134–3140 CrossRef CAS.
- J. Lan, C. Liu, M. Gao and C. Huang, Talanta, 2015, 144, 93–97 CrossRef CAS PubMed.
- X. Dong, Y. Su, H. Geng, Z. Li, C. Yang, X. Li and Y. Zhang, J. Mater. Chem. C, 2014, 2, 7477–7481 RSC.
- J. Schneider, C. J. Reckmeier, Y. Xiong, M. von Seckendorff, A. S. Susha, P. Kasák and A. L. Rogach, J. Phys.l Chem. C, 2017, 121, 2014–2022 CrossRef CAS.
- S. Sahu, B. Behera, T. K. Maiti and S. Mohapatra, Chem. Commun., 2012, 48, 8835–8837 RSC.
- B. T. Hoan, P. D. Tam and V.-H. Pham, J. Nanotechnol., 2019, 1–9 Search PubMed.
- N. Arumugam and J. Kim, Mater. Lett., 2018, 219, 37–40 CrossRef CAS.
- L. Wang and H. S. Zhou, Anal. Chem., 2014, 86, 8902–8905 CrossRef CAS PubMed.
- S. Bajpai, A. D'Souza and B. Suhail, Int. Nano Lett., 2019, 9, 203–212 CrossRef CAS.
- H. Xu, L. Xie and M. Hakkarainen, ACS Sustainable Chem. Eng., 2017, 5, 5360–5367 CrossRef CAS.
- Z. Zhang, W. Sun and P. Wu, ACS Sustainable Chem. Eng., 2015, 3, 1412–1418 CrossRef CAS.
- B. De and N. Karak, RSC Adv., 2013, 3, 8286–8290 RSC.
- Y. Jeong, K. Moon, S. Jeong, W.-G. Koh and K. Lee, ACS Sustainable Chem. Eng., 2018, 6, 4510–4515 CrossRef CAS.
- H. Y. Ko, Y. W. Chang, G. Paramasivam, M. S. Jeong, S. Cho and S. Kim, Chem. Commun., 2013, 49, 10290–10292 RSC.
- R. Bandi, N. P. Devulapalli, R. Dadigala, B. R. Gangapuram and V. Guttena, ACS Omega, 2018, 3, 13454–13466 CrossRef CAS PubMed.
- C. Kang, Y. Huang, H. Yang, X. F. Yan and Z. P. Chen, Nanomaterials, 2020, 10, 2316 CrossRef CAS PubMed.
- X. W. Tan, A. N. B. Romainor, S. F. Chin and S. M. Ng, J. Anal. Appl. Pyrolysis, 2014, 105, 157–165 CrossRef CAS.
- P. Roy, P.-C. Chen, A. P. Periasamy, Y.-N. Chen and H.-T. Chang, Mater. Today, 2015, 18, 447–458 CrossRef CAS.
- A. Kasouni, T. Chatzimitakos and C. Stalikas, C, 2019, 5, 19 CAS.
- L. Xiao and H. Sun, Nanoscale Horiz., 2018, 3, 565–597 RSC.
- I. J. Gomez, B. Arnaiz, M. Cacioppo, F. Arcudi and M. Prato, J. Mater. Chem. B, 2018, 6, 5540–5548 RSC.
- B. Zhou, Z. Guo, Z. Lin, L. Zhang, B.-P. Jiang and X.-C. Shen, Inorg. Chem. Front., 2019, 6, 1116–1128 RSC.
- N. Gao, L. Huang, T. Li, J. Song, H. Hu, Y. Liu and S. Ramakrishna, J. Appl. Polym. Sci., 2019, 137, 48443 CrossRef.
- C.-F. Wang, R. Cheng, W.-Q. Ji, K. Ma, L. Ling and S. Chen, ACS Appl. Mater. Interfaces, 2018, 10, 39205–39213 CrossRef CAS PubMed.
- J. Liu, R. Li and B. Yang, ACS Cent. Sci., 2020, 6, 2179–2195 CrossRef CAS PubMed.
- S. Demirci, A. B. McNally, R. S. Ayyala, L. B. Lawson and N. Sahiner, J. Drug Deliv. Sci. Technol., 2020, 59, 101889 CrossRef CAS.
- S. S. Suner, M. Sahiner, R. S. Ayyala, V. R. Bhethanabotla and N. Sahiner, J. Fluoresc., 2021, 31, 1705–1717 CrossRef CAS PubMed.
- C. Liu, J. Hu, H. Sui, Q. Zhao, X. Zhang and W. Wang, Drug Deliv. Transl. Res., 2017, 7, 325–332 CrossRef CAS PubMed.
- D. Kumar, K. Singh, V. Verma and H. Bhatti, J. Bionanoscience, 2014, 8, 274–279 CrossRef CAS.
- J. Di, J. Xia, Y. Ge, H. Li, H. Ji, H. Xu, Q. Zhang, H. Li and M. Li, Appl. Catal. B Environ., 2015, 168, 51–61 CrossRef.
- A. Thakur, P. Kumar, D. Kaur, N. Devunuri, R. Sinha and P. Devi, RSC Adv., 2020, 10, 8941–8948 RSC.
- S. Bibi, A. Ahmad, M. A. R. Anjum, A. Haleem, M. Siddiq, S. S. Shah and A. Al Kahtani, J. Environ. Chem. Eng., 2021, 9, 105580 CrossRef CAS.
- C. Zhou, G. Zeng, D. Huang, Y. Luo, M. Cheng, Y. Liu, W. Xiong, Y. Yang, B. Song and W. Wang, J. Hazard. Mater., 2020, 386, 121947 CrossRef CAS PubMed.
- H. Sutanto, I. Alkian, N. Romanda, I. Lewa, I. Marhaendrajaya and P. Triadyaksa, AIP Adv., 2020, 10, 055008 CrossRef CAS.
- B. C. Chaves Fernandes, K. Ferreira Mendes, A. F. Dias Júnior, V. P. da Silva Caldeira, T. M. da Silva Teófilo, T. Severo Silva, V. Mendonça, M. de Freitas Souza and D. Valadão Silva, Materials, 2020, 13, 5841 CrossRef PubMed.
- K. Lawson-Wood, S. Upstone and K. Evans, Fluorescene Spectroscopy, 2018, 1–5 Search PubMed.
- R.-J. Fan, Q. Sun, L. Zhang, Y. Zhang and A.-H. Lu, Carbon, 2014, 71, 87–93 CrossRef CAS.
- G. S. Das, J. P. Shim, A. Bhatnagar, K. M. Tripathi and T. Kim, Sci. Rep., 2019, 9, 1–9 Search PubMed.
- T. d. P. Protásio, P. F. Trugilho, S. Mirmehdi and M. G. d. Silva, Cienc. Agrotecnol., 2014, 38, 435–444 CrossRef.
- S.-X. Zhao, N. Ta and X.-D. Wang, Energies, 2017, 10, 1293 CrossRef.
- R. Chatterjee, B. Sajjadi, W.-Y. Chen, D. L. Mattern, N. Hammer, V. Raman and A. Dorris, Front. Energy Res., 2020, 8, 85 CrossRef.
- R. Bandi, B. R. Gangapuram, R. Dadigala, R. Eslavath, S. S. Singh and V. Guttena, RSC Adv., 2016, 6, 28633–28639 RSC.
- S. Bettini, S. Sawalha, L. Carbone, G. Giancane, M. Prato and L. Valli, Nanoscale, 2019, 11, 7414–7423 RSC.
- R. Patidar, B. Rebary, D. A. Sanghani, G. R. Bhadu and P. Paul, Luminescence, 2017, 32, 1466–1472 CrossRef CAS PubMed.
- M. Xue, Z. Zhan, M. Zou, L. Zhang and S. Zhao, New J. Chem., 2016, 40, 1698–1703 RSC.
- Y. Ding, F. Zhang, J. Xu, Y. Miao, Y. Yang, X. Liu and B. Xu, RSC Adv., 2017, 7, 28754–28762 RSC.
- D. Stefanakis, A. Philippidis, L. Sygellou, F. George, D. Ghanotakis and D. Anglos, J. Nanoparticle Res., 2014, 16, 2646 CrossRef.
- Z. Yang, M. H. Xu, Y. Liu, F. J. He, F. Gao, Y. J. Su, H. Wei and Y. F. Zhang, Nanoscale, 2014, 6, 1890–1895 RSC.
- M. Y. Xue, Z. H. Zhan, M. B. Zou, L. L. Zhang and S. L. Zhao, New J. Chem., 2016, 40, 1698–1703 RSC.
- J. Gong, X. Q. An and X. J. Yan, New J. Chem., 2014, 38, 1376–1379 RSC.
- C. Carbonaro, M. Salis, O. Thakkar and C. Ricci, J. Carbon Res., 2019, 5, 60 CrossRef CAS.
- Z. Zeng, W. Zhang, D. M. Arvapalli, B. Bloom, A. Sheardy, T. Mabe, Y. Liu, Z. Ji, H. Chevva and D. H. Waldeck, Phys. Chem. Chem. Phys., 2017, 19, 20101–20109 RSC.
- F. López-Urías, J. L. Fajardo-Díaz, A. J. Cortés-López, C. L. Rodríguez-Corvera, L. E. Jiménez-Ramírez and E. Muñoz-Sandoval, Appl. Surf. Sci., 2020, 521, 146435 CrossRef.
- S. Zhu, Y. Song, X. Zhao, J. Shao, J. Zhang and B. Yang, Nano Res., 2015, 8, 355–381 CrossRef CAS.
- F. Arcudi, L. Dordevic and M. Prato, Angew. Chem., Int. Ed., 2016, 55, 2107–2112 CrossRef CAS PubMed.
- A. Sharma, T. Gadly, A. Gupta, A. Ballal, S. K. Ghosh and M. Kumbhakar, J. Phys. Chem. Lett., 2016, 7, 3695–3702 CrossRef CAS PubMed.
- X. Wang, Y. Feng, P. Dong and J. Huang, Front. Chem., 2019, 7, 671 CrossRef CAS PubMed.
- Y. Wang and A. Hu, J. Mater. Chem. C, 2014, 2, 6921–6939 RSC.
- X. Zhang, M. Jiang, N. Niu, Z. Chen, S. Li, S. Liu and J. Li, ChemSusChem, 2018, 11, 11–24 CrossRef PubMed.
- H. Ding, X.-H. Li, X.-B. Chen, J.-S. Wei, X.-B. Li and H.-M. Xiong, J. Appl. Phys., 2020, 127, 231101 CrossRef CAS.
- R. Jiang, G. Lu, Z. Yan, D. Wu, R. Zhou and X. Bao, Chem. Eng. J., 2019, 374, 79–90 CrossRef CAS.
- S. Prasad, P. Shanmugam, K. Bhuvaneswari, G. Palanisamy, T. Pazhanivel, T. Arunkumar, M. S. AlSalhi and M. J. Aljaafreh, Crystals, 2020, 10, 300 CrossRef CAS.
- Y. Zhou, E. M. Zahran, B. A. Quiroga, J. Perez, K. J. Mintz, Z. Peng, P. Y. Liyanage, R. R. Pandey, C. C. Chusuei and R. M. Leblanc, Appl. Catal. B Environ., 2019, 248, 157–166 CrossRef CAS PubMed.
- S. Hu, R. Tian, Y. Dong, J. Yang, J. Liu and Q. Chang, Nanoscale, 2013, 5, 11665–11671 RSC.
- Z. Zhang, S. Lin, X. Li, H. Li, T. Zhang and W. Cui, Nanomaterials, 2018, 8, 330 CrossRef PubMed.
- B. Y. Yu and S.-Y. Kwak, J. Mater. Chem., 2012, 22, 8345–8353 RSC.
- Y. Guo, F. Cao and Y. Li, Sensor. Actuator. B Chem., 2018, 255, 1105–1111 CrossRef.
- N. N. Mohammad, K. M. Omer and S. Baban, J. Mater. Sci.: Mater. Electron., 2019, 30, 11598–11606 CrossRef CAS.
- M. P. Aji, P. A. Wiguna, N. Rosita and S. Aisyah, Am. J. Appl. Sci., 2016, 13, 432–438 CrossRef CAS.
- K. M. Omer, N. N. Mohammad, S. O. Baban and A. Q. Hassan, J. Photochem. Photobiol. Chem., 2018, 364, 53–58 CrossRef CAS.
- A.-C. Sun, Adv. Powder Technol., 2018, 29, 719–725 CrossRef CAS.
- P. S. Saud, B. Pant, A.-M. Alam, Z. K. Ghouri, M. Park and H.-Y. Kim, Ceram. Int., 2015, 41, 11953–11959 CrossRef CAS.
- J. Cheng, C. Zhan, J. Wu, Z. Cui, J. Si, Q. Wang, X. Peng and L.-S. Turng, ACS Omega, 2020, 5, 5389–5400 CrossRef CAS PubMed.
Footnotes |
| † Electronic supplementary information (ESI) available. See DOI: 10.1039/d1ra09273a |
| ‡ These authors contributed equally to this work. |
| This journal is © The Royal Society of Chemistry 2022 |