 Open Access Article
Folic acid functionalized aggregation-induced emission nanoparticles for tumor cell targeted imaging and photodynamic therapy†
Danning Wen‡
a,
Xueyun Zhang‡a,
Lei Dinga,
Huan Wenb,
Wen Liu *ab,
Chengwu Zhangb,
Bin Wang*b,
Lihong Li
 ab and
Haipeng Diao
 *ab
*ab
aDepartment of Biochemistry and Molecular Biology, Shanxi Medical University, Taiyuan 030001, P. R. China. E-mail: liuwen@sxmu.edu.cn; diaohp@sxmu.edu.cn
bCollege of Basic Medical Sciences, Shanxi Medical University, Taiyuan 030001, P. R. China. E-mail: wangbin@sxmu.edu.cn
First published on 3rd February 2022
Abstract
Recently, molecules with aggregation-induced luminescence (AIE) characteristics have received more and more attention due to the fluorescence of traditional dyes being easily quenched in the aggregated state. AIE molecules have significant advantages, such as excellent light stability, bright fluorescence, high contrast, and large Stokes shift. These characteristics have aroused wide interest of researchers and opened up new applications in many fields, especially in the field of biological applications. However, AIE molecules or their aggregates have certain limitations in multifunctional biological research due to their low specific targeting ability, poor biocompatibility, and poor stability in physiological body fluids. In order to overcome these problems, a novel nanoparticle, FFM1, was fabricated and characterized. FFM1 displayed good water solubility, biocompatibility, and AIE emission properties. It could target HeLa cells specifically by recognizing their folate receptor. Reactive oxygen triggered by light irradiation induced tumor cell apoptosis. Summarily, FFM1 displayed excellent capacity in target imaging and photodynamic killing of HeLa cells. It has shown potential application value in targeted diagnosis and photodynamic therapy of tumors, and has important guiding significance for the treatment of malignant tumors. It paves a way for the development of a novel strategy for tumor theranostics.
Introduction
In recent years, molecules with optical properties have been rapidly developed in the field of disease diagnosis and treatment. Fluorescence imaging (FI) has attracted widespread attention in disease diagnosis because of its non-invasiveness, good sensitivity, and convenient operation.1,2 Photodynamic therapy (PDT) is one light-controllable, non-invasive and highly effective anti-tumor strategy, which has attracted increasing attention from researchers as well as doctors in the past few decades. Photosensitizers (PSs) play the pivotal role in the PDT.3–7 PSs could enable tumors to be visible by fluorescence imaging (FLI), as well as kill the tumor cells by generating reactive oxygen species (ROS) with light irradiation.8–13 Hence, properties of PSs determine the efficacy of PDT in terms of diagnosis and therapeutics of tumor.14–23 So far, many organic fluorophores of PSs have been designed and developed for bioimaging.24–26 However, most of them have aggregation-caused quenching (ACQ) properties and poor photostability especially under high ROS environments,27–31 which limits their further application.Aggregation-induced emission (AIE) bearing fluorescent molecules show outstanding advantages such as excellent light stability, strong fluorescence, large stokes shift, good photophysical stability and ROS generation ability.32–36 Therefore, PSs with AIE properties are thought to be more feasible and efficient in PDT.37–42 But short emission wavelength, low signal-to-noise ratio, low targeting efficiency, poor biocompatibility, water solubility and anti-interference seriously limit their application.43,44
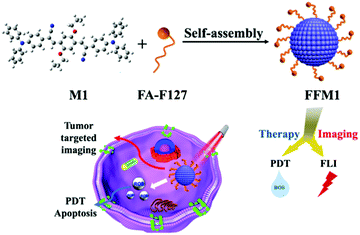
To overcome the above-mentioned obstacles, novel AIE PS was designed and synthesized in this work (Fig. 1), which showed high ROS generation efficiency and bright red fluorescence in the aggregated state. It was prepared by chemical modification and physical encapsulation with good biocompatibility and targeting ability.
Results and discussion
Synthesis and characterization
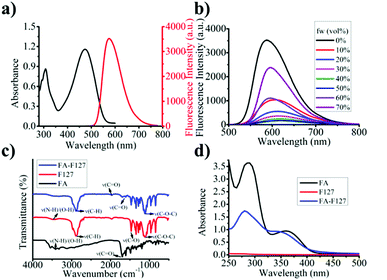
To confirm the AIE feature of M1, the AIE emission spectrum of M1 in H2O (as a poor solvent) and THF (as a good solvent) mixture were tested. As shown in Fig. 2b and S7,† M1 emitted stronger fluorescence in pure THF solution, which was due to that M1 remained locally excited (LE) state in THF. With increase of water in the solution from 10% to 50% (fw 10–50%), the fluorescence signal gradually decreased, which was due to that charge transfer (CT) states dominated the FL spectra. When large amount of water (fw > 50%) was added, the fluorescent signal of M1 was restored due to aggregation limited the solvation effect45 and intramolecular rotation.46,47 And Rhodamine 6G was selected standard (QY = 0.98), relative fluorescence quantum yields of M1 (fw 70%) and FFM1 were 0.74 and 0.43, respectively (as shown in Table S1†). Above results indicated that M1 was endowed with obvious AIE properties.
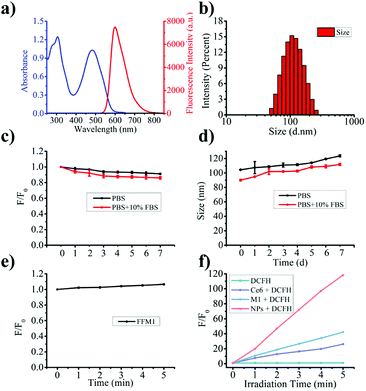
In aggregated state, the intramolecular motion of AIE molecular would be limited and prohibit energy dissipation.32,36,49,50 Therefore, AIE molecules displayed ROS generation ability in aggregate states.51 To evaluate the ROS generating capacity of FFM1, commercial ROS probe, DCFH, was adopted. Irradiated with white light for 5 min, FFM1 (1.0 μM) induced significant fluorescence increase of DCFH, which was stronger than that of Ce6 and M1 with same concentration (Fig. 3f), indicating abundant ROS generating ability of FFM1. Moreover, we employed one commercial singlet oxygen (1O2) probe, DPBF, to verify the ROS type generated by FFM1. As showed Fig. S9,† when incubated with FFM1, the absorbance of DPBF was gradually decreased with irradiation, that could indicated the ROS type generated by FFM1 was mainly 1O2. Above results suggested that FFM1 could serve as the PSs for PDT.
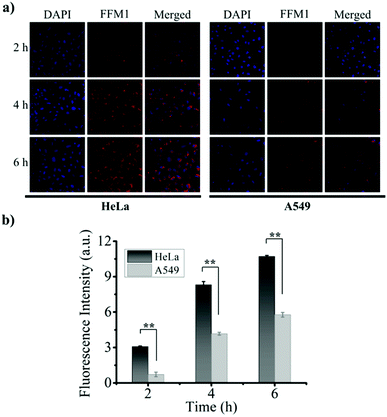
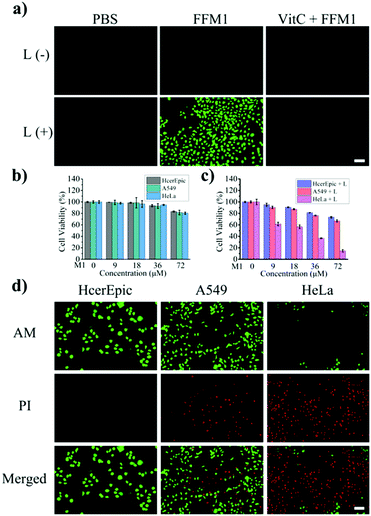
Subsequently, the ROS inducing ability of FFM1 in HeLa cells was assessed with 2′,7′-dichlorodihydrofluorescein diacetate (DCFH-DA), which was one widely adopted assay for ROS. Under white light irradiation for 10 min, HeLa cells treated with FFM1 (40 μM) showed obvious fluorescence signal (Fig. 5a), indicating high intracellular ROS induction. And with the addition of scavenger of ROS, vitamin C, the FFM1 induced fluorescence signal was diminished. Then, the anti-tumor ability of FFM1 with light irradiation was quantitatively evaluated by cells viability assay (MTT assay). In Fig. 5b, the FFM1 has low toxicity to different cells even at high concentrations (72 μM). As shown in Fig. 5c, FFM1 showed neglectable, moderate and intensive cytotoxicity under the xenon lamp irradiation in HcerEpic, A549 and HeLa cells respectively. Due to theirs surfaces high expression FR, the HeLa cells were obviously killed. To further confirm the tumor-killing ability of FFM1, three cell lines were stained with live/dead cell indicator (Calcein-AM/PI Double Stain; AM for live cells, PI for dead cells). As shown in the Fig. 5d and S12,† HeLa cells displayed the strongest red fluorescence signal, weakest green signal, while HcerEpic and A549 cells showed converse result to that of HeLa. Above results suggested that FFM1 was endowed with excellent PDT ability, strong targeted killing of HeLa tumor cells. Based on our results, FFM1 could specifically target HeLa cells with FR highly expressed. In the tumor cells, FFM1 displayed excellent fluorescence imaging ability. Moreover, with light irradiation, FFM1 triggered substantial HeLa cell apoptosis. So we proposed that FFM1 held great potential for image-guided cancer therapy in vivo.
Materials and experiment methods
Materials
Pluronic-F127, vitamin C, 3-(4,5-dimethylthiazol-2-yl)-2,5-diphenyltetrazolium bromide (MTT), and 10-carbonyldiimidazole (CDI) were obtained from Sigma-Aldrich. Folic acid was purchased from Aldrich (St. Louis, USA). Calcein AM and DAPI (4′,6-diamidino-2-phenylindole, dihydrochloride) were purchased from Beyotime. Human lung cancer cell line (A549), and human hepatoma cell (HeLa) were purchased from the Cell Bank of Chinese Academy of Sciences. High purity water was employed in all the experiments. Ultraviolet-visible absorption spectrum was monitored on a UH-5300 spectrophotometer (HITACHI, Japan). Fluorescence spectrum was recorded with a Cary Eclipse spectrofluorimeter (HITACHI, Japan). Fluorescence imaging of cells was implemented on an Eclipse Ts 2 fluorescence microscope (Nikon, Japan). Laser scanning confocal microscope (LSCM) imaging was implemented on an FV 3100-IX83 confocal laser scanning microscope (Olympus, Japan).Synthesis and characterization of M1 and Pluronic F127–folic acid complex (FA–PF127)
According to the method reported in the literature,45 M1 were synthesized by a Knoevenagel reaction, as depicted in synthetic route. 2-(4-(Diphenylamino) phenyl)-acetonitrile (0.57 g, 2.00 mmol) and 2,5-dipropoxyterephthalaldehyde (0.25 g, 1.00 mmol) in ethanol (HPLC, 40 mL) was stirred at room temperature for 5 min. Then, a little NaOMe was added and stirred for 12 h. The resulting solution (M1) was filtered and washed repeatedly with EtOH to obtain a dark red powder with a yield of 86%. 1H NMR (400 MHz, CDCl3) δ (ppm): 7.93 (s, 2H), 7.87 (s, 2H), 7.53 (m, 4H), 7.32–7.28 (t, 8H), 7.15–7.13 (d, 8H), 7.10–7.07 (m, 8H), 4.09–4.06 (t, 4H), 1.89–1.84 (t, 4H), 1.09–1.05 (t, 6H). 13C NMR (100 MHz, CDCl3) δ (ppm): 151.35, 148.83, 147.05, 133.41, 129.48, 125.16, 122.36, 118.57, 111.08, 111.01, 77.34, 77.02, 76.71, 70.75, 22.60, 10.73.Then, according to the method reported in the literature,57 87.56 mg (0.20 mmol) FA were dissolved in dry DMSO (3 mL) and added to the round bottom flask. Then, 35.34 mg (0.22 mmol) CDI was added, and the mixture was stirred at room temperature in the dark for one day. 0.62 g (0.05 mmol) of PF127 was added to the above solution, which had been dried overnight in a vacuum. The reaction was allowed to proceed in the dark at room temperature for 1 day. The reaction mixture was dialyzed (MWCO: 1000 Da) with double deionized (DD) water for 3 days, and the water was changed every 3–6 hours. FA–PF127 is recovered by freeze-drying. The resulting product was dried in a vacuum oven for 2 days, with a yield of 53%. The product was stored in a desiccator for the next step.
Synthesis of FFM1 nanoparticles M1
(1.00 mg) and FA–F127 (8.00 mg) were dissolved in THF (1.00 mL) solvent to form a mixture solution under sonication. Then the mixture was quickly dropped into deionized water (10 mL) and sonicated for 5 min. Next, nitrogen was blown for 3–4 h to remove THF. After that, the deionized water was dialyzed for 24 hours with a dialysis tube (MWCO: 3500 Da). During the dialysis process, fresh deionized water was used to replace deionized water approximately every 4 times to completely remove THF and unencapsulated MTB-PCBZ molecules. The final solution was concentrated by ultrafiltration before use. The concentration of FFM1 NPs is calculated based on the measured standard curve of M1(Fig. S6†).In vitro photophysical and photodynamic properties of FFM1
The photodynamic properties of the nanoparticles were detected by the commercial reactive oxygen probe DCFH-DA. The fluorescence of DCFH-DA at 530 nm was continuously enhanced after the combination of DCFH-DA and reactive oxygen species. Based on this, the photodynamic properties of the nanoparticles were evaluated. First, activate DCFH-DA with 10 mM NaOH, added FFM1 NPs (1.00 μM) to the activated DCFH-DA (1 nM), and then irradiated the reaction solution with a xenon lamp (10 mW cm−2) for a certain period of time and observed the fluorescence change at 530 nm.Confocal imaging of cells
Inoculated HeLa, A549, HcerEpic cells in a laser confocal dish for culture, and incubated for 24 hours. Then, the culture medium was removed and washed with PBS (pH 7.4). For determining FA-mediated specific binding, cells were pretreated with 1.0 mg mL−1 FA solution for 30 min before adding NPs. FFM1 NPs (40 μM) were added to each dish, and incubated in a 37 °C, 5% CO2 incubator 2, 4, 6 h, respectively. The nanoparticles were then removed and washed with PBS (pH 7.4), and then treated with 1 mL of 3.7% formaldehyde in PBS solution, and allowed to stand at room temperature for 30 min. After washing 3 times with PBS, incubate with 0.5 mL/dish DAPI at 37 °C for 10 minutes. The specific imaging conditions are as follows: the excitation wavelength is 488 nm, and the collection range of emission wavelength is 600–700 nm.Cell cytotoxicity
HeLa, A549, and HcerEpic cells were seeded in a 96-well plate at a density of 8000–10![[thin space (1/6-em)]](https://www.rsc.org/images/entities/char_2009.gif) 000 cells per well and added to DMEM medium containing 10% FBS. After 24 h, wash with PBS for 2–3 times, then add FFM1 NPs of different concentrations (0–72 μM) to the wells according to the needs of the experiment. After incubating for 24 hours, wash with PBS for 2–3 times, and then 100 μL MTT solution (0.5 mg mL−1) was added to each well, continue to incubate for 4 h, then discarded MTT, wash 2–3 times with PBS, added 150 μL of DMSO, and measured the absorbance at 490 nm with a microplate reader to evaluate cytotoxicity.
000 cells per well and added to DMEM medium containing 10% FBS. After 24 h, wash with PBS for 2–3 times, then add FFM1 NPs of different concentrations (0–72 μM) to the wells according to the needs of the experiment. After incubating for 24 hours, wash with PBS for 2–3 times, and then 100 μL MTT solution (0.5 mg mL−1) was added to each well, continue to incubate for 4 h, then discarded MTT, wash 2–3 times with PBS, added 150 μL of DMSO, and measured the absorbance at 490 nm with a microplate reader to evaluate cytotoxicity.
AM/PI staining in cells
Inoculated HeLa cells in a six-well plate, added FFM1 NPs (40 μM) and incubated for 6 h after the cells adhere to the wall. After washing with PBS, the illumination group was irradiated with xenon lamp (100 mW cm−2) for 10 min, and the control group was not illuminated. Then, commercial Calcein-AM and PI reagents were added separately, and continue to avoid light for 30 min, observed and took pictures under Nikon ECLIPSE Ts2.Cell reactive oxygen detection
DCFH-DA, the commercial ROS probe, was used to evaluate the level of ROS produced by FFM1 NPs at the cellular level. HeLa cells were cultured in a six-well plate, 24 hours later cells were incubated with FFM1 NPs (40 μM) for 6 hours. The medium was removed and washed with PBS. Then, after irradiation with xenon lamp (100 mW cm−2) for 10 min, DCFH-DA was added. After 20 minutes, fluorescence pictures were obtained under Nikon ECLIPSE Ts2. To clarify the DCFH-DA fluorescence signal was derived from ROS, we added the ROS scavenger, VitC (10 μg mL−1), and pictures were took as before mentioned.Conclusions
In summary, one novel PDT agent, FFM1, was designed and synthesized. FFM1 had good stability and biocompatibility. FFM1 could target FA receptor expression tumor cells and efficiently induced tumor cell apoptosis by generating ROS. Present study paved ways for the development of multifunctional PSs and improvement of efficacy of PDT especially in FA receptor bearing tumor.Conflicts of interest
There are no conflicts to declare.Acknowledgements
This work was supported by the National Nature Science Foundation of China (Nos. 21705104, 51802180 and 82071969), the Science Foundation of Shanxi Province (Nos. 20210302124341, 20210302123294, 20210302123299 and 201901D111191); and the Startup Foundation for Doctors of Shanxi Medical University (No. BS201723).Notes and references
- S. F. Gan, J. Zhou and T. A. Smith, et al., Mater. Chem. Front., 2017, 1, 2554–2558 RSC.
- Y. J. Wang, X. J. Sun and Y. Chang, et al., Biomater. Sci., 2021, 9, 4662–4670 RSC.
- D. Dolmans, D. Fukumura and R. Jain, Nat. Rev. Ca., 2003, 3, 380–387 CrossRef CAS PubMed.
- M. M. S. Lee, D. Yan and J. H. C. Chau, et al., Biomaterials, 2020, 261, 120340 CrossRef CAS PubMed.
- Z. Zhou, J. Song and L. Nie, et al., Chem. Soc. Rev., 2016, 45, 6597–6626 RSC.
- H. M. Chen, W. Z. Zhang and G. Z. Zhu, et al., Nat. Rev. Mater., 2017, 2, 17024 CrossRef CAS PubMed.
- G. Q. Zhang, N. Wang and H. F. Sun, et al., Biomater. Sci., 2021, 9, 6940–6949 RSC.
- C. C. Chang, M. C. Hsieh and J. C. Lin, et al., Biomaterials, 2012, 33, 897–906 CrossRef CAS PubMed.
- Q. Pei, X. Hu and X. Zheng, et al., ACS Nano, 2018, 12, 1630–1641 CrossRef CAS PubMed.
- X. H. Zheng, L. Wang and S. Liu, et al., Adv. Funct. Mater., 2018, 28, 1706507 CrossRef.
- H. He, X. Zheng and S. Liu, et al., Nanoscale, 2018, 10, 10991–10998 RSC.
- Z. M. Yang, Z. J. Zhang and Z. Q. Lei, et al., ACS Nano, 2021, 15, 7328–7339 CrossRef CAS PubMed.
- C. Sun, S. Ji and F. Li, et al., ACS Appl. Mater. Inter., 2017, 9, 12924–12929 CrossRef CAS PubMed.
- Z. H. Hu, C. Fang and B. Li, et al., Nat. Biomed. Eng., 2020, 4, 259–271 CrossRef PubMed.
- Y. Fang, J. Z. Shang and D. K. Liu, et al., J. Am. Chem. Soc., 2020, 142, 15271–15275 CrossRef CAS PubMed.
- Y. C. Tsai, P. Vijayaraghavan and W. H. Chiang, et al., Theranostics, 2018, 8, 1435–1448 CrossRef CAS PubMed.
- R. Q. Yan, Y. X. Hu and F. Liu, et al., J. Am. Chem. Soc., 2019, 141, 10331–10341 CrossRef CAS PubMed.
- N. Dinjaski, S. Suri and J. Valle, et al., Acta Biomater., 2014, 10, 2935–2944 CrossRef CAS PubMed.
- B. Zhu, L. Wu and Y. Wang, et al., Sens. Actuators, B, 2018, 259, 797–802 CrossRef CAS.
- F. Xia, W. Hou and C. Zhang, et al., Acta Biomater., 2018, 68, 308–319 CrossRef CAS PubMed.
- H. Zhu, J. Li and X. Qi, et al., Nano Lett., 2018, 18, 586–594 CrossRef CAS PubMed.
- J. V. Jokerst and S. S. Gambhir, Acc. Chem. Res., 2011, 44, 1050–1060 CrossRef CAS PubMed.
- J. Zhou, Z. Liu and F. Li, Chem. Soc. Rev., 2012, 41, 1323–1349 RSC.
- Q. Chen, Q. Yu and Y. Liu, et al., Nanomedicine, 2015, 11, 1773–1784 CrossRef CAS PubMed.
- J. G. Huang, L. Y. Yan and J. C. Li, et al., Angew. Chem., Int. Ed., 2019, 131, 17960–17968 CrossRef.
- M. Gao, F. Yu and C. Lv, et al., Chem. Soc. Rev., 2017, 46, 2237–2271 RSC.
- S. Singh, A. Aggarwal and N. Bhupathiraju, et al., Chem. Rev., 2015, 115, 10261–10306 CrossRef CAS PubMed.
- D. Y. Yan, W. Xie and J. Y. Zhang, et al., Angew. Chem., Int. Ed., 2021, 60, 2–10 CrossRef.
- X. Li, S. Lee and J. Yoon, Chem. Soc. Rev., 2018, 47, 1174–1188 RSC.
- Y. Shen, A. J. Shuhendler and D. Ye, et al., Chem. Soc. Rev., 2016, 45, 6725–6741 RSC.
- W. Fan, P. Huang and X. Chen, Chem. Soc. Rev., 2016, 45, 6488–6519 RSC.
- Z. Zhao, H. K. Zhang and J. W. Y. Lam, et al., Angew. Chem., Int. Ed., 2020, 59, 9888–9907 CrossRef CAS PubMed.
- C. Y. Lv, W. W. Liu and Q. Luo, et al., Chem. Sci., 2020, 11, 4007–4015 RSC.
- X. L. Cai and B. Liu, Angew. Chem., Int. Ed., 2020, 132, 9952–9970 CrossRef.
- S. Kim, J. Kim and B. Jana, et al., RSC Adv., 2020, 10, 43383–43388 RSC.
- X. Gu, R. Kwok and J. Lam, et al., Biomaterials, 2017, 146, 115–135 CrossRef CAS PubMed.
- W. Wu, D. Mao and F. Hu, et al., Adv. Mater., 2017, 29, 1700548 CrossRef PubMed.
- B. Gu, W. Wu and G. Xu, et al., Adv. Mater., 2017, 29, 1701076 CrossRef PubMed.
- J. Qi, C. Chen and X. Zhang, et al., Nat. Commun., 2018, 9, 1848 CrossRef PubMed.
- W. Shao, C. Yang and F. Y. Li, et al., Nano-Micro Lett., 2020, 12, 147 CrossRef CAS PubMed.
- W. Han, S. Zhang and R. Deng, et al., Sci. China Mater., 2020, 63, 136–146 CrossRef CAS.
- Z. M. Yang, Z. J. Zhang and Y. Q. Sun, et al., Biomaterials, 2021, 275, 120934 CrossRef CAS PubMed.
- S. J. Chen, H. Wang and Y. Hong, et al., Mater. Horiz., 2016, 3, 283–293 RSC.
- J. L. Geng, K. Li and D. Ding, et al., Small, 2012, 8, 3655–3663 CrossRef CAS PubMed.
- C. F. Zhu, C. J. Li and L. Wen, et al., New J. Chem., 2021, 45, 12895–12901 RSC.
- B. Xu, Z. Chi and H. Li, et al., J. Phys. Chem. C, 2011, 115, 17574–17581 CrossRef CAS.
- Y. Li, S. Liu and H. Ni, et al., Angew. Chem., Int. Ed., 2020, 59, 12822–12826 CrossRef CAS PubMed.
- G. Kibria, H. Hatakeyama and Y. Sato, et al., Int. J. Pharm., 2016, 509, 178–187 CrossRef CAS PubMed.
- F. Hu, S. Xu and B. Liu, Adv. Mater., 2018, 30, 1801350 CrossRef PubMed.
- M. Gao and B. Z. Tang, Coord. Chem. Rev., 2020, 402, 213076 CrossRef CAS.
- C. Chen, X. Ni and H. W. Tian, et al., Angew. Chem., Int. Ed., 2020, 59, 10008–10012 CrossRef CAS PubMed.
- Y. G. Assaraf, C. P. Leamon and J. A. Reddy, Drug. Resist. Updat., 2014, 17, 89–95 CrossRef PubMed.
- J. A. Ledermann, S. Canevari and T. Thigpen, Ann. Oncol., 2015, 26, 2034–2043 CrossRef CAS PubMed.
- M. Yang, J. Deng and D. Guo, et al., Org. Biomol. Chem., 2019, 17, 5367–5374 RSC.
- B. Demir, F. B. Barlas and Z. P. Gumus, et al., ACS Appl. Nano Mater., 2018, 1, 2827–2835 CrossRef CAS.
- J. M. Xia, X. Wei and X. W. Chen, et al., Microchim. Acta, 2018, 185, 205 CrossRef PubMed.
- J. Y. Lin, J. S. Chen and S. J. Huang, et al., Biomaterials, 2009, 30, 5114–5124 CrossRef CAS PubMed.
Footnotes |
| † Electronic supplementary information (ESI) available. See DOI: 10.1039/d1ra09173e |
| ‡ The authors contributed equally to this work. |
| This journal is © The Royal Society of Chemistry 2022 |

