DOI:
10.1039/D1RA09147F
(Paper)
RSC Adv., 2022,
12, 6265-6278
RSM, ANN-GA and ANN-PSO modeling of SDBS removal from greywater in rural areas via Fe2O3-coated volcanic rocks†
Received
18th December 2021
, Accepted 15th February 2022
First published on 23rd February 2022
Abstract
Decontamination and reuse of greywater in rural areas has attracted increasing attention. Typical contaminants in grey water are SDBS, which has a stubborn molecular structure. In this study, Fe2O3-coated volcanic rocks (Fe2O3-VR) prepared from FeCl3 solution by a heating evaporation method can reach 95% removal of SDBS, which is 80% higher than before. The effect of contact time, pH, initial concentration, FeCl3 solution concentration, adsorbent dosage and calcination temperature on the removal rate was researched and modeled by response methodology (RSM) and artificial neural network (ANN). Based on the univariate test, the Box-Behnken design method was used to establish the data sample, which represented a quadratic polynomial model with p-value <0.001, R2 = 0.9872, while the ANN model has the better performance with R2 = 0.9961. The weights of the BP-ANN model were further analyzed using the Garson equation, and the results showed that the validity ranking of the variables was as follows: contact time (37.31%) > calcination temperature (29.43%) > dosage (24.44%) > initial concentration (17.18%) > FeCl3 solution concentration (17.18%) > pH (11.56%). Genetic algorithm (GA) and particle swarm optimization (PSO) were selected to optimize the process parameters. The results showed that ANN-PSO methodology presented a satisfactory alternative and the predicted removal efficiency was 99.9982% with relative error = 0.2230. The optimum level of contact time, pH, initial SDBS concentration, FeCl3 solution concentration, adsorbent dosage and calcination temperature is 136.45 min, 5.64, 22.4 mg L−1, 0.3 mol L−1, 83.21 g L−1, 274.02 °C, respectively. Moreover, Fe2O3-VR was characterized via instrumental analyses (SEM-EDS, FTIR, XRD, BET).
1. Introduction
Water is a vital resource for life on Earth and is closely related to human health and a sustainable development concept.1 SDG 6 aims to ensure that water and sanitation are accessible and sustainably managed for all.2 At present, the water pollution situation is still critical, with many children dying every day from contaminated water and a lot of people still without access to safe drinking water and lacking sanitation facilities.3 In recent years, freshwater resources are facing continuous depletion accompanied by the expansion of intensive urbanization, population growth, and frequent economic activities. Therefore, domestic wastewater treatment and reuse are becoming an important field of research, especially in rural areas. According to investigation, 80% of people lacking clean water and 70% of people lacking sanitation lived in rural areas in 2017.4 In this case, greywater treatment has received a lot of attention as a worthy method for wastewater recycling and reuse in recent years.5 Greywater refers to wastewater produced by households, including effluents from laundries, baths and showers but excluding the toilet wastewater (black water). This kind of wastewater represents 50%–80% of domestic wastewater, which has a relatively content of contaminant.6
Greywater contains a lot of surfactants. It is mainly due to the widespread use of detergents.7 On a whole, ionic surfactants account for the largest proportion of all surfactants used all over the world. Approximately 60% of surfactants produced are linear alkylbenzene sulfonates (LAS).8 The most common is SDBS, which is known for stubborn molecular structure. Excessive use of SDBS can be harmful to human beings and the ecological environment. For example, it can cause blistering and toxicity in water, which makes the water quality bad, affects the survival of aquatic organisms and hinders the self-purification of water bodies. In addition, it may stay in the environment for a length of time because of its difficult biodegradability. The concentration range of LAS in household greywater is 1–10 mg L−1, and many environmental regulators authorities limit anionic surfactants to 0.5 mg L−1. Therefore, surfactant removal treatment of wastewater in advance of reuse is essential.
In response to large molecules like SDBS, such as organic dyes, both adsorption9–12 and composite photodegradation methods13–15 have been investigated. The same approaches have also been applied in SDBS removal research. In general, adsorption is the foremost separation method because of its feasibility, low cost, and simplicity of operation. Many adsorbents including activated carbon,16 zeolites,17 chitosan,18 mesoporous silica nanoparticles19 and fly ash based geopolymer20 have been used for SDBS removal from wastewater. In recent years, volcanic rocks (VR) have also been widely used in effluent disposal. Which is due to the superior performance of VR such as high porosity and low cost. However, since VR has a minus charged surface,21 the adsorption capacity of SDBS is not very good. Intriguingly, the adsorption properties of SDBS can be improved by surface modification.22 In this study, a method of VR modification using ferric chloride solution was proposed and its employment in the removal of SDBS from greywater was investigated.
During the adsorption process, removal efficiency is a key indicator, which is affected by many parameters. Due to the difficulty in analyzing the influence degree of each parameter on the removal efficiency under laboratory operating conditions, a mathematical model is needed.23 Presently, RSM and ANN are chosen as powerful tools for modeling and optimization of wastewater treatment. RSM as a statistical method is widely used for evaluating the individual and interaction effects of input variables.24 The optimal results of RSM are obtained through fitting the function relation between each factor in the global scope by regression. Box–Behnken design (BBD) was selected for this study because this option needs only 3 levels, while central composite design (CCD) requires 5 levels. It has the important advantage of taking into account experimental random errors and the simplicity of calculations with the resulting model.25
ANN is an artificial intelligence (AI) technique which is based on the bionic principle.26 In addition to input layer and output layer, neural network structure also includes hidden layer, the number of which is usually determined by trial and error method. By adjusting or training neural networks, a specific input can produce a specific target output.27 ANN has been widely used in complex systems because of its exceptional ability in simulating nonlinear changes between the variables and response by iterative training process. ANN compares the response of input data set to target values and corrects the deviated response through modification of internal weights.28 ANN has a higher predictive power compared with RSM, which is only applied to quadratic estimation. However, it has the drawback that the solution cannot guarantee the global optimal solution.29 Therefore, appropriate optimization methods such as GA and PSO can be applied to overcome the demerits of ANN by optimizing the local optimum.30
In the present study, Fe2O3-coated volcanic rocks (Fe2O3-VR) were prepared by heating evaporation method. The purpose of this paper is to examine the removal rate of SDBS on Fe2O3-VR. The collected experimental data were modeled by RSM and ANN methods. The RSM with BBD was used to obtain a mathematical model to predict the efficiency of SDBS removal and the correlation between SDBS removal and five input variables namely, contact time, pH, initial concentration, FeCl3 solution concentration, adsorbent dosage, and calcination temperature. GA and PSO were selected to optimize the operating conditions to determine the maximum SDBS removal efficiency. In contrast, PSO is better than GA in predicting SDBS removal efficiency. Moreover, Fe2O3-VR was characterized via instrumental analyses (SEM-EDS, FTIR, XRD, BET). The adsorption isotherm and kinetics of the process were also studied.
2. Materials and methods
2.1 Materials
Volcanic rocks were purchased from Chifeng Xindi Basalt Co., Ltd., Inner Mongolia, which has its own mine. Aqueous solutions were prepared by DI water. All chemicals used were analytically pure (Text S1).
2.2 Preparation of Fe2O3-coated volcanic rocks (Fe2O3-VR)
The preparation of Fe-coated volcanic rocks was illustrated in Text S2.†
2.3 Characterization
The characterization of Fe2O3-coated volcanic rocks (Fe2O3-VR) was described in Text S3.†
2.4 Batch adsorption experiments
The experiments were carried out in 250 ml conical flasks, which was shaken in a constant-temperature shaker (Guohua Electric Appliance Co. Ltd., THZ-82, Changzhou, China) at 150 rpm for 3 h. Batch experiments were carried out to examine the effect of contact time (5–180 min), initial SDBS concentration (10–90 mg L−1), pH (2–10), FeCl3 solution concentration (0.05–0.3 mol L−1), adsorbent dosage (10–110 g L−1) and calcination temperature (200–600 °C) on the removal rate of SDBS. Adjusted the pH with 0.1 mol L−1 HCl or 0.1 mol L−1 NaOH. The samples extracted during the experiment were filtered through 0.45 μm poly tetra fluoroethylene (PTFE) filter (Anpel Co. Ltd., Shanghai, China) to remove suspensions. Anionic surfactants were determined by methylene blue spectrophotometry. Experiments were carried out at room temperature. The adsorption capacity and removal efficiency were expressed as follows:| |
 | (1) |
| |
 | (2) |
where R, qt (mg g−1) are the removal rate and adsorption amount of SDBS, respectively. C0 (mg L−1) and Ct (mg L−1) are the concentrations at time 0 and t, respectively. V (L) is the volume of the solution, and m (g) is the mass of adsorbent.
2.5 Experimental design
2.5.1 Response surface methodology. The adsorption process is influenced by a variety of factors, but to varying degrees, and is sensitive to a few factors. RSM is a statistical method based on the experimental design to quantify each variable and obtain a simple mathematical model to describe the unknown relationship between variables.31 The method qualitatively compares the sensitivities between multiple variables and determines the optimal value of each variable, resulting in a second-order polynomial. In the present work, the experiment design of BBD-RSM was completed by using Design-Expert 10 software, so as to examine the effect of different variables on SDBS removal efficiency and obtain an accurate model to forecast the removal efficiency. The obtained quadratic model is shown in the following equation:| | |
Y = α0 + α1A + α2B − α3C + α4D + α5E + α6F + α12AB − α13AC + α14AD + α15AE + α16AF − α23BC − α24BD + α25BE + α26BF − α34CD + α35CE + α36CF − α45DE + α46DF − α56EF − α11A2 − α22B2 − α33C2 − α44D2 − α55E2 + α66F2
| (3) |
where Y expresses the removal efficiency of SDBS; α0 represents a constant offset term; αi and αij indicate the estimated coefficients; A, B, C, D denote independent variables.In this study, six factors (contact time, pH, initial concentration, FeCl3 solution concentration, adsorbent dosage and calcination temperature) were considered in experiments with three coded levels (−1, 0, +1). The variables and the levels in this study are shown in Table S2.†
2.5.2 BP-ANN modeling. In the present study, a three-layer backpropagation ANN was applied. Its hidden layer neuron function is S type function, which is a nonlinear mapping relationship between input and output by adjusting the network power threshold. BP-ANN was composed of input layers, hidden layers (neurons), and output layer, which was shown in Fig. 1.
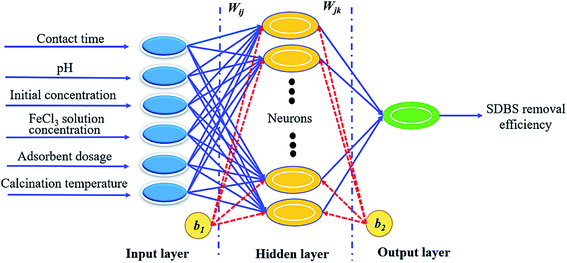 |
| | Fig. 1 The ANN structure. | |
There were 54 sets of experiments, 80% of which were used for training, 10% for testing, and 10% for validation sets.
Therefore, it contains 44, 5 and 5 samples for training, testing and validation subsets, respectively. Pay attention to monitor the error of validation data throughout the training process to avoid over-fitting.32
Normalization is helpful to accelerate the convergence of the training network to avoid overflow of values due to too large or too small weights. Therefore, the input and output parameters were normalized to 0–1 by the following equation:
| |
 | (4) |
where
Xi stands for normalized values, and
X,
Xmin, and
Xmax are the original, minimum, and maximum values of variables, respectively.
24 The number of hidden layer neurons is used as a design factor of the model since their substantial impact on the performance of the network. It was determined by mean square error (MSE) and correlation coefficient (
R2) among 1–15 neurons. Each topology is repeated ten times to avoid randomness and coincidence. MSE and
R2 can be defined as follows:
| |
 | (5) |
| |
 | (6) |
where
n is the number of data points,
yi,pred and
yi,exp are the predicted and experimental values of responses, respectively, and
yavg, exp is the average experimental values.
2.5.3 Genetic algorithms. Genetic algorithm (GA) searches for optimal solutions by simulating natural genetic mechanisms and biological evolution. GA can be applied to various optimization problems because of its adaptability, at the same time, it can be used to search the entire solution space to obtain the optimal condition.33 The optimization efficiency and results are not affected by the initial structure, and the crossover and mutation operations avoid the GA from falling into local extrema. In this study, the initial population was 50 individuals, which were created by the uniform creation function and evaluated by the fitness values obtained from the ANN model. Then low fitness chromosomes were eliminated, and the rest were subjected to select, cross and mutate until a suitable result is obtained.34 This procedure was carried out for 300 generations.
2.5.4 Particle swarm optimization (PSO). Amongst the different artificial intelligent techniques, PSO is an optimization algorithm inspired by birds' behavior.35 Each solution is called a particle, which has a major part in the optimization problems. In the PSO, it treats the position of each particle location as an objective function, and then by calculating the objective function value of each particle, the personal optimal value and the global optimal value so far are selected. PSO is performed iteratively. The optimal position of each particle and the optimal position of the population are stored and updated in each iteration, so the essence of the PSO algorithm is to use the motion experience during the iteration to optimize the solution.36 Currently, there exists a great practical application of PSO.
3. Results and discussion
3.1 Characterization of VR and Fe2O3-VR
3.1.1 SEM-EDX analysis. The FE-SEM and EDX images are shown in Fig. S1 and S2.† The SEM images of VR showed ordered silica crystals and micropores or roughness with small slits at its surface. From Fig. S1a and b,† the surface of VR was smooth, and after being modified with FeCl3 the surface of VR became rough and formed a porous network, which means a homogeneous distribution of Fe2O3 nanoparticles successfully coated. The elemental composition obtained from the EDX analysis is shown in Table 1. It indicated that the Si and O as major elements of both materials and the iron content increased a lot in particular after modification. After coating, the content of O was significantly reduced and the content of Fe was observed to increase from 8.90% to 37.78%, which represents that the Fe2O3 was successfully added to the VR.
Table 1 Elemental composition (by wt%) of VR and Fe2O3-VR
| Elements |
C |
O |
Na |
Mg |
Al |
Si |
Ca |
Fe |
| VR |
2.22 |
45.92 |
3.73 |
2.47 |
7.07 |
21.03 |
8.67 |
8.90 |
| Fe2O3-VR |
6.83 |
33.17 |
0.33 |
1.80 |
1.13 |
13.94 |
5.02 |
37.78 |
3.1.2 FTIR analysis. The FTIR image of the VR and Fe2O3-VR is shown in Fig. 2(a). The broad peak around 3450 cm−1 is contributed to the extension vibration of H2O molecules (moisture) in the lattice and –OH groups. The bands located at 2981 cm−1 and 2896 cm−1 were ascribed to the stretching vibration of C–H.37 Because of the symmetric stretching vibration of Si–O–Si, the absorption band at 1056 cm−1 can be assigned to the characteristic peak of (SiO4)2− groups. Combined with the energy spectrum, it can be seen that SiO2 is the pillar structure of volcanic rock, while SDBS has adsorption behavior on SiO2.38 The Si–O–Al stretching vibration was registered at around 785 cm−1 for VR and Fe2O3-VR and showed that the Si–O–Al framework remained undistorted after modification.39 Moreover, a new peak at 642 cm−1 was distributed to the Fe–O group of Fe2O3 after modification, indicating that Fe2O3 was attached to the VR.
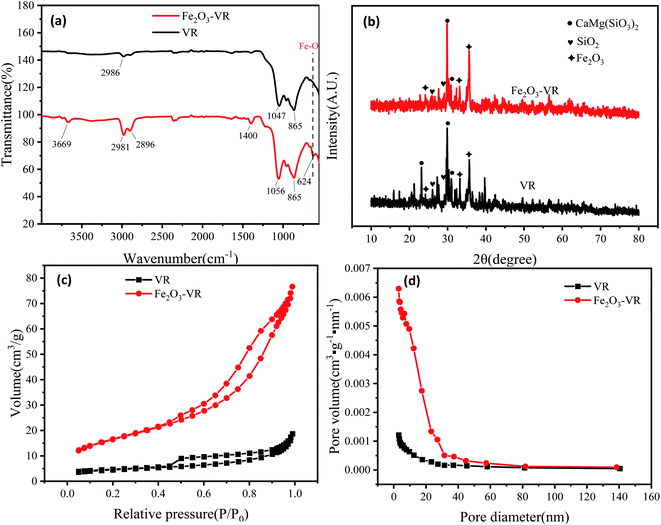 |
| | Fig. 2 (a) FTIR spectrum of VR and Fe2O3-VR, (b) XRD patterns of VR and Fe2O3-VR, (c) N2 adsorption–desorption isotherms and (d) pore size distribution. | |
3.1.3 X-ray diffraction analysis. Fig. 2(b) shows the XRD image of the VR and Fe2O3-VR adsorbents. The two samples exhibited similar morphologies, indicating that the modification process did not significantly affect the structural framework of the samples. While the presents of crystalline phases in the VR and Fe2O3-VR samples can be determined by the peaks at 2θ = 23.1°, 23.8°, 25.9°, 29.1°, 29.8°, 30.9°, 32.8°, and 35.6°. The crystal structure is mainly composed of pyroxene (CaMg(SiO3)2, JCPDS 75-1577) and SiO2 (JCPDS 83-1830). After modification, the peak of hematite (Fe2O3, JCPDS 73-0603) became sharper, indicating that Fe2O3 was absorbed onto the VR. On the whole, the crystallization degree of Fe2O3-VR is much lower than that of VR. The original regular crystal structure of VR was likely broken due to the addition of metals in the modification process. According to the study of Lenoble et al.,40 the lower the degree of crystallization of minerals, the more conducive to adsorption, which results in an increase in the removal rate of SDBS after modification.
3.1.4 BET surface area. N2 adsorption–desorption isotherms are shown in Fig. 2(c). According to the International Union of Pure and Applied Chemistry (IUPAC) classification, the physisorption isotherms of VR and Fe2O3-VR are classified as Type IV with H3 shaped hysteresis loops. This indicated the presence of mesoporous structures and slit-shaped pores in the VR and Fe2O3-VR. The pore volume of the Fe2O3-VR increased, which was most likely due to the increase of the mesopores volume. Due to the comparatively high molecular weight of SDBS (349 g mol−1), the migration rate of SDBS to VR particles is slow,41 while more mesopores are more favorable for the adsorption of SDBS on Fe2O3-VR. Meanwhile, the adsorption capacity of these two adsorbents quickly increased when the absolute pressure (P/P0) was >0.80, which might be a reason for multilayer adsorption.42Fig. 2(d) showed that the pore diameter ranges from 0–140 nm. The pore structure of VR and Fe2O3-VR are listed in Table 2. The specific surface area, pore volume and average pore radius of the VR were 7.084 m2 g−1, 7.88 m3 g−1 and 19.6 nm, while the Fe2O3-VR were 29.374 m2 g−1, 3.23 m3 g−1 and 21.76 nm. Compared with previous values, the specific surface area is much larger. This is because of the removal of substances clogging the pores of the VR and adhesion of Fe2O3 particles on the surface of VR.
Table 2 Characteristics of porous structure of VR and Fe2O3-VR
| Samples |
SBET (m2 g−1) |
VT (nm) |
Dp (cm3 g−1) |
| VR |
7.084 |
7.21 |
0.029 |
| Fe2O3-VR |
29.374 |
8.01 |
0.119 |
3.1.5 VSM analysis. The hysteresis lines demonstrated that VR was not magnetic material. There was no significant hysteresis in the curves, indicating that they were paramagnetic materials, and the remanence and coercivity were almost zero. Moreover, the saturation magnetization strength of Fe2O3-VR was 4.98 emu g−1, which might be due to the small number of Fe3O4 produced during the modification process (Fig. 3).
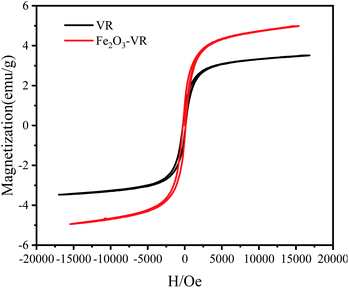 |
| | Fig. 3 VSM pattern of VR and Fe2O3-VR. | |
3.2 Adsorption kinetics and isotherm
3.2.1 Adsorption kinetics. The adsorption rate can be determined by adsorption kinetics. Fig. 4(a) shows the trend of removal efficiency and adsorption capacity with the time of Fe2O3-VR and VR towards SDBS.
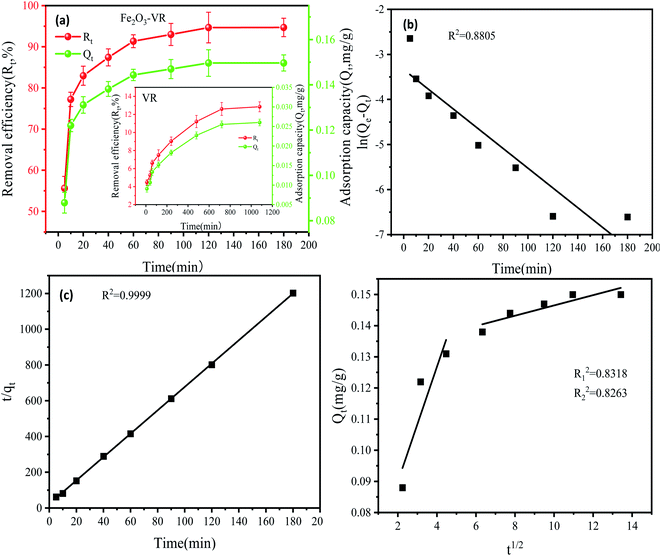 |
| | Fig. 4 (a) Effects of contact time on adsorption efficiency (Rt) and capacity (Qt) of Fe2O3-VR and VR towards SDBS; fitting plots of Fe2O3-VR of (b) pseudo first order, (c) pseudo second order and (d) intra particle diffusion kinetic models (reaction parameters: FeCl3 solution concentration: 0.25 mol L−1, Fe2O3-VR load: 50 g L−1, initial SDBS concentration: 8 mg L−1, pH = 7). | |
After modification, the removal efficiency of SDBS increased by more than 80% and can reach 95%. In the first 60 min, the adsorption efficiency and capacity of Fe2O3-VR for SDBS increased rapidly. Then the adsorption rate gradually slowed down and reached equilibrium at 180 min. A great number of active loci and larger driving power might be the reason for rapid adsorption in the beginning.43
The fitting parameters and errors of the adsorption kinetic models were shown in Table 3. It can be revealed from the R2 value that the adsorption kinetics behavior was fitted to a pseudo-second-order model (0.9999) more favorably compared to the pseudo-first-order model (0.8805) and intra-particle diffusion model (0.8263), which suggested that the adsorption was linked to chemical processes.
Table 3 Parameters of the kinetics of SDBS adsorption on Fe2O3-VR
| Kinetic models |
Parameters |
|
| Pseudo-first-order |
Qe (mg g−1) |
0.036 |
| k1 (min−1) |
0.022 |
| R2 |
0.8805 |
| Pseudo-second-order |
Qe (mg g−1) |
0.153 |
| k2 (min−1) |
1.813 |
| R2 |
0.9999 |
| Intra-particle diffusion |
kp1 (mg g−1 min−0.5) |
0.018 |
| D1 |
0.053 |
| R12 |
0.8318 |
| kp2 (mg g−1 min−0.5) |
0.002 |
| D1 |
0.13 |
| R12 |
0.8263 |
3.2.2 Adsorption isotherm. The fitted adsorption isotherm models used are shown in Fig. 5. The fitting parameters of the adsorption isotherm models were presented in Table 4. The correlation coefficient of the Freundlich, Langmuir, Temkin, and Dubinin–Radushkevich model were 0.9878, 0.9763, 0.9027 and 0.8154, respectively, illustrating that the adsorption was more consistent with the Freundlich model. Thus, the adsorption behavior of SDBS on Fe2O3-VR was confirmed for multilayer adsorption.44 At the same time, 1/n = 0.715 < 1 in the Freundlich model, which revealed that the adsorption process of Fe2O3-VR for SDBS was spontaneous.45 In addition, in the Langmuir model, the value of KL was between 0 and 1 indicating that the adsorption is favorable. In the D–R model, E <8 kJ mol−1, indicating that the adsorption process was physical adsorption.46
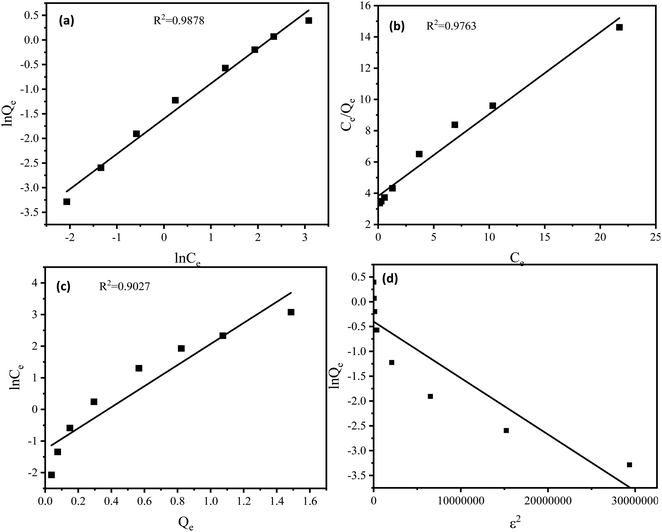 |
| | Fig. 5 Fitting plots of (a) Freundlich, (b) Langmuir, (c) Temkin and (d) Dubinin–Radushkevich isotherm models for the adsorption of SDBS onto Fe2O3-VR (reaction parameters: FeCl3 solution concentration: 0.25 mol L−1, Fe2O3-VR load: 50 g L−1, initial SDBS concentration: 8 mg L−1, pH = 7, contact time: 180 min). | |
Table 4 Parameters of the isotherm of SDBS adsorption on Fe2O3-VR
| Isotherm models |
Parameters |
|
| Langmuir |
Qmax (mg g−1) |
1.908 |
| KL |
0.138 |
| R2 |
0.9763 |
| Freundlich |
KF |
0.202 |
| 1/n |
0.715 |
| R2 |
0.9878 |
| Temkin |
AT |
−1.264 |
| BT |
3.333 |
| R2 |
0.9027 |
| Dubinin–Radushkevich |
Qmax (mg g−1) |
0.6698 |
| E (kJ mol−1) |
2.0978 |
| R2 |
0.8154 |
3.3 RSM modeling and optimization
In this paper, the BBD method was performed to examine the adsorption conditions of SDBS. The experiment was fitted according to the second-order model of polynomial regression analysis. A quadratic regression model was established by taking contact time (A), pH of the solution (B), SDBS initial FeCl3 solution concentration (D), adsorbent dosage (E), as well as calcination temperature (F) as independent parameters, and SDBS removal rate Y as response value. The experimental results obtained according to the design of BBD-RSM were shown in Table S2.† The quadratic model equation obtained was shown in eqn (7).| | |
Y = 87.33 + 16.55A + 4.69B − 4.66C + 5.55D + 13.96E + 1.17F + 0.93AB − 1.07AC + 1.43AD + 3.19AE + 0.51AF − 0.87BC − 0.36BD + 0.67BE + 0.80BF − 0.0087CD + 2.51CE + 0.34CF − 0.73DE + 0.17DF − 0.47 EF − 17.10A2 − 8.06B2 − 3.27C2 − 2.96D2 − 11.92 E2 + 2.77F2
| (7) |
3.3.1 Analysis of variance. The results of the ANOVA analysis are demonstrated in Table 5. It was used to assess the significance and the degree of influence of the independent variables. The model's F-value of 74.13 and p-values less than 0.05 illustrated that the model is credible and fits well throughout the regression region.47 These parameters were regarded as remarkable if the p-value was below 0.05. At this point, A, B, C, D, E, AE, CE, A2, B2, C2, D2 and E2 are the significant parameters.
Table 5 Analysis of variance for the response surface quadratic model
| Source |
Sum of squares |
Degree of freedom |
Mean square |
F value |
P value |
|
| Model |
19![[thin space (1/6-em)]](https://www.rsc.org/images/entities/char_2009.gif) 523.36 523.36 |
27.00 |
723.09 |
74.13 |
<0.0001 |
Significant |
| A-contact time |
6571.34 |
1.00 |
6571.34 |
673.70 |
<0.0001 |
| B-pH |
527.91 |
1.00 |
527.91 |
54.12 |
<0.0001 |
| C-initial concentration |
522.11 |
1.00 |
522.11 |
53.53 |
<0.0001 |
| D-FeCl3 solution concentration |
739.70 |
1.00 |
739.70 |
75.84 |
<0.0001 |
| E-adsorbent dosage |
4675.20 |
1.00 |
4675.20 |
479.31 |
<0.0001 |
| F-calcination temperature |
33.09 |
1.00 |
33.09 |
3.39 |
0.0769 |
| AB |
6.85 |
1.00 |
6.85 |
0.70 |
0.4098 |
| AC |
9.16 |
1.00 |
9.16 |
0.94 |
0.3415 |
| AD |
32.92 |
1.00 |
32.92 |
3.37 |
0.0777 |
| AE |
81.22 |
1.00 |
81.22 |
8.33 |
0.0078 |
| AF |
2.08 |
1.00 |
2.08 |
0.21 |
0.6480 |
| BC |
6.00 |
1.00 |
6.00 |
0.62 |
0.4398 |
| BD |
1.05 |
1.00 |
1.05 |
0.11 |
0.7453 |
| BE |
7.10 |
1.00 |
7.10 |
0.73 |
0.4013 |
| BF |
5.07 |
1.00 |
5.07 |
0.52 |
0.4773 |
| CD |
0.00 |
1.00 |
0.00 |
0.00 |
0.9937 |
| CE |
50.35 |
1.00 |
50.35 |
5.16 |
0.0316 |
| CF |
1.83 |
1.00 |
1.83 |
0.19 |
0.6685 |
| DE |
4.25 |
1.00 |
4.25 |
0.44 |
0.5151 |
| DF |
0.23 |
1.00 |
0.23 |
0.02 |
0.8779 |
| EF |
1.80 |
1.00 |
1.80 |
0.18 |
0.6714 |
| A2 |
3006.18 |
1.00 |
3006.18 |
308.20 |
<0.0001 |
| B2 |
668.27 |
1.00 |
668.27 |
68.51 |
<0.0001 |
| C2 |
110.15 |
1.00 |
110.15 |
11.29 |
0.0024 |
| D2 |
90.40 |
1.00 |
90.40 |
9.27 |
0.0053 |
| E2 |
1461.26 |
1.00 |
1461.26 |
149.81 |
<0.0001 |
| F2 |
79.06 |
1.00 |
79.06 |
8.11 |
0.0085 |
| Residual |
253.61 |
26.00 |
9.75 |
|
|
| Lack of fit |
237.82 |
21.00 |
11.32 |
3.59 |
0.0804 |
Not significant |
| Pure error |
15.78 |
5.00 |
3.16 |
|
|
| Cor total |
19![[thin space (1/6-em)]](https://www.rsc.org/images/entities/char_2009.gif) 776.97 776.97 |
53.00 |
|
|
|
The contact time was found to have the greatest effect on the model and the second was the adsorbent dosage. Furthermore, as shown in Fig. 6(a), the R2 (0.9872) of the quadratic model was close to the adjusted R2 (0.9739) which illustrated a sufficient correlation between the input and output values.48 The experimental model Adeq precision = 32.06 >4, indicating that the model is reliable and has enough signals to respond to the design. It is preferable to use C.V.% rather than the standard deviation when comparing model changes since it is a dimensionless number. When the C.V.% value is below 10%, the predicted value is close to the actual value (Table 6).
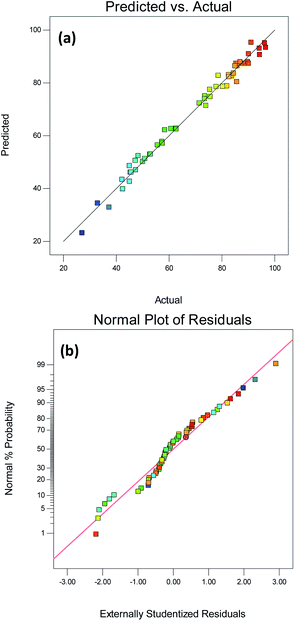 |
| | Fig. 6 RSM diagnostic plots for (a) Predicted vs. actual (R2 = 0.9872) (b) normal plot of residuals. | |
Table 6 Fit statistics of ANOVA
| Std. dev. |
Mean |
C.V.% |
R2 |
Adj R2 |
Pred R2 |
Adeq precision |
| 3.1232 |
69.3156 |
4.5057 |
0.9872 |
0.9739 |
0.9360 |
32.065 |
3.3.2 Response surface plots. Response surface plots can express the relative impact of any single variable while the remaining variables remain constant.49 The effects of contact time and adsorbent dosage on the adsorption of SDBS on Fe2O3-VR are illustrated in Fig. 7(a). With a fixed amount of adsorbent, the removal rate of SDBS increased with increasing of contact time, and the trend slowed down reaching a certain value, indicating that the contribution of the contact time to the SDBS removal efficiency gradually tends to be saturated. It was in accordance with the kinetic results. In addition, when the contact time was constant, the removal rate increased and then slightly decreased with increasing of adsorbent dosage. The increase of adsorbent dosage will lead to the mutual masking of adsorption sites so that the adsorption capacity per unit mass of adsorbent will be reduced.50 In addition, excessive adsorbents may reduce the migration ability of sulfonate from the liquid phase to the solid surface of volcanic rocks and hinder the adsorption process. The research showed that in response surface analysis if the contour shape is elliptic, it indicates significant interaction between the factors, while the opposite is true for a circle.51 As can be seen intuitively from the contour plot, the interaction between the two factors is relatively significant. There is an optimal SDBS removal area, that is, the area with a contact time of 120–180 min and adsorbent dosage of 70–90 g L−1, with SDBS removal efficiency of over 90% .
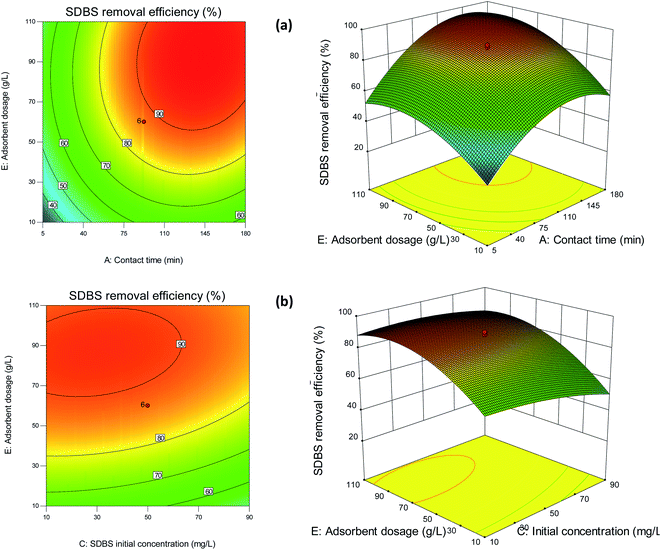 |
| | Fig. 7 2D contour and 3D RSM plots of (a) contact time and adsorbent dosage and (b) SDBS initial concentration and adsorbent dosage. | |
The interaction of SDBS initial concentration and dosage on SDBS removal efficiency was displayed in Fig. 7(b). It demonstrates that the removal percentage of SDBS increased with decreasing SDBS initial concentration and increasing adsorbent dosage. The decrease in SDBS removal rate with increasing initial concentration can be assigned to the limited number of adsorption sites, and excessive SDBS concentrations will inevitably lead to overcrowding of adsorption sites and adsorption barriers.37 It can be intuitively seen from the contour plot that the interaction between SDBS initial concentration and adsorbent dosage is relatively significant and it indicated that there was an optimal SDBS removal area, that is, the area with a SDBS initial concentration of 10–50 mg L−1 and adsorbent dosage of 70–90 g L−1, and the SDBS removal efficiency is above 90%. In addition, it can also be observed that adsorbent dosage has a greater influence on SDBS removal efficiency than SDBS initial concentration.
3.3.3 Optimization of RSM. Fig. 8 shows the optimal conditions based on RSM, which were contact time of 180 min, pH 6.62, SDBS initial concentration of 22.04 mg L−1, FeCl3 solution concentration of 0.26 mol L−1, the adsorbent dosage of 76.46 g L−1 and calcination temperature of 233.43 °C. The maximum removal efficiency of SDBS was 97.5222%. The experiment was conducted under these optimal conditions and the predicted optimal values were verified. An experimental value of 96.6839% was obtained, in general agreement with the predicted removal rate (97.5222%). The consensual nature of the model and the low error reflect the applicability of the model.52
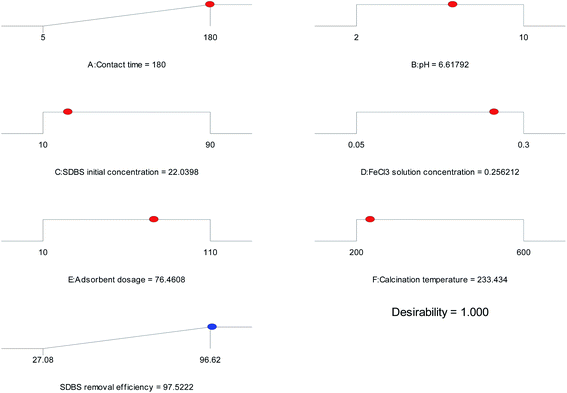 |
| | Fig. 8 The desirability effect for SDBS removal efficiency. | |
3.4 Artificial neural network (ANN) modelling
3.4.1 Evaluation of model. During the training process, a different number of neurons were tested as shown in Fig. 9. It can be seen that in the trainlm algorithm, the optimal result according to the minimum mean square error was 13. Thus, the developed network topology was designated as 6−13−1 (six input neurons, thirteen hidden neurons and one output neuron).
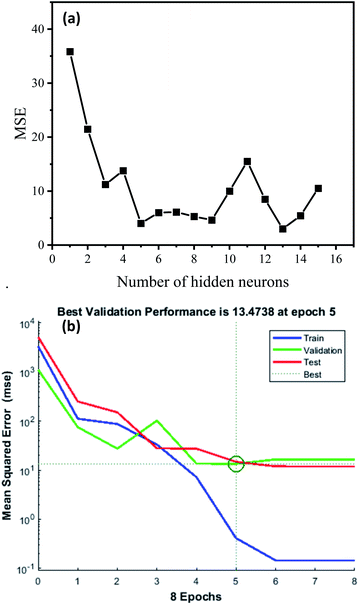 |
| | Fig. 9 (a) MSE plot for different numbers of neurons in the hidden layer (1–15) for the response of SDBS removal efficiency; (b) ANN performance validation plot. | |
The variation of the mean square error of the system with iteration number is displayed in Fig. 8(b). It can be seen that the lowest MSE (2.9952) of the system appeared in the sixth epoch iteration, and then the system stops training. The MSE is small and satisfactory showing that the training network fits perfectly. The ANN regression plot, shown in Fig. 10, indicates the R2 values for training, validation, testing and overall data, evaluating the relationship among the experimental and predicted values. It can be observed that the R2 values for the training, validation, test and all data lie approximately around the 45° line with R2 values of 0.99956, 0.9898, 0.9905 and 0.99605, respectively. Accordingly, the neural network output network response could nicely illustrate the adsorption process of SDBS.
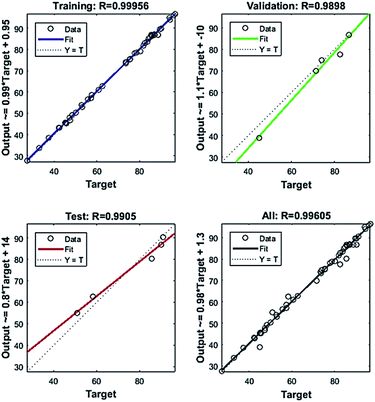 |
| | Fig. 10 Regression plot of experimental data and BP-ANN model simulated values. | |
3.4.2 Sensitivity analysis. Garson algorithm is used to analyze the sensitivity of the ANN for getting the connection weight of input-hidden layers and hidden-output layer.53 The equation below is proposed by Garson for this type of analysis:| |
 | (8) |
where, N, L, and M are the number of neurons in the input layer, hidden layer, and output layer, respectively. w, v are the connection weights between the input layer and the hidden layer, and hidden layer and the output layer, respectively.The weights and biases of BP-ANN in input-hidden layers (wi and bi) and hidden-output layer (wj and bj) are shown in Table 7. Garson equation calculated that the contact time contributed most to the decontamination of SDBS (37.31%), followed by calcination temperature (29.43%), dosage (24.44%), initial concentration (17.18%) and ferric chloride solution concentration (17.18%), and finally pH (11.56%).
Table 7 The weights and biases of BP-ANN in input-hidden layers (wi and bi) and hidden-output layer (wj and bj)
| Number of neurons |
wi |
bi |
wj |
bj |
| Contact time |
pH |
Initial concent-ration |
FeCl3 solution concent-ration |
Adsorbent dosage |
Calcination temperature |
| 1 |
−0.8746 |
−0.7059 |
1.9034 |
−0.6521 |
0.0072 |
−0.8489 |
1.9458 |
−0.1810 |
−0.7695 |
| 2 |
−1.1790 |
−0.0953 |
−0.0762 |
−1.4168 |
1.6262 |
0.6759 |
1.3499 |
0.2760 |
| 3 |
0.6080 |
−0.7628 |
1.2893 |
−0.3339 |
1.1133 |
−1.4350 |
−1.7378 |
−0.1347 |
| 4 |
−1.7079 |
0.7471 |
1.3665 |
0.2297 |
−0.6280 |
−0.5845 |
1.4138 |
0.1242 |
| 5 |
2.2512 |
1.1521 |
−0.1281 |
0.2033 |
−0.5303 |
−1.1627 |
−0.2676 |
−0.0032 |
| 6 |
1.7788 |
−0.1742 |
−0.0716 |
0.7942 |
1.4090 |
0.6207 |
0.4744 |
0.0508 |
| 7 |
0.5371 |
0.0497 |
−1.0785 |
−1.4464 |
0.0998 |
1.5756 |
−0.0401 |
−0.0955 |
| 8 |
−0.1316 |
0.0852 |
−0.3324 |
0.8385 |
1.0518 |
0.3142 |
0.6922 |
0.4866 |
| 9 |
−0.6774 |
−0.0363 |
−1.0028 |
−1.5152 |
0.5608 |
0.5675 |
−1.0833 |
0.0195 |
| 10 |
1.8483 |
−0.0440 |
0.0586 |
0.2031 |
−0.8218 |
0.3839 |
1.1136 |
0.7388 |
| 11 |
0.6510 |
−0.3107 |
0.2250 |
0.3435 |
0.3045 |
3.2857 |
1.5042 |
−0.2783 |
| 12 |
−0.9453 |
0.2847 |
−0.2166 |
0.3838 |
−2.2577 |
−0.4675 |
−1.3644 |
−0.2648 |
| 13 |
0.9899 |
0.8325 |
−0.5516 |
−0.8284 |
0.2522 |
−0.8640 |
2.4056 |
0.3081 |
This result is slightly different from the result of RSM. They agreed that contact time was the most important factor for the output variable. The difference is that the ANN model and RSM model consider the influence of calcination temperature and dosage as the second place respectively. In addition, sensitivity analysis of the ANN model can specify the degree of influence, while the quadratic equation of the RSM model can reflect whether factors are positively correlated.
3.5 Optimization using GA and PSO
3.5.1 Genetic algorithm (GA). GA method was employed to optimize the input space of the optimal network to maximize the SDBS adsorbed in the adsorption procedure. As shown in Fig. 11, the optimal fitness graph obtained by the GA after 230 iterations revealed that the results gradually converge to the optimal solution. The maximum removal efficiency was 99.9984% under the optimal conditions of contact time = 132.1 min, pH = 7.33, initial SDBS concentration = 18.21 mg L−1, FeCl3 solution concentration = 0.28 mol L−1, adsorbent dosage = 70.02 g L−1 and calcination temperature = 246.53 °C. The results were verified by batch experiments under the optimal conditions specified by GA. The results of running GA with multiple randomly selected initial populations showed that the variables values and output values changed very slightly, indicating that GA was able to determine the global largest with a high degree of precision.34
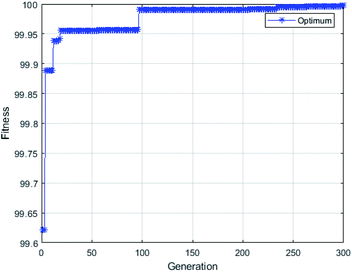 |
| | Fig. 11 Fitness plot of GA optimization. | |
3.5.2 Particle swarm optimization (PSO). In PSO, led by the optimal individual of the population, the whole population continuously approaches the global optimal solution, thus obtaining the optimal solution to the problem. It has fewer parameters and faster convergence and can be used to solve complex optimization problems. Up to now, it has been widely used in practical engineering fields. As shown in Fig. 12, after 25 iterations of PSO evaluation, the optimal conditions were selected and a better SDBS removal efficiency was obtained. The optimized process conditions are as follows: contact time is 136.45 min, the pH of the solution is 5.64, initial SDBS concentration is 22.4 mg L−1, FeCl3 solution concentration is 0.3 mol L−1, the adsorbent dosage is 83.21 g L−1 and calcination temperature = 274.02 °C. In this condition, the ANN prediction of the maximum SDBS removal efficiency is 99.9982%. Similarly, by running the program several times for verification, just like GA, the results showed very slight variation.
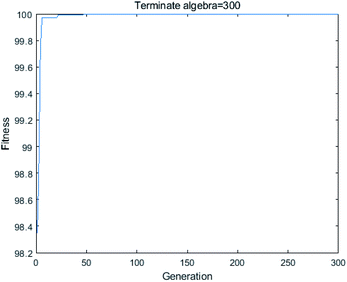 |
| | Fig. 12 Fitness plot of PSO optimization. | |
3.6 Comparison of RSM, ANN-GA and ANN-PSO
In this paper, the Fe2O3-VR adsorption process of SDBS was modeled by RSM and ANN, and GA and PSO were used to optimize. RMSE and AAD can be applied to evaluate the behavior of both models, which are as follows:| |
 | (9) |
| |
 | (10) |
where the meaning of each element is the same as eqn (5) and (6). The prediction ability of ANN and RSM is compared through R2, MSE, RMSE and AAD, as presented in Table 8. The results showed that both RSM and ANN had statistically significant correlations. The R2 value of RSM with SDBS removed was 0.9872, while the ANN was 0.9961. In addition, the MSE, RMSE and AAD values of ANN were smaller compared to RSM, indicating that the prediction results of ANN were closer to the experimental values with less error bias. Accordingly, ANN has better predictive power compared to RSM, which may be owing to the general approximation capability of ANN for any form of nonlinearity present in nonlinear complex systems.54
Table 8 The optimized process parameters for SDBS removal by Fe2O3-VR using different approaches
| Variables |
BBD-RSM |
ANN-GA |
ANN-PSO |
| Predicted parameters |
Experimental parameters |
Predicted parameters |
Experimental parameters |
Predicted parameters |
Experimental parameters |
| Contact time (min) |
180 |
180 |
132.1 |
132 |
136.45 |
136 |
| pH |
6.62 |
6.6 |
7.33 |
7.3 |
5.64 |
5.6 |
| Initial concentration (mg L−1) |
22.04 |
22.04 |
18.21 |
18.21 |
22.4 |
22.4 |
| FeCl3 solution concentration (mol L−1) |
0.26 |
0.26 |
0.28 |
0.28 |
0.3 |
0.3 |
| Adsorbent dosage (g L−1) |
76.46 |
76.4 |
70.02 |
70 |
83.21 |
83.2 |
| Calcination temperature (°C) |
233.43 |
230 |
246.53 |
240 |
274.02 |
270 |
| Removal efficiency (%) |
97.5222 |
96.6839 |
99.9984 |
99.3547 |
99.9982 |
99.7652 |
| R2 |
0.9872 |
0.9961 |
| Mean square error (MSE) |
4.6964 |
2.1311 |
| Root mean square error (RMSE) |
2.1671 |
1.4598 |
| Average absolute deviation (AAD%) |
1.5908 |
0.5464 |
| Relative error (%) |
0.8383 |
0.6437 |
0.2330 |
Moreover, compared to ANN-GA, the relative error of verification experiments by ANN-PSO (0.2330) was lower. So ANN-PSO was more approximate to the real situation and improved SDBS removal efficiency. Therefore, it can be inferred that ANN-PSO is a satisfactorily performing method. Finally, because of the excellent results obtained from this study, RSM, ANN-GA or ANN-PSO methods can be applied in the modeling real-scale greywater treatment systems.
3.7 Proposed mechanism of adsorption
The specific surface area of Fe2O3-VR increased substantially, providing a considerable amount of active sites for the adsorption of SDBS. The adsorption behavior of SDBS on Fe2O3-VR was dominated by physical adsorption, accompanied by chemisorption.55 Fe2O3-VR has a positive surface charge over a wide pH range. The significant improvement of SDBS removal by Fe2O3-VR is due to the electrostatic gravitational force between the adsorbent surface and SDBS molecules. Other driving factors such as dispersion forces, hydrogen bonding, etc. may also operate in the adsorption process. The mechanism of electrostatic action of SDBS on Fe2O3-VR is schematically shown in Fig. 13.
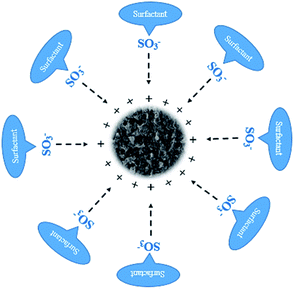 |
| | Fig. 13 Electrostatic action mechanism diagram of Fe2O3-VR. | |
3.8 Regeneration of Fe2O3-VR
In general, apart from the removal efficiency, the regeneration and reuse of the material is also an important point. After adsorption, Fe2O3-VR were collected and regenerated by ultrasonic treatment for 10 min. Afterward, they were washed three times with deionized water and dried at 100 °C. The regenerated adsorbent was reused to perform adsorption tests at 25 °C and pH = 7, and the removal efficiency of SDBS was recorded by repeating 5 cycles. The result was shown in Fig. 14. There was only a 12% decrease in removal efficiency after 5 cycles, which might be due to the loss of adsorbent during regeneration. It demonstrated the economy and applicability of Fe2O3-VR in the adsorption of SDBS.
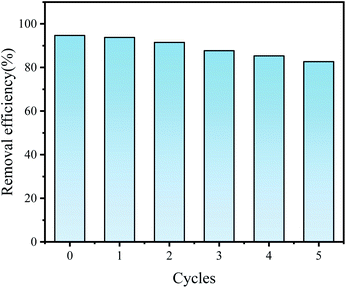 |
| | Fig. 14 Regeneration of Fe2O3-VR. | |
4. Conclusion
The adsorption process of Fe2O3-coated volcanic rocks (Fe2O3-VR) for the removal of SDBS from greywater in rural areas was studied, which was suitable for the pseudo-second-order kinetic model and Freundlich isotherm model. Fe2O3-VR was prepared using FeCl3 solution, which mainly removed SDBS by electrostatic gravitation force, and the removal rate of SDBS reached 95%. It also has good regeneration and recycling performance, and the removal rate was reduced by only 12% after 5 cycles. In this work, RSM and ANN were studied to forecast the removal efficiency of SDBS by altering the parameters: contact time, pH, initial SDBS concentration, FeCl3 solution concentration, adsorbent dosage and calcination temperature. According to 4 statistical error metrics, the ANN model has better prediction and accuracy compared to the RSM model. In the ANN, the best network structure of 6-13-1 was utilized and the results of sensitivity analysis showed that the factors of SDBS removal efficiency were in the order of: contact time (37.31%) > calcination temperature (29.43%) > dosage (24.44%) > initial concentration (17.18%) > FeCl3 solution concentration (17.18%) > pH (11.56%). The adsorption efficiency was 99.9984% and 99.9982% by optimization with GA and PSO, respectively. But the experimental results showed that ANN-PSO is a satisfactorily performing method. The optimum level of contact time, pH, initial SDBS concentration, FeCl3 solution concentration, adsorbent dosage and calcination temperature is 136.45 min, 5.64, 22.4 mg L−1, 0.3 mol L−1, 83.21 g L−1, 274.02 °C, respectively. The proposed method is effective for optimizing the process parameters of SDBS removal from greywater in rural areas by Fe2O3-VR. In future research, this method can be widely used in the parameter optimization of the greywater treatment process, not only in rural areas with a great possibility.
Author contributions
Yuankun Liu: conceptualization, methodology, validation, visualization, formal analysis, resources, writing – review & editing, supervision, project administration, funding acquisition. Xiaoying Feng: methodology, software, validation, formal analysis, writing – original draft, writing – review & editing, visualization. Xing Li: resources, supervision, project administration, funding acquisition. Hongrun Liu: conceptualization, methodology, formal analysis.
Conflicts of interest
There are no conflicts to declare.
Acknowledgements
The authors would like to thank the foundation of the National Key Research and Development Program of China (Grant No. 2018YFD1100501).
References
- M. A. Nazir, A. Yasar, M. A. Bashir, S. H. Siyal, T. Najam, M. S. Javed, K. Ahmad, S. Hussain, S. Anjum, E. Hussain, S. S. A. Shah and A. U. Rehman, Int. J. Environ. Anal. Chem., 2020, 1–12 CrossRef.
- W. N. Moturi, Clean Water and Sanitation, Encyclopedia of the UN Sustainable Development Goals, ed. W. Leal Filho, A. M. Azul, L. Brandli, A. Lange Salvia and T. Wall, Springer, 2021, pp. 1–13 Search PubMed.
- P. K. Samantaray, G. Madras and S. Bose, Adv. Sustainable Syst., 2019, 3, 1900017 CrossRef CAS.
- R. Steele, Progress on Household Drinking Water, Sanitation and Hygiene 2000–2017: Special Focus on Inequalities, World Health Organization, 2019 Search PubMed.
- A. Ding, H. Liang, G. Li, I. Szivak, J. Traber and W. Pronk, J. Membr. Sci., 2017, 542, 408–417 CrossRef CAS.
- R. Nautiyal, S. Uliana, I. Raj, B. Shah, K. Rathore and A. Singh, Proceedings of the 2nd World Congress on Civil, Structural, and Environmental Engineering (CSEE'17), Barcelona, Spain, 2017 Search PubMed.
- M. Sanchez, M. J. Rivero and I. Ortiz, Desalination, 2010, 262, 141–146 CrossRef CAS.
- A. A. Siyal, M. R. Shamsuddin, S. H. Khahro, A. Low and M. Ayoub, J. Environ. Chem. Eng., 2021, 9, 104949 CrossRef CAS.
- M. A. Nazir, N. A. Khan, C. Cheng, S. S. A. Shah, T. Najam, M. Arshad, A. Sharif, S. Akhtar and A. U. Rehman, Appl. Clay Sci., 2020, 190, 105564 CrossRef CAS.
- M. A. Nazir, M. S. Bashir, M. Jamshaid, A. Anum, T. Najam, K. Shahzad, M. Imran, S. S. A. Shah and A. U. Rehman, Surf. Interfaces, 2021, 25, 101261 CrossRef CAS.
- M. A. Nazir, T. Najam, K. Zarin, K. Shahzad, M. S. Javed, M. Jamshaid, M. A. Bashir, S. S. A. Shah and A. U. Rehman, Int. J. Environ. Anal. Chem., 2021, 1–16 CrossRef.
- M. A. Nazir, M. A. Bashir, T. Najam, M. S. Javed, S. Suleman, S. Hussain, O. P. Kumar, S. S. A. Shah and A. U. Rehman, Microchem. J., 2021, 164, 105973 CrossRef CAS.
- M. Jamshaid, A. U. Rehman, O. P. Kumar, S. Iqbal, M. A. Nazir, A. Anum and H. M. Khan, J. Mater. Sci.: Mater. Electron., 2021, 32, 16255–16268 CrossRef CAS.
- N. Farooq, R. Luque, M. M. Hessien, A. M. Qureshi, F. Sahiba, M. A. Nazir and A. Ur Rehman, Appl. Sci., 2021, 11, 9000 CrossRef CAS.
- S. S. A. Shah, T. Najam, C. Molochas, M. A. Nazir, A. Brouzgou, M. S. Javed, A. U. Rehman and P. Tsiakaras, Molecules, 2021, 26, 6672 CrossRef CAS PubMed.
- P. S. Bhandari and P. R. Gogate, J. Mol. Liq., 2018, 252, 495–505 CrossRef CAS.
- S. R. Taffarel and J. Rubio, Miner. Eng., 2010, 23, 771–779 CrossRef CAS.
- N. Kahya, H. Kaygusuz and F. B. Erim, J. Polym. Environ., 2018, 26, 2166–2172 CrossRef CAS.
- D. Kim, J. Kim, K. Lee and T. S. Lee, Microporous Mesoporous Mater., 2019, 275, 270–277 CrossRef CAS.
- A. A. Siyal, M. R. Shamsuddin, N. E. Rabat, M. Zulfiqar, Z. Man and A. Low, J. Cleaner Prod., 2019, 229, 232–243 CrossRef CAS.
- X. Zhu, T. Song, Z. Lv and G. Ji, Process Saf. Environ. Prot., 2016, 104, 373–381 CrossRef CAS.
- J. Niu, P. Ding, X. Jia, G. Hu and Z. Li, Sci. Total Environ., 2019, 688, 994–1004 CrossRef CAS PubMed.
- B. Rajeswari and K. S. Amirthagadeswaran, Measurement, 2017, 105, 78–86 CrossRef.
- C. E. Onu, J. T. Nwabanne, P. E. Ohale and C. O. Asadu, S. Afr. J. Chem. Eng., 2021, 36, 24–42 Search PubMed.
- A. Deb, A. Debnath and B. Saha, Appl. Organomet. Chem., 2019, 34, 1–20 Search PubMed.
- J. Zhang, S. O. Williams and H. Wang, Sustainable Computing: Informatics and Systems, 2018, 20, 192–202 Search PubMed.
- S. L. C. Ferreira, V. A. Lemos, V. S. de Carvalho, E. G. P. Da Silva, A. F. S. Queiroz, C. S. A. Felix, D. L. F. Da Silva, G. B. Dourado and R. V. Oliveira, Microchem. J., 2018, 140, 176–182 CrossRef CAS.
- O. D. Onukwuli, P. C. Nnaji, M. C. Menkiti, V. C. Anadebe, E. O. Oke, C. N. Ude, C. J. Ude and N. A. Okafor, J. Taiwan Inst. Chem. Eng., 2021, 125, 372–386 CrossRef CAS.
- M. Fan, T. Li, J. Hu, R. Cao, X. Wei, X. Shi and W. Ruan, Materials, 2017, 10, 544 CrossRef PubMed.
- M. I. Ejimofor, I. G. Ezemagu and M. C. Menkiti, Current Research in Green and Sustainable Chemistry, 2021, 4, 100164 CrossRef.
- S. Biswas, M. Bal, S. Behera, T. Sen and B. Meikap, Water, 2019, 11, 325 CrossRef CAS.
- M. Fan, T. Li, J. Hu, R. Cao, X. Wei, X. Shi and W. Ruan, Materials, 2017, 10, 544 CrossRef PubMed.
- Z. Ciğeroğlu, G. Küçükyıldız, B. Erim and E. Alp, J. Mol. Struct., 2021, 1224, 129182 CrossRef.
- G. Dhanarajan, V. Rangarajan, C. Bandi, A. Dixit, S. Das, K. Ale and R. Sen, J. Biotechnol., 2017, 256, 46–56 CrossRef CAS PubMed.
- J. Kennedy and R. Eberhart, Neural Networks, 1995, 1942–1948 Search PubMed.
- J. Qi, Y. Hou, J. Hu, W. Ruan, Y. Xiang and X. Wei, Mater. Today Commun., 2020, 24, 100709 CrossRef CAS.
- H. Cheng, Y. Liu and X. Li, J. Hazard. Mater., 2021, 415, 125749 CrossRef CAS PubMed.
- J. Wolanin, L. Barré, C. Dalmazzone and D. Bauer, Colloids Surf., A, 2021, 613, 126098 CrossRef CAS.
- C. Breen, J. Illés, J. Yarwood and D. R. Skuse, Vib. Spectrosc., 2007, 43, 366–379 CrossRef CAS.
- V. Lenoble, O. Bouras, V. Deluchat, B. Serpaud and J. Bollinger, J. Colloid Interface Sci., 2002, 255, 52–58 CrossRef CAS PubMed.
- R. Juang, W. Lee and C. Chen, J. Chem. Technol. Biotechnol., 2004, 79, 240–246 CrossRef CAS.
- Q. Zhao, X. Wang, H. Xia, J. Liu, H. Wang, J. Gao, Y. Zhang, J. Liu, H. Zhou, X. Li, S. Zhang and X. Wang, Electrochim. Acta, 2015, 173, 566–574 CrossRef CAS.
- P. Devi and A. K. Saroha, Sci. Total Environ., 2017, 578, 16–33 CrossRef CAS PubMed.
- D. Kim, J. Kim, K. Lee and T. S. Lee, Microporous Mesoporous Mater., 2019, 275, 270–277 CrossRef CAS.
- J. Niu, P. Ding, X. Jia, G. Hu and Z. Li, Sci. Total Environ., 2019, 688, 994–1004 CrossRef CAS PubMed.
- C. Bulin, B. Li, Y. Zhang and B. Zhang, J. Phys. Chem. Solids, 2020, 147, 109659 CrossRef CAS.
- S. Ahmadi, L. Mohammadi, C. A. Igwegbe, S. Rahdar and A. M. Banach, Int. J. Ind. Chem., 2018, 9, 241–253 CrossRef CAS.
- H. Mazaheri, M. Ghaedi, A. M. Ahmadi and A. Asfaram, Phys. Chem. Chem. Phys., 2017, 19, 11299–11317 RSC.
- E. A. Dil, M. Ghaedi, A. Asfaram, S. Hajati, F. Mehrabi and A. Goudarzi, Ultrason. Sonochem., 2017, 34, 677–691 CrossRef CAS PubMed.
- S. Parvaz, M. Rabbani and R. Rahimi, Mater. Sci. Eng., B, 2021, 263, 114863 CrossRef CAS.
- A. Yu, Y. Liu, X. Li, Y. Yang, Z. Zhou and H. Liu, Water, 2021, 13, 608 CrossRef CAS.
- N. Shahzad, D. Pugliese, V. Cauda, M. I. Shahzad, Z. Shah, M. A. Baig and E. Tresso, J. Photochem. Photobiol., A, 2017, 337, 192–197 CrossRef CAS.
- Y. Zhang and B. Pan, Chem. Eng. J., 2014, 249, 111–120 CrossRef CAS.
- K. Ameer, B. Chun and J. Kwon, Ind. Crops Prod., 2017, 109, 672–685 CrossRef CAS.
- A. A. Siyal, R. Shamsuddin, A. Low and A. Hidayat, Water, Air, Soil Pollut., 2020, 231, 1–13 CrossRef.
Footnote |
| † Electronic supplementary information (ESI) available. See DOI: 10.1039/d1ra09147f |
|
| This journal is © The Royal Society of Chemistry 2022 |
Click here to see how this site uses Cookies. View our privacy policy here.  Open Access Article
 *,
Xing Li and
Hongrun Liu


![[thin space (1/6-em)]](https://www.rsc.org/images/entities/char_2009.gif) 523.36
523.36![[thin space (1/6-em)]](https://www.rsc.org/images/entities/char_2009.gif) 776.97
776.97


