
 Open Access Article
 This Open Access Article is licensed under a Creative Commons Attribution-Non Commercial 3.0 Unported Licence
Terbium doped LiLuF4 nanocrystal scintillator-based flexible composite film for high resolution X-ray imaging†
Hao Luac,
Xieming Xucd,
Guiqing Fengac,
Baoping Sunc,
Shuaihua Wang *bc and
Shaofan Wubc
*bc and
Shaofan Wubc
aCollege of Chemistry and Materials Science, Fujian Normal University, Fuzhou, 350117, China
bFujian Science & Technology Innovation, Laboratory for Optoelectronic Information of China, Fuzhou, 350108, P. R. China
cKey Laboratory of Optoelectronic Materials Chemistry and Physics, Fujian Institute of Research on the Structure of Matter, Chinese Academy of Sciences, Fuzhou, 350002, P. R. China. E-mail: shwang@fjirsm.ac.cn
dUniversity of Chinese Academy of Sciences, Beijing, 100049, P. R. China
First published on 7th February 2022
Abstract
Radiographic screens are widely used in high energy physics, national defense, aviation, radiodynamic therapy and medical imaging due to their scintillation materials that can transform high-energy particles or rays into ultraviolet (UV) visible light or other signals. In recent years, lanthanide doped fluoride nanocrystals (NCs) have attracted much attention due to their excellent optical properties and stability. In this work, multiple lanthanide-doped LiLuF4 nanocrystal scintillation materials were synthesized by thermal decomposition. Among them, Tb-doped LiLuF4 nanocrystals have high X-ray sensitivity and low detection limit (36.31 nGy s−1), which is much lower than the requirement of medical imaging dose rate. After the irradiation of 42.29 mGy s−1 X-ray for 1 hour, the intensity of radioluminescence basically remained unchanged. Based on the good properties of our nanocrystals, we further prepared the flexible film of nanocomposites with epoxy resin. This kind of uniform, large area, high loaded flexible film exhibits excellent performance in X-ray imaging with a spatial resolution greater than 20 line pairs per millimeter (LP/mm).
Introduction
Radiographic screens can emit ultraviolet or visible light pulse fluorescence under high-energy rays or particle irradiation, and are widely used in medical imaging, industrial computed tomography, nuclear physics and other fields.1–4 Among them, scintillator materials play a key role in the energy conversion process, and have received extensive attention and research in recent years. For example, commercial flat-panel X-ray detectors based on traditional scintillation materials, such as CsI:Tl, PbWO4, Bi4Ge3O12 and Lu1−xYxSiO5 have been widely reported.5–7 However, almost all of these materials are grown under strict preparation conditions and long production cycles, or exhibit poor deliquescence resistance, resulting in high cost and complex assembly, which hinder the broader applications in X-ray imaging. With increased imaging requirements of resolution and flexible application, developing new scintillators with high efficiency of radioluminescence, high X-ray sensitivity, easy processing and reasonable cost is urgent for meeting the increased demands of X-ray imaging.Recently, nanomaterials with excellent luminous performance have gradually attracted the attention of scientists for exploring potential radioluminescence characteristics.8–10 Typically, nanomaterials require low temperatures for synthesis, and their structural and optical properties are easily tuned.11–14 Meanwhile, nanomaterials have excellent mouldability and are suitable for the development of flexible devices. Through ligand modification, it has advantages in developing scintillation screen with organic matrix composites.15 For example, Lawrence and his colleagues combined CdTe quantum dots with polyvinyl alcohol (PVA) and polystyrene to make composite films and used them for X-ray imaging for the first time.16 After optimization, the film synthesized by mixing polyvinyl alcohol with 10 wt% CdTe quantum dots was obtained, and the contrast modulation is 0.05 at the 5 line pair per millimeter position. Shashwati Sen and his coworkers successfully obtained composite thin film materials by mixing Gd3Ga3Al2O12:Ce (GGAG:Ce) nanoparticles with polymethyl methacrylate (PMMA) or polystyrene (PS) and reported their X-ray imaging application.17 The imaging capability of GGAG:Ce-PMMA composite film was characterized by commercial CCD camera and the final imaging resolution can reach 10 LP per mm, despite the poor transparency of the imaging film. However, as a composite material, there is an inherent contradiction between high load of nanomaterials and transparency for composite film. Therefore, the development of nanomaterial scintillation materials suitable for organic composites based on index matching and well crystallinity, has become the key to the development of a new generation of imaging screens.
Rare earth doped luminescent materials have attracted much attention in the fields of anti-counterfeiting materials, light-emitting diodes, fluorescent probes and tunable luminescence due to their advantages of good chemical stability, sharp emission spectrum and large Stokes Shift.18–20 Among them, rare earth doped alkaline fluoride materials have certain advantages in the field of optical imaging due to their low phonon energy and similar refractive index with organic polymers.21–24 For example, Yang reported a kind of rare earth doped NaLuF4 nanocrystals polydimethylsiloxane (PDMS) substrate flexible composite film that achieved flexible high spatial resolution X-ray imaging and long afterglow luminescence, providing a good example for improving spatial imaging resolution.25
LiLuF4:Tb is an optical material with good thermal stability and excellent comprehensive performance. In the fields of white LED, yellow laser and vacuum ultraviolet emission, it shows certain research value and application potential.26–30 However, as far as we know, there are few reports on the scintillation properties of this material and the development of related flexible devices. In order to explore flexible scintillation materials with simple preparation method and high spatial resolution of X-ray imaging, we investigated the related properties of LiLuF4:Tb nanocrystalline materials.
In this work, Lu rare earth element with larger atomic number is used as matrix material, which can provide more efficient X-ray absorption capacity and stable crystal field structure. LiLuF4 nanocrystals doped with different rare earth elements were synthesized by one-step thermal decomposition and their radioluminescence under X-ray irradiation was demonstrated.31,32 In view of the excellent radioluminescence performance of Tb doped-LiLuF4 nanocrystals, we focus on its research. Small size of nanocrystals is more beneficial to improve the spatial resolution of X-ray imaging, but too small size of nanocrystals will cause more surface quenching and serious reduction of radioluminescence intensity. By adjusting the synthesis conditions, nanocrystals with particle size mainly distributed in 40 nm were synthesized. The as synthesized LiLuF4:Tb nanocrystals have good stability and high sensitivity under X-ray irradiation. Due to the oil-soluble ligand coating on the surface of the nanocrystals, we further mixed the nanocrystals with epoxy resin to prepare flexible scintillation film and tested its X-ray imaging capability.33 Thanks to the good size distribution and refractive index matching of nanocrystals in thin films, the composite film achieves a high spatial resolution (20 LP per mm) in X-ray imaging. This work shows that nanocrystalline composite films have great advantages and potential value in the application of high resolution X-ray imaging.
Experimental
Chemicals and materials
Rare-earth oxides (99.99%), epoxy resin (EP), trifluoroacetic acid (TFA, 99%, Aladdin), oleylamine (OM, 90%, Aladdin), oleic acid (OA, 90%, Aladdin), Li2CO3 (99.99%, Aladdin), absolute ethanol (Sinopharm Chemical Reagent Co), and cyclohexane (Sinopharm Chemical Reagent Co.) were used as received without further purification.Preparation of trifluoroacetate precursors
25 mmol Lu2O3 was dissolved in 100 mL trifluoroacetic acid aqueous solution at 90 °C under constant and vigorous stirring, and the Lu(CF3COO)3 precursor solution (0.50 mol L−1) was obtained. 50 mL of Tb(CF3COO)3 (0.10 mol L−1) and other Ln(CF3COO)3 (Ln = rare earth) (0.10 mol L−1) was carried out in the same way as mentioned above.Synthesis of LiLuF4:Tb nanocrystals
LiLuF4:Tb nanocrystals were synthesized via a facile thermal decomposition process. Take the synthesis of LiLuF4:15%Tb nanocrystals as an example, 3 mmol Li2CO3, 1 mL trifluoroacetic acid, 5.10 mL Lu(CF3COO)3 precursor solution (0.50 mol L−1) and 4.50 mL Tb(CF3COO)3 (0.10 mol L−1) were added into a 250 mL three-neck bottom-round flask. The mixture was then slowly evaporated to dryness at 90 °C and then cooled down to room temperature. 35 mL OA and 5 mL OM were added into the 250 mL three-neck bottom-round flask and then the flask was connected to Schlenk lines. The mixture was heated to 140 °C in a nitrogen atmosphere and stirred for 30 minutes to form a clear solution. Subsequently, the solution was heated to 320 °C under a nitrogen atmosphere and kept for an hour. When the solution was cool down to room temperature, 15 mL ethanol was added and stirred for 30 min. The as-prepared nanocrystals were collected by centrifugation at 11![[thin space (1/6-em)]](https://www.rsc.org/images/entities/char_2009.gif) 000 rpm for 8 min, washed with cyclohexane and ethanol three times, and then dried at 70 °C for 12 hour.
000 rpm for 8 min, washed with cyclohexane and ethanol three times, and then dried at 70 °C for 12 hour.
Preparation of nanocrystals polymer composites films
1.20 g fully grinded LiLuF4:15%Tb nanocrystals, 0.40 g epoxy resin curing agent and 0.80 g epoxy resin were added into a 25 mL beaker. The mixture was ultrasonically dispersed for 10 minutes and removed the air bubbles in a vacuum deaeration pot. After that, the mixture was coated onto the polyethylene terephthalate (PET) plastic substrate and then cured at 60 °C for 10 hour. Finally, a composites film of nanocrystals and EP was formed on the PET plastic substrate.34Characterization
The crystal structure, phase, crystal size and morphology of the nanocrystalline were characterized by powder X-ray diffraction (XRD, Miniflex 600) and transmission electron microscope (TEM, Talos-F200X). The photoluminescence spectra, decay curves, and fluorescence quantum yield were measured by using a fluorescence spectrophotometer (Edinburgh FSL1000). The radioluminescence spectra, radiation luminescence stability and X-ray sensitivity were recorded by photon counting equipped with X-ray source (W-target, 5 W). The SEM images of the films were obtained by field emission scanning electron microscopy (SU-8010). Radiation imaging of the Composites Films was acquired by our home made imaging device equipped with a digital camera (Canon 5D4 with Sigma 180 mm F2.8 Apo Macro DG HSM).Results and discussion
Phase and structure
LiLuF4 nanocrystals were obtained by a simple thermal decomposition method. Fig. 1a shows the crystal structure of LiLuF4, in which there are eight coordination fluoride ions around lutetium ion and four coordination fluoride ions around lithium ion, both of which have a spatial symmetry of S4. The crystal phases of LiLuF4 nanocrystals doped with different concentrations of terbium ions were tested by X-ray powder diffraction (XRD). As shown in Fig. 1b, the diffraction peak of the sample is consistent with the standard card of LiLuF4 (JCPD no. 027-1251), indicating that we successfully prepared pure crystalline phase. LiLuF4 crystal has a tetragonal scheelite structure, and its space group is I41/a.35 Fig. 1c shows the magnified image of the (101) diffraction peak. It can be seen that the diffraction peak position gradually shifts to the small angle with the increase of Tb ion doping concentration. We further calculated the unit cell parameters of crystals with different doping concentrations, and the results are shown in Table 1. With the increase of terbium ion doping ratio, the single cell volume of the crystal gradually increases, indicating that the larger-radius terbium ion succeeded in replacing the smaller lutetium ion, resulting in a slight expansion of the crystal lattice. | ||
| Fig. 1 (a) Crystal structure diagram of LiLuF4. (b) X-ray diffraction patterns of LiLuF4:xTb (x = 0%, 5%, 10%, 15% and 20%) NCs. (c) The X-ray diffraction peaks of (101) facets of LiLuF4:xTb (x = 0%, 5%, 10% 15% and 20%) NCs. (d) The transmission electron microscope image of LiLuF4: 15%Tb NCs. (e) The high-resolution TEM of a single LiLuF4:15%Tb NCs. (f) Statistics graph of nanocrystalline particle size distribution. | ||
| Mol% Tb ion | a (Å) | b (Å) | c (Å) | Cell volume (Å3) |
|---|---|---|---|---|
| 0 | 5.11975 | 5.11975 | 10.55167 | 276.58 |
| 5 | 5.12451 | 5.12451 | 10.53741 | 276.72 |
| 10 | 5.12218 | 5.12218 | 10.55765 | 277.00 |
| 15 | 5.12762 | 5.12762 | 10.54647 | 277.29 |
| 20 | 5.12798 | 5.12798 | 10.57912 | 278.19 |
The transmission electron microscope (TEM) image shows that the synthesized nanocrystals perform octahedral diamond-shaped structures. In order to statistic the particle size distribution, 200 nanocrystals in a statistical figure are counted by the software. Fig. 1f shows that the size of our synthesized nanocrystals is concentrated at about 40 nm. According to Rayleighs law, when used as polymer filler, nanoparticles with size about 40 nm or less can maintain good transparency. When the size increases, the scattering effect will be significantly enhanced, thus affecting the luminescence performance.36 The as synthesized LiLuF4:15%Tb nanocrystals were found to contain F, Tb and Lu elements by energy dispersive spectrometer (EDS) analysis (Fig. S1†).
Optical and scintillation properties of LiLuF4 nanocrystals
The photophysical properties of LiLuF4:15%Tb nanocrystals was tested by the FSL1000. The photoluminescence spectra of LiLuF4 nanocrystals with different Tb3+ ion concentration under 378 nm excition are presented in Fig. 2a. The sharp linear emission peaks at 488 nm, 544 nm, 581 nm and 621 nm correspond to the energy level transitions of Tb3+ ions from 5D4 → 7FJ (J = 6, 5, 4 and 3), and the strongest luminescence peak is located at 544 nm. With the increase of doping Tb3+ ion concentration, the luminescence intensity gradually increases. When the doping ratio reaches 20%, the luminescence intensity is 7 times that of 5%. We further selectively monitored the fluorescence decay of LiLuF4:15%Tb nanocrystals at 544 nm, and obtained the fluorescence lifetime of τ1 = 5.47 ms by single-exponential fitting, in which long decay lifetimes are attributed to the 4f–4f forbidden transition of terbium ions. Under 378 nm UV excitation, the fluorescence quantum yield of the LiLuF4:15%Tb nanocrystals in the 390–800 nm range was measured to be 6.87%. The UV absorption spectra of LiLuF4 and LiLuF4:15%Tb nanocrystals was shown in Fig. 2c. When a large number of terbium ions are doped into the nanocrystals, the absorption edge of the LiLuF4 nanocrystals appears blue shift. The phenomenon of blue shift of absorption edge and increase of band gap caused by high concentration doping can be explained by Moss–Burstein (M–B) effect.37 | ||
| Fig. 2 (a) Emission spectrum of LiLuF4:Tb NCs with different Tb ion concentration. (b) The decay curve of 544 nm 5D4 → 7F5 emission in LiLuF4:15%Tb NCs. (c) The UV-vis Diffused Reflectance Spectra of LiLuF4 and LiLuF4:15%Tb NCs. (d) The band gap fitting curves of LiLuF4 and LiLuF4:15%Tb NCs. (e) Radioluminescence mechanism of inorganic scintillation materials doped with rare earth ions. | ||
The radio luminescence spectra of LiLuF4 nanocrystals with different Tb3+ ions concentration are shown in Fig. 3a. It can be seen from the picture that the luminescence peak position of the material under X-ray irradiation of 50 kV tube voltage remains the same as that under UV excitation. However, under X-ray excitation, with the increase of doping ion concentration, the luminous intensity of nanocrystal powders increases first and then decreases, and reaches the maximum at the doping concentration of 15%. This concentration quenching phenomenon appears in a variety of rare earth ion doped scintillation materials.
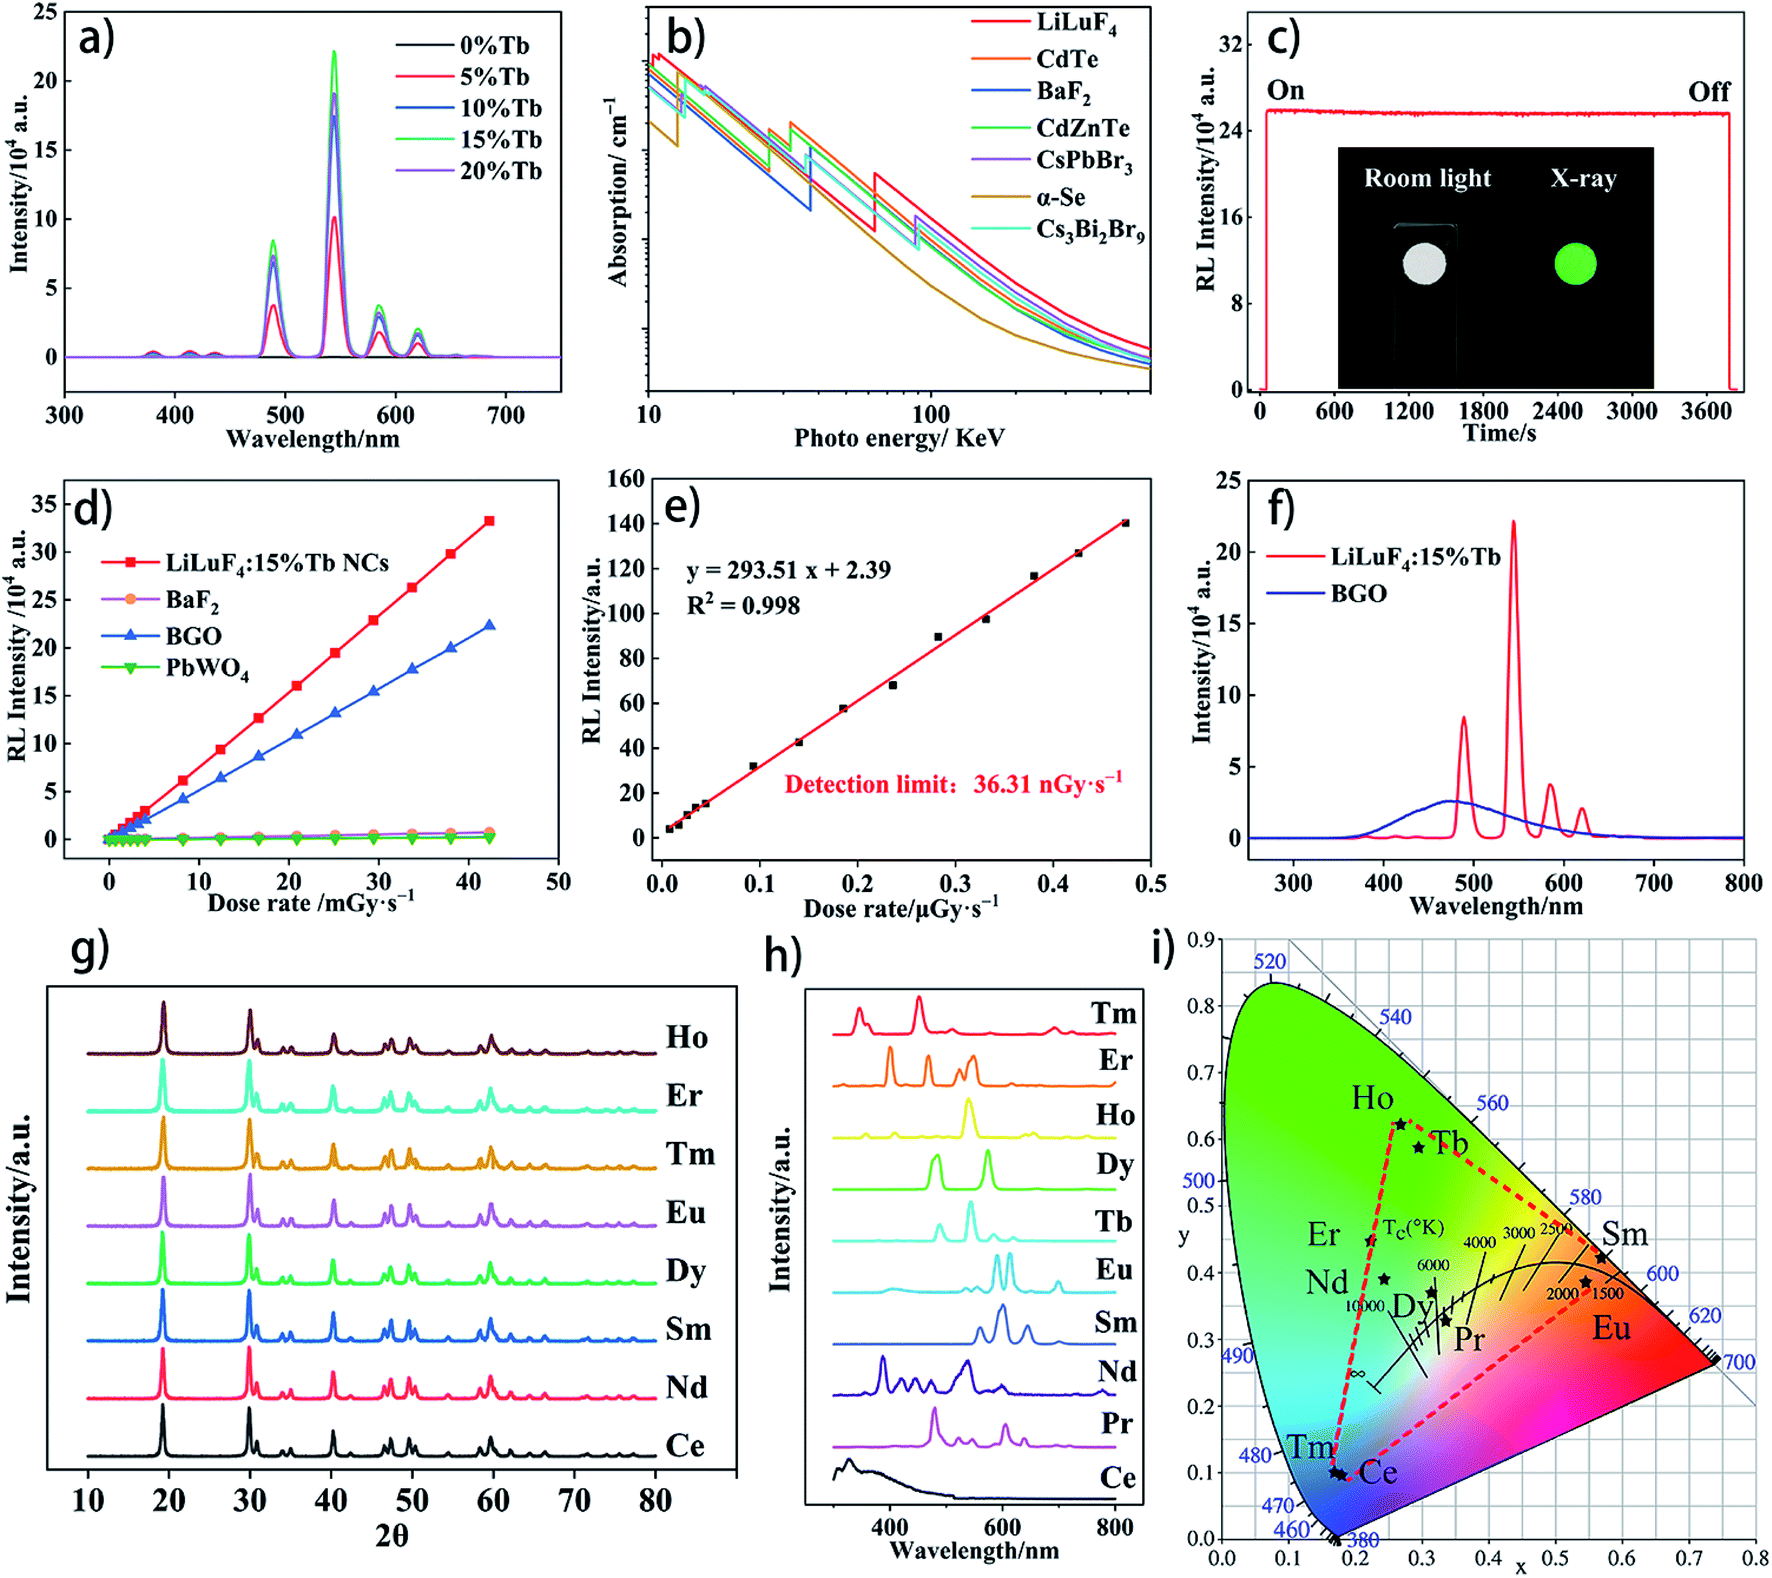 | ||
| Fig. 3 (a) The RL spectrum of LiLuF4:xTb NCs (x = 0, 5, 10, 15, 20%) under 42.29 mGy s−1 X-ray irradiation. (b) The absorption spectra of LiLuF4, CdTe, BaF2, CdZnTe, CsPbBr3, Se and Cs3Bi2Br9 as function of X-ray energy. (c) RL stability spectra of LiLuF4:15%Tb NCs exposed to 42.29 mGy s−1 X-ray for 1 h. The inset is the photograph of LiLuF4:15%Tb NCs under room light and under X-ray illumination. (d) Dose dependence of the RL intensity of LiLuF4:15%Tb NCs, BaF2, BGO and PbWO4 powders. (e) The RL intensity of LiLuF4:15%Tb NCs under low dose X-ray irradiation. The detection limit of the material can be fitted when the signal-to-noise ratio is 3:1. (f) The RL spectrum of LiLuF4:15%Tb NCs and BGO powders under 42.29 mGy s−1 X-ray irradiation. (g) XRD images of LiLuF4 NCs doped with different rare earth elements. (h) RL spectrum of LiLuF4 NCs doped with different rare earth elements. (i) The CIE chromaticity coordinates of LiLuF4 NCs doped with different rare earth elements. | ||
The difference between UV photoluminescence and radioluminescence may due to the different luminescence mechanism of the two modes.38,39 For radioluminescence, high-energy X-ray rays are first absorbed by host material in the crystal lattice and produce high-energy electrons and deep holes. These energetic particles and holes are transferred to the emission center after a series of thermalization processes and interactions with traps. The characteristic light is emitted when excitons recombine at the terbium ions luminescent center (Fig. 2e). As for ultraviolet photoluminescence, however, photons energy directly excite terbium ions, causing their transition from ground state to an excited state and then return to produce visible light.
Efficient absorption and cutoff of X-ray is an important indicator of scintillation materials. Here we compare the X-ray absorption coefficient of LiLuF4 with several scintillation materials such as CdTe, BaF2, CdZnTe, and CsPbBr3 et al. As shown in Fig. 3b, it can be seen that LiLuF4 material has a higher absorption coefficient than the other materials at a higher photon energy, indicating that the LiLuF4 material has a higher ability to cut off X-ray. In order to demonstrate the stability of the material under X-ray, we measured the emission intensity variation of LiLuF4:15%Tb nanocrystals under 42.29 mGy s−1 X-ray irradiation for one hour. As shown in Fig. 3c, after 1 hour of X-ray irradiation, the luminescence intensity of the material decreased by only 0.9%, which indicates that LiLuF4 nanocrystals has excellent anti-radiation damage ability and radioluminescence stability.
We also compared the X-ray sensitivity of LiLuF4 nanocrystals and several other common scintillation materials, and established a linear regression equation (y = k × x + b). It can be seen from the Fig. 3d that the luminescence intensity of LiLuF4:15%Tb Nanocrystals, BaF2, BGO and PbWO4 materials increases linearly with the increase of X-ray dose rate. Here, the slopes (k) can be used to perform how sensitive the material is under the same radiation environment. It is obviously that the slope of LiLuF4:15%Tb nanocrystals (k = 7.85) is much higher than BGO (k = 5.27), BaF2 (k = 0.18), and PbWO4 (k = 0.05), indicating that LiLuF4 nanocrystals has a better response to X-rays than BGO, BaF2, and PbWO4 powders in the dose range between 0–42.29 mGy s−1. To evaluate the X-ray detection capability of the LiLuF4:15%Tb nanocrystals, we further tested the luminescence intensity of the material under low dose rate X-ray irradiation, as shown in Fig. 3e. The detection limit of the material can be obtained by calculating the dose rate when the signal to noise ratio (SNR) is 3:1.40,41 The detection limit of LiLuF4:15%Tb nanocrystals is 36.31 nGy s−1, which is much lower than the requirement of X-ray diagnostics (5.50 μGy s−1).
To illustrate the radioluminescence capability of our materials, we compared the RL properties of our LiLuF4:15%Tb nanocrystals with commercial BGO materials. Fig. 3f shows the X-ray induced emission spectra of LiLuF4:15%Tb nanocrystals and BGO powders. It can be seen that BGO powder has a wide emission peak at 490 nm under X-ray excitation with a tube voltage of 50 keV and a dose rate of 42.29 mGy s−1, while our sample shows a sharp band-shaped emission peak of terbium ion. By comparing the integral area of the radiation emission spectra of the two materials, we can conclude that the luminous efficiency of our nanocrystals is 130.15% of BGO powder under the same test conditions. We also doped other lanthanide rare earth elements in the LiLuF4 matrix and tested their luminescence spectra under X-ray irradiation. It can be seen from Fig. 3h that nanocrystals doped with different lanthanide elements show their characteristic emission peaks under X-ray irradiation. The CIE chromaticity diagram of different lanthanide elements doped nanocrystals was shown in Fig. 3i. The CIE chromaticity coordinates of different rare earth doping LiLuF4 nanocrystals are as follows: Ce (x = 0.1773, y = 0.0962), Pr (x = 0.3365, y = 0.3262), Nd (x = 0.2436, y = 0.3897), Sm (x = 0.5713, y = 0.4217), Eu (x = 0.5460, y = 0.3847), Tb (x = 0.2950, y = 0.5873), Dy (x = 0.3153, y = 0.3695), Ho (x = 0.2682, y = 0.6213), Er (x = 0.2242, y = 0.4473), Tm (x = 0.1703, y = 0.0986). As shown in the chromaticity diagram, three optical primary colors, red, blue and green (RGB) can be obtained, which provides the basis for the multi-color tunable luminescence of materials. In order to verify this possibility, two elements of Tb and Sm were used for co-doping. The results show that the nanocrystals doped with two elements, Tb and Sm, show yellowish green luminescence under X-ray irradiation (Fig. S4†).
Scintillation and imaging of composites film
The preparation process of scintillation composite film is shown in Fig. 4a. First, LiLuF4:15%Tb nanocrystals were mixed with epoxy resin and curing agent by ultrasonic dispersion. After vacuum defoaming, the mixture was directly coated on PET film for polymerization. After curing the film at 60 °C for 12 h, the scintillation composite was successfully prepared. Fig. 4b was the photograph of the composite film under room light, the film has a large area (5.5 cm × 8.5 cm) and good flexibility. SEM image of the cross section shows that the overall thickness of the film is about 140 μm, and the nanocrystalline and epoxy resin were mixed evenly without obvious aggregation (Fig. 4c). Fig. 4d shows the radioluminescence spectra comparison between LiLuF4:15%Tb nanocrystals and composite film materials. It can be seen that the luminescence peaks of the two are consistent, and no other emission peaks appear after the film is prepared. Further testing of the RL spectra of pure epoxy resin films revealed that they were almost indistinguishable from instrument noise signals (Fig. S5†), indicating that the epoxy resin material as a matrix material would not have an effect on the radioluminescence of LiLuF4:15%Tb nanocrystals. Next, we explored the loading capacity of nanocrystals in composites. Fig. 5a show that with the increase of nanocrystals content, the RL intensity of the film gradually increases. When the load ratio is higher than 50 wt%, the luminescence intensity does not increase obviously, but the uniformity of the film decreases obviously. Since the uniformity of the film will directly affect the spatial resolution of the material used for imaging, we chose 50 wt% as the optimal load ratio. Unless otherwise specified, the composite films mentioned in the following article all have a 50 wt% load ratio. We also tested the radioluminescence properties of the composite films at different dose rates. It can be seen from Fig. 5c and d that the RL intensity of the film increases linearly with the increase of tube current of the ray source. This indicated that the film has good linear response and sensitivity of X-ray irradiation in the dose range of 4.0–42.29 mGy s−1.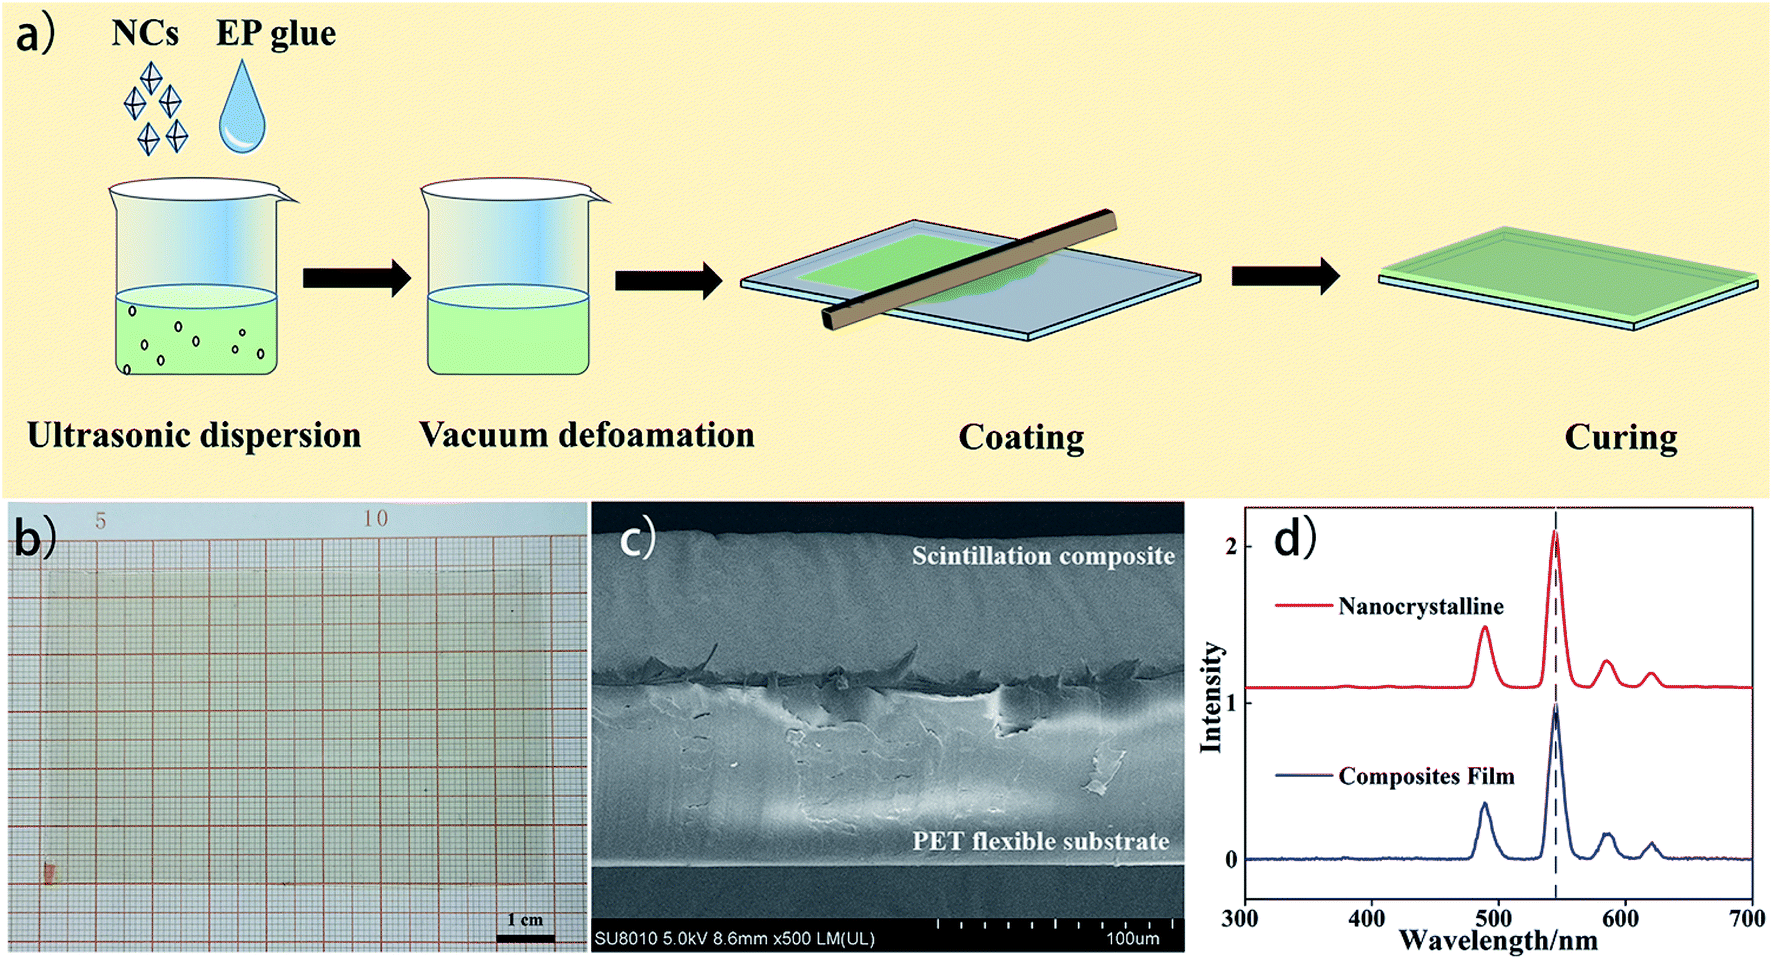 | ||
| Fig. 4 (a) Schematic diagram of preparation process of LiLuF4: 15% Tb NCs-EP composite scintillating film. (b) The photograph of composite film with 50 wt% NCs loading. (c) The cross section SEM image of composite film with 50 wt% NCs loading. (d) RL spectrum of LiLuF4:Tb NCs and composite films. | ||
 | ||
| Fig. 5 (a) RL intensity of the composite films with different NCs contents (wt%) under 42.29 mGy s−1 X-ray irradiation. (b) Variation curve of RL peak intensity at 544 nm with different loading rate. (c) RL spectrum of 50 wt% NCs loaded composite film under 50 keV tube voltage and different tube currents (10–100 μA). (d) RL intensity at 544 nm of 50 wt% NCs loaded composite film under different dose rate X-ray irradiation. | ||
To illustrate the application of our composite material, we built an X-ray imaging system and evaluated the imaging capability of our composite film (Fig. S7†). Fig. 6a and b show the images of standard line pair card under room light and X-ray irradiation respectively. As we can see from the Fig. 6b, our film can clearly show the 20 LP per mm position of the standard line pair card under 9.6547 mGy s−1 X-ray irradiation. For comparison, we also performed imaging tests using commercially available 135 μm thick CsI:Tl scintillation slices under the same test conditions. As shown in Fig. 6c, the spatial resolution of the CsI:Tl scintillation slice was only about 12 LP per mm under the same test conditions, which is much lower than our scintillation composite film. Fig. S8† shows the overall image of the CsI:Tl screen for standard line pair cards under X-ray. We further analyzed the standard line pair card X-ray image and obtained the contrast curve as the line pair changes (Fig. 6d). The contrast modulation M corresponding to the 20 LP per mm position is 0.1709. M = (−Imax − −Imin)/(−Imax + −Imin), where −Imax and −Imin are average peak value and valley value of the same line pair position in the grayscale image.42 Fig. 6g is the function graph of image gray values corresponding to pixel points at different line pairs. The picture shows that the gray value of the light and dark stripes can still be distinguished at 20 LP per mm, which indicates that the film material has a high resolution indeed. Fig. 6h and i are the photos of a Flexible Printed Circuit (FPC) and its image under X-ray irradiation. The details of the circuit board can be clearly displayed, indicating that our composite film has potential application value in the field of X-ray imaging. Fig. S9† also shows the application of this composite film in biological imaging.
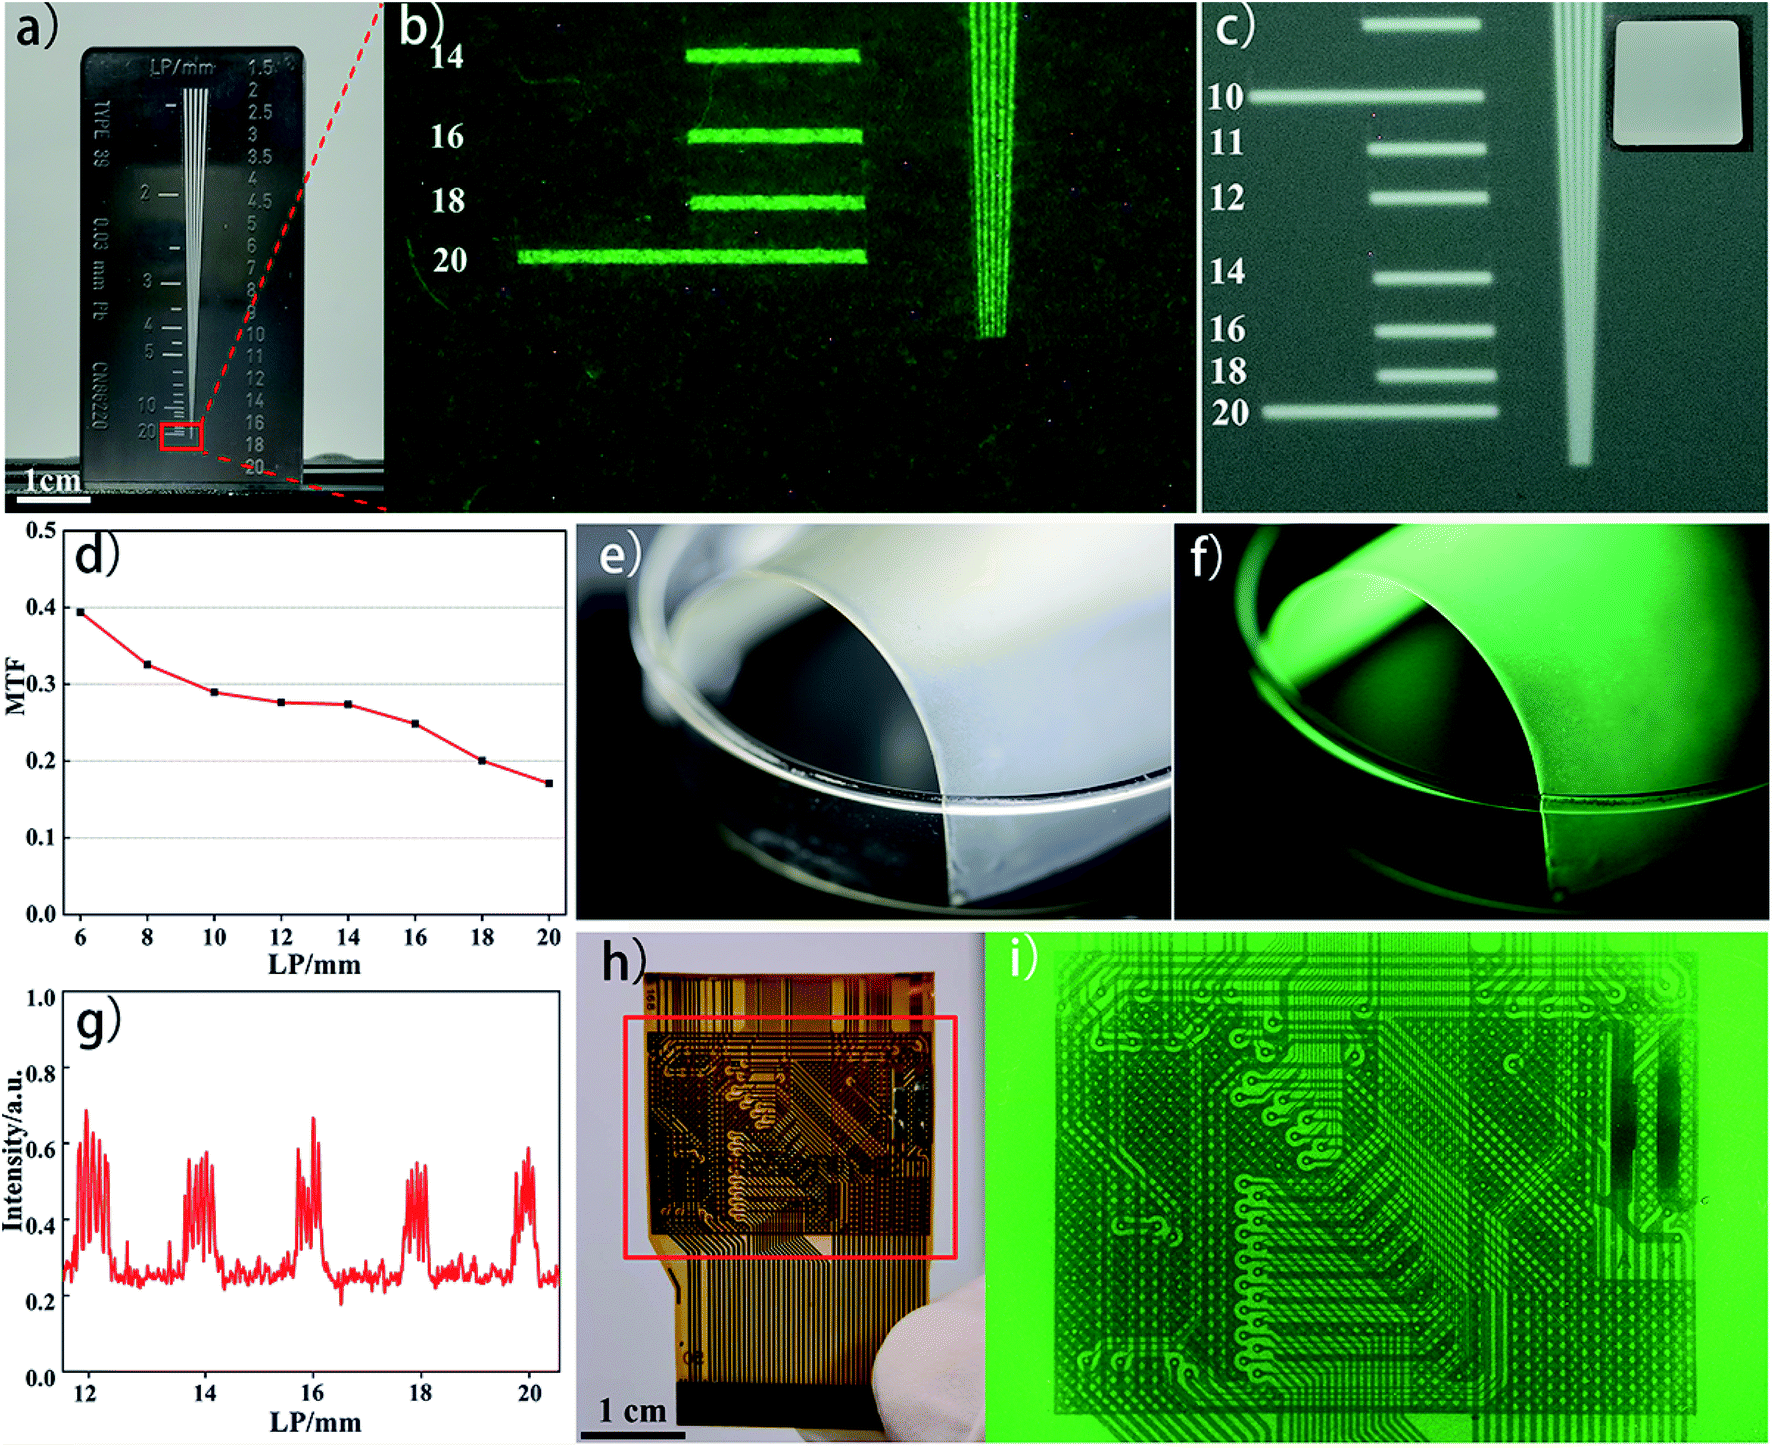 | ||
| Fig. 6 (a) The photograph of standard line–pair card (20 LP per mm). (b) Standard line-pair card image of LiLuF4:15%Tb NCs–EP composite film under X-ray irradiation. (c) Standard line-pair card image of commercial 135 μm thick CsI:Tl scintillation sheet under X-ray irradiation. The inset is the photograph of CsI:Tl scintillation sheet. (d) Modulation transfer function according to the composite film X-ray image resolution of measured line-pair pattern. (e) The photograph of flexible composite film under room light. (f) The photograph of flexible composite film under X-ray irradiation. (g) Standard line-pair card X-ray image grayscale function of pixels. (h) The photograph of flexible printed circuit (FPC). (i) The X-ray image of FPC under 9.6547 mGy s−1 X-ray irradiation. | ||
Conclusions
In conclusion, we have successfully synthesized multiple lanthanide-doped LiLuF4 nanocrystals by one-step thermal decomposition methods and characterized its performance in X-ray detection. This kind of nano scintillator has excellent radioluminescence properties, high X-ray sensitivity, low detection limit and good radiation damage resistance. A new kind of organic–inorganic scintillation films composite of LiLuF4 nanocrystalline and epoxy resin were prepared by direct coating and in situ polymerization method. This kind of thin film has good radioluminescence properties, and the RL peak position of the thin film is consistent with the LiLuF4:15%Tb nanocrystals. We further demonstrate the application of our composite film in X-ray imaging. This easily available composite film is capable of displaying a spatial resolution higher than 20 LP per mm, which is much better than commercial 135 μm CsI:Tl scintillation screen. Therefore, this work provides a new reference for nanocrystalline–polymer composite films for high quality X-ray imaging.Conflicts of interest
There are no conflicts to declare.Acknowledgements
This work was supported by the National Natural Science Foundation of China (No. 22075284, 51872287 and U2030118), Fund of National Engineering Research Centre for Optoelectronic Crystalline Materials (OCM-2020-02 and OCM-2020-03), Mindu Innovation Laboratory (2021ZR201) and Youth Innovation Promotion Association CAS (No. 2019304).Notes and references
- M. Béranger, N. Vallet, M. Dorel, P. Huet and K. Cadoret, Microelectron. Reliab., 2011, 51, 1801–1805 CrossRef.
- K. M. Nazarov, B. Muhametuly, E. A. Kenzhin, S. E. Kichanov, D. P. Kozlenko, E. V. Lukin and A. A. Shaimerdenov, Nucl. Instrum. Methods Phys. Res., Sect. A, 2020, 982, 164572 CrossRef CAS.
- N. Kalivas, I. Valais, D. Nikolopoulos, A. Konstantinidis, A. Gaitanis, D. Cavouras, C. D. Nomicos, G. Panayiotakis and I. Kandarakis, Appl. Phys. A: Mater. Sci. Process., 2007, 89, 443–449 CrossRef CAS.
- C. Michail, V. Koukou, N. Martini, G. Saatsakis, N. Kalyvas, A. Bakas, I. Kandarakis, G. Fountos, G. Panayiotakis and I. Valais, Crystals, 2020, 10, 429 CrossRef CAS.
- X. Liu and C. C. Shaw, Med. Phys., 2004, 31, 98–110 CrossRef PubMed.
- M. Nikl and A. Yoshikawa, Adv. Opt. Mater., 2015, 3, 463–481 CrossRef CAS.
- T. Martin, A. Koch and M. Nikl, MRS Bull., 2017, 42, 451–457 CrossRef.
- N. Kalyvas, P. Liaparinos, C. Michail, S. David, G. Fountos, M. Wójtowicz, E. Zych and I. Kandarakis, Appl. Phys. A: Mater. Sci. Process., 2011, 106, 131–136 CrossRef.
- Q. Chen, J. Wu, H. Yang and W. Huang, Nature, 2018, 561, 88–93 CrossRef CAS PubMed.
- Y. Zhang, R. Sun, X. Ou, K. Fu, Q. Chen, Y. Ding, L.-J. Xu, L. Liu, Y. Han, A. V. Malko, X. Liu, H. Yang, O. M. Bakr, H. Liu and O. F. Mohammed, ACS Nano, 2019, 13, 2520–2525 CrossRef CAS PubMed.
- K. R. K. Pushpendra, R. K. Kunchala, S. N. Achary and B. S. Naidu, ACS Appl. Nano Mater., 2019, 9, 5527–5537 CrossRef.
- K. R. K. Pushpendra, R. K. Kunchala, S. N. Achary, A. K. Tyagi and B. S. Naidu, Cryst. Growth Des., 2019, 19, 3379–3388 CrossRef.
- B. S. Naidu, M. Pandey, J. Nuwad, V. Sudarsan, R. K. Vatsa, R. J. Kshirsagar and C. G. S. Pillai, Inorg. Chem., 2011, 50, 4463–4472 CrossRef PubMed.
- B. S. Naidu, M. Pandey, V. Sudarsan, J. Ghatak and R. K. Vatsa, J. Nanosci. Nanotechnol., 2011, 4, 3180–3190 CrossRef PubMed.
- C. Liu, Z. Li, T. J. Hajagos, D. Kishpaugh, D. Chen and Q. Pei, ACS Nano, 2017, 11, 6422–6430 CrossRef CAS PubMed.
- W. G. Lawrence, S. Thacker, S. Palamakumbura, K. J. Riley and V. V. Nagarkar, IEEE Trans. Nucl. Sci., 2012, 59, 215–221 CAS.
- S. Sen, M. Tyagi, K. Sharma, P. S. Sarkar, S. Sarkar, C. B. Basak, S. Pitale, M. Ghosh and S. C. Gadkari, ACS Appl. Mater. Interfaces, 2017, 9, 37310–37320 CrossRef CAS PubMed.
- R. Cao, W. Wang, Y. Ren, Z. Hu, X. Zhou, Y. Xu, Z. Luo and A. Liang, J. Lumin., 2021, 235, 118054 CrossRef CAS.
- K. R. K. Pushpendra, S. Singh, S. Srinidhi, R. K. Kunchala, R. Kalia, S. N. Achary and B. S. Naidu, Cryst. Growth Des., 2021, 21, 4619–4631 CrossRef.
- B. S. Naidu, V. Sudarsan and R. K. Vatsa, J. Nanosci. Nanotechnol., 2009, 9, 2997–3004 CrossRef CAS PubMed.
- X. Ou, Y. Chen, L. Xie, J. Chen, J. Zan, X. Chen, Z. Hong, Y. He, J. Li and H. Yang, Anal. Chem., 2019, 91, 10149–10155 CrossRef CAS PubMed.
- X. Xie, N. Gao, R. Deng, Q. Sun, Q. H. Xu and X. Liu, J. Am. Chem. Soc., 2013, 135, 12608–12611 CrossRef CAS PubMed.
- J. Liu, H. Rijckaert, M. Zeng, K. Haustraete, B. Laforce, L. Vincze, I. Van Driessche, A. M. Kaczmarek and R. Van Deun, Adv. Funct. Mater., 2018, 28, 1707365 CrossRef.
- Z. Du, X. Zhang, Z. Guo, J. Xie, X. Dong, S. Zhu, J. Du, Z. Gu and Y. Zhao, Adv. Mater., 2018, 30, 1804046 CrossRef PubMed.
- X. Ou, X. Qin, B. Huang, J. Zan, Q. Wu, Z. Hong, L. Xie, H. Bian, Z. Yi, X. Chen, Y. Wu, X. Song, J. Li, Q. Chen, H. Yang and X. Liu, Nature, 2021, 590, 410–415 CrossRef CAS PubMed.
- L. Fang, X. Zhou, J. Zhang, H. Xia, B. Chen and H. Song, J. Mater. Sci.: Mater. Electron., 2020, 31, 3405–3414 CrossRef CAS.
- C.-H. Elena, K. Sascha, W. M. Philip and K. Christian, Laser Photonics Rev., 2020, 14, 1900229 CrossRef.
- E. Sarantopoulou, Z. Kollia and A. C. Cefalas, Microelectron. Eng., 2002, 61–62, 133–138 CrossRef CAS.
- E. Sarantopoulou, Z. Kollia, A. C. Cefalas, V. V. Semashko, R. Y. Abdulsabirov, A. K. Naumov and S. L. Korableva, Opt. Commun., 1998, 156, 101–111 CrossRef CAS.
- G. Bolognesi, D. Parisi, D. Calonico, G. A. Costanzo, F. Levi, P. W. Metz, C. Krankel, G. Huber and M. Tonelli, Opt. Lett., 2014, 39, 6628–6632 CrossRef CAS PubMed.
- B. Zhou, B. Xu, H. He, Z. Gu, B. Tang, Y. Ma and T. Zhai, Nanoscale, 2018, 10, 2834–2840 RSC.
- F. Wang, R. Deng and X. Liu, Nat. Protoc., 2014, 9, 1634–1644 CrossRef CAS PubMed.
- S. Alamdari, M. Sasani Ghamsari and M. J. Tafreshi, Prog. Nucl. Energy, 2020, 130, 103495 CrossRef CAS.
- Z. Wang, X. Xu, S. Wang, H. Xu, W. Xu, Q. Zeng, G. Deng, Y. Jiang and S. Wu, Chem.–Eur. J, 2021, 27, 9071–9076 CrossRef CAS PubMed.
- P. Huang, W. Zheng, S. Zhou, D. Tu, Z. Chen, H. Zhu, R. Li, E. Ma, M. Huang and X. Chen, Angew. Chem., Int. Ed., 2014, 53, 1252–1257 CrossRef CAS PubMed.
- H. Althues, J. Henle and S. Kaskel, Chem. Soc. Rev., 2007, 36, 1454–1465 RSC.
- S. Manjunatha, R. Hari Krishna, T. Thomas, B. S. Panigrahi and M. S. Dharmaprakash, Mater. Res. Bull., 2018, 98, 139–147 CrossRef CAS.
- K. V. Ezirmik, Mater. Res. Express, 2021, 8, 016407 CrossRef CAS.
- Y. Zhang, N. Ding, T. Zheng, S. Jiang, B. Han and J. Lv, J. Non-Cryst. Solids, 2016, 441, 74–78 CrossRef CAS.
- H. Zhang, G. Dun, Q. Feng, R. Zhao, R. Liang, Z. Gao, T. Hirtz, M. Chen, X. Geng, M. Liu, Y. Huang, X. Zheng, K. Qin, X. Tan, X. Wang, D. Xie, Y. Yang, H. Tian, Y. Zhou, N. P. Padture, X. Wang, J. Hong and T.-L. Ren, IEEE Trans. Electron Devices, 2020, 67, 3191–3198 CAS.
- Z. Zeng, B. Huang, X. Wang, L. Lu, Q. Lu, M. Sun, T. Wu, T. Ma, J. Xu, Y. Xu, S. Wang, Y. Du and C. H. Yan, Adv. Mater., 2020, 32, e2004506 CrossRef PubMed.
- D. D. Brullmann and B. d'Hoedt, Dentomaxillofac Rad., 2011, 40, 222–229 CrossRef CAS PubMed.
Footnote |
| † Electronic supplementary information (ESI) available. See doi: 10.1039/d1ra08989g |
| This journal is © The Royal Society of Chemistry 2022 |