
 Open Access Article
 This Open Access Article is licensed under a Creative Commons Attribution-Non Commercial 3.0 Unported Licence
Organically tuned white-light emission from two zero-dimensional Cd-based hybrids†
Rawia Msalmia,
Slim Elleuchb,
Besma Hamdic,
Wesam Abd El-Fattahde,
Naoufel Ben Hamadidf and
Houcine Naïli *a
*a
aLaboratory of Physico Chemistry of the Solid State, Department of Chemistry, Faculty of Sciences of Sfax, Sfax University, Sfax, Tunisia. E-mail: houcine_naili@yahoo.com
bLaboratory of Applied Physics, Department of Physics, Faculty of Sciences of Sfax, Sfax University, Sfax, Tunisia
cLaboratory of Materials Science and Environment, Department of Chemistry, Faculty of Sciences of Sfax, Sfax University, Sfax, Tunisia
dChemistry Department, College of Science, IMSIU (Imam Mohammad Ibn Saud Islamic University), Riyadh 11623, kingdom of Saudi Arabia
eDepartment of Chemistry, Faculty of Science, Port-Said University, Port-Said, Egypt
fLaboratory of Heterocyclic Chemistry, Natural Products and Reactivity (LR11ES39), Team: Medicinal Chemistry and Natural Products, Faculty of Science of Monastir, University of Monastir, Avenue of Environment, 5019 Monastir, Tunisia
First published on 5th April 2022
Abstract
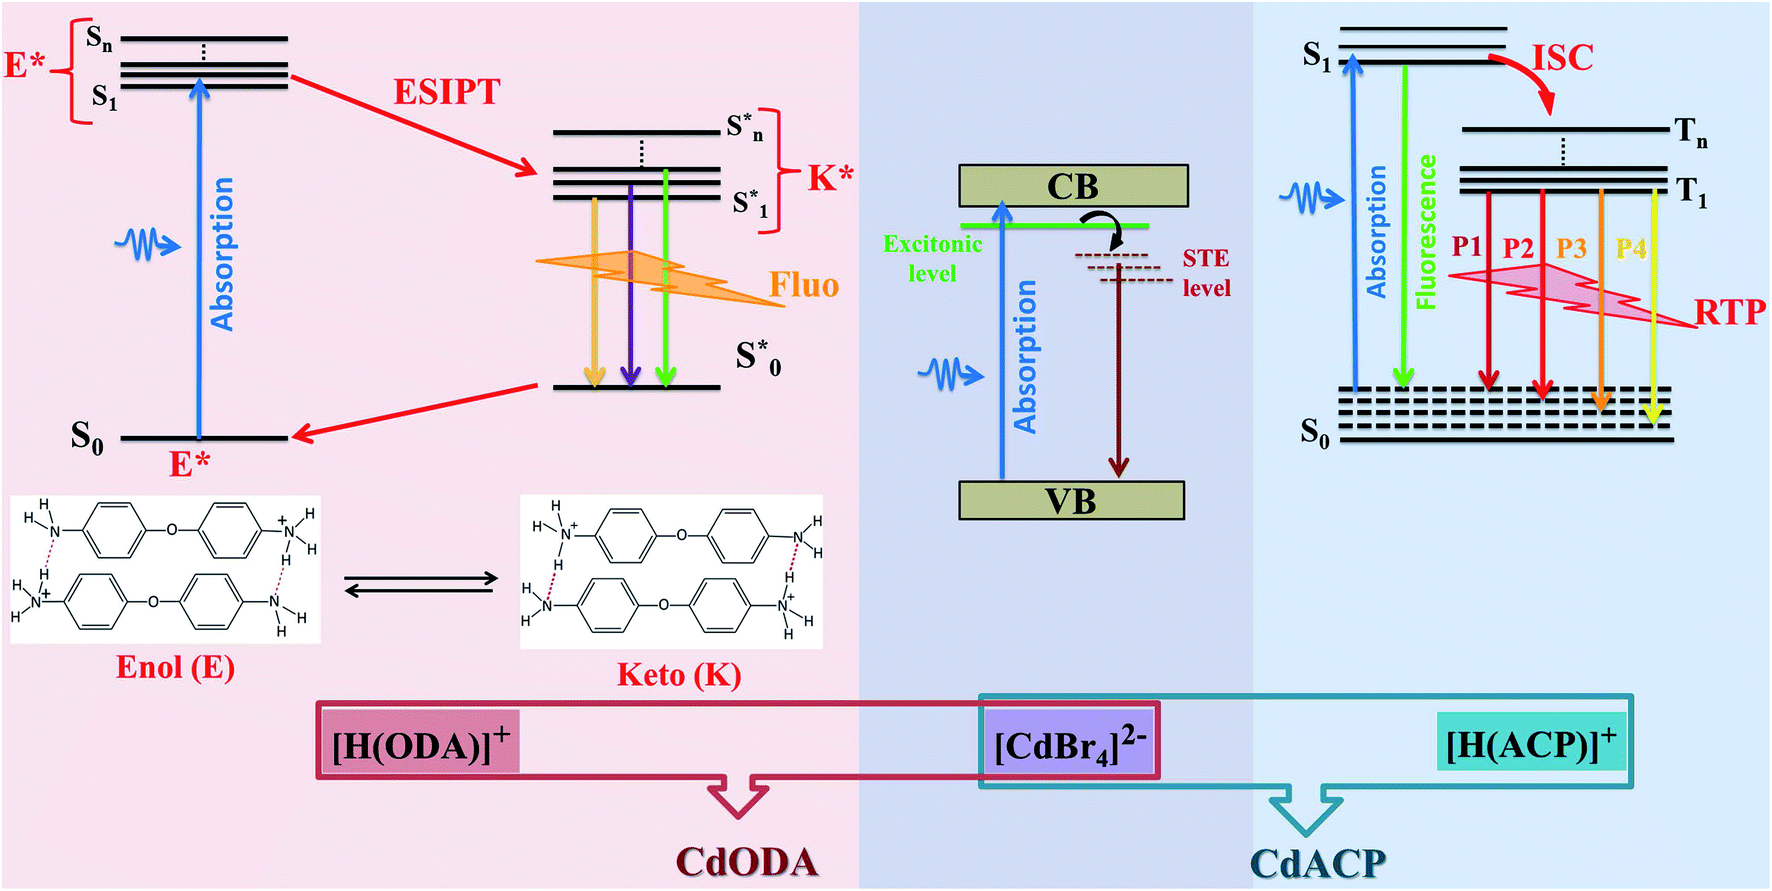
In this work, we report two zero-dimensional Cd-based hybrid compounds, denoted CdACP and CdODA, where the Cd atoms adopt tetrahedral geometry. The optical analysis reveals that these materials are classified as wide-gap semi-conductors which makes them suitable for optoelectronic applications. The photoluminescence analysis proves the wavelength dependent white-light emission behavior of the investigated materials. The structural-optical property studies show that, thanks to the heavy halide effect, the CdACP exhibits both fluorescence and room temperature phosphorescence through harvesting triplet states. Meanwhile, in contrast to CdACP, the white light emission from CdODA is purely fluorescence in nature. In fact, within CdODA, both C–H⋯π and N–H⋯N interactions facilitate the intramolecular proton transfer (ESIPT) between the different cations which leads to ultra-fast fluorescence through excited state ESIPT. Under sub-gap excitations, the inorganic sub-lattice is responsible for the blue-green emission through the STE mechanism, while the organic cations contribute by an intense red emission.
Introduction
In addition to their pertinent magnetic,1–8 catalytic9–12 and biological9,13–15 properties, organic–inorganic molecular hybrid materials (OIMHMs) exhibit excellent performance in solid-state emitter sources16,17 as well as in photovoltaic solar cells.18–21 Due to their wide band gap energy, low dimensional hybrid compounds are effectively used for optoelectronic devices such as light emitting and diode photo-detectors.16,22–24 In fact, the low dimensionality of the inorganic sub-lattice creates a multi quantum-well electronic structure which leads to the increase of the band gap energy.25 In particular, one- and two-dimensional Cd- and Pb-based OIMHMs are extensively investigated as solid-state white-light emitters.26–33 These materials are characterized by broad emission band covering the UV-Vis region that originates from self-trapped excitons (STE) confined within the inorganic octahedra. Recent reports revealed that the white-light emission (WLE) from tetrahedral and octahedral zero-dimensional OIMHMs was successfully observed.34–36 On the other side, the world of organic molecular materials (OMMs) presents an efficient solution for occurring WLE thanks to their efficient room temperature phosphorescence (RTP) and/or fluorescence emission.37 Depending on the organic components nature and intermolecular contacts types, the light emissions from these supramolecular assemblies originate from different photo-physical processes such as triplet-state harvesting, inter/intramolecular-charge-transfer (CT) and excited-state intramolecular proton transfer (ESIPT).37–42 Newly, the X−⋯π+ interactions between the halide ions (X = Br, I) and the positively charged ring was used to achieve organic RTP-active white light emitters. In fact, such interaction enhance the SOC (spin orbit coupling) and then, promote the ISC (intersystem crossing) harnessing the triplet excitons.17,43–45 Recently, this new strategy was successfully used to achieve RTP in OIMHMs.46–48 The zero-dimensional (0-D) Cd-based OIMHMs demonstrate relevant photoluminescent properties.49 While the (CH3NH3)2CdBr4 exhibits an emission band centred at 415 nm, with full width at half-maximum (fwhm) of 94 nm, the (CH3NH3)2CdCl4 and (CH3NH3)2CdI4 display broad emission band between 360 and 810 nm with fwhm of 208 nm and 203 nm, respectively.34 These observed PL bands of these tetrahedral compounds, (CH3NH3)2CdX4, have been assigned to the STE.34 In particular, 0-D Cd-based OIMHMs with aromatic organic molecules reveal broad-band white light emission where the origin of the photoluminescence still ambiguous. In fact, in contrast to the (C6(CH3)5CH2N(CH3)3) CdBr4 where the white light emission was assigned to the STE within CdBr4 tetrahedra,33 the emission observed from the (Ph4P)2CdBr4 was assigned to the high fluorescence and the weak RTP of the organic moieties.50 In 2020, S. Liu et al. revealed the fluorescence and RTP of a series of 0-D Cd-based compounds (Ph4P)2CdX4 and (Ph4P)2Cd2X6 (X = Br and Cl). This report proves the relevant role of the intermolecular contacts as well as the halogen nature in the PL performance of these compounds. For example, the RTP of (Ph4P)2CdBr4 is weaker than that observed from (Ph4P)2Cd2Br6 and this difference is attributed to the fact that the distance between the Ph4P+ organic cations is larger in (Ph4P)2CdBr4.50 The origin of RTP usually involves a radiative transition between the excited triplet states and singlet states. The WLE from organic emitters established by ESIPT process is characterized with fast fluorescence. Recent researches on organic fluorescent materials shows that, within the supramolecular structures, the different intermolecular interactions such as inter/intramolecular hydrogen bonds, T-shaped CH⋯π and cation⋯π interactions enhance the ESIPT mechanism.51–53 The observed fluorescence based on ESIPT process results from the transition from the different excited singlet state to the ground excited singlet state. Hence, photoluminescence performances of OIMHMs can be easily tailored by tuned supramolecular assembly modes.54 Fluorescent and phosphorescent materials have received great attention due to their application in biological imaging,55,56 optical anti-counterfeiting,57,58 sensors,59,60 LED40,61,62 and so on. The emitted white light resulting from RTP exhibits higher performance than that resulting from the fluorescent counterparts. In fact, the sufficient utilization of the triplet-states energy leads to WLE with ultra-long lifetime and enables the emitter material to be applied in WLE with advantages of high-energy conversion efficiency.47,63–65For white light emitters, the CRI reflects the ability of a light source to render colors of an object compared with day-light.66,67 A light source with a CRI above 70 is considered adequate for interior illumination, while that upper 80 would be considered good and that above 90 would be excellent.66 White-light emitting source with a CRI above 90 is suitable for the high level applications like surgery and photography, while, that of a CRI of about 80 is satisfactory for the human eye.67
Currently, the solid state lighting applications and the fabrication of WLED suffer from the deficiency of the emission in the red region which generates WLE with low CRI. This low efficiency of red emission constitutes an obnoxious problem for the commercialization of lighting devices.68–72 In the present paper, two tetrahedral zero-dimensional Cd-based hybrids CdACP and CdODA are reported. The solid-states photoluminescence measurements along with the structural studies reveal that the CdACP exhibits WLE through RTP thanks to the Br−⋯π+ interactions. For the CdODA the WLE originates from the fluorescence of the organic sub-network resulting from ESIPT. The inorganic CdBr4 anions contribute to the white-light emission through the STE process. Both synthesized compounds are characterized by an intense emission in the red region which leads to WLE with extra-high CRI above 90.
Experimental section
Crystal growth and X-ray diffraction
The [H(ACP)]2CdBr4·H2O (ACP = C5H6N2Cl = 4-amino-2-chloropyridine) crystals were synthesized in two steps. The first step was the preparation of the ammonium salt (4-amino-2-chloropyridinium bromide: [HACP]+·Br−) by addition of an aqueous solution of HBr (48%) to the ACP. The desired compound was synthesized in the second step dissolving a stoichiometric amounts of the obtained [HACP]+·Br− salt and CdBr2·2H2O in 10 ml of ethanol. After several days, white transparent crystals were obtained by slow evaporation at room temperature with sample percent yield of 78%.For the preparation of CdODA, the following commercially available starting materials were used without further purification: ODA![[thin space (1/6-em)]](https://www.rsc.org/images/entities/char_2009.gif) :C12H12N2O (98%), CdBr2·2H2O (98%) and HBr (48%). A single crystal of CdODA was prepared by dissolving respectively 0.889 g of ODA (4.43 mmol) in ethanol with 0.683 g of CdBr2·2H2O (2.215 mmol). Then, 0.5 ml of an aqueous solution of HBr (4.43 mmol, 48%) were added. The obtained solution was heated to 60 °C. Light brown crystals of CdODA were obtained, by room temperature slow evaporation, with sample percent yield of 73%. Measuring diffracted intensities was carried out at the temperature T = 296 K, on a diffractometer Kappa Apex II using Mo-Kα radiation (λ = 0.71073 Å) and all reflections were executed from the WINGX program.73 The structures were solved and refined using SHELXS97 (ref. 74) and SHELXL97 (ref. 75) programs. Geometrical calculations were performed using PLATON.76 Given the good quality of intensity, we were able to locate the hydrogen atoms geometrically using HFIX statement. The molecular drawings were generated through the use of DIAMOND,77 Crystal Explorer 3.0 (ref. 78) and mercury 3.1 (ref. 79) programs. The examination of the obtained crystals using polarizing microscope shows uniform morphologies of mono-crystals having a single characteristic color (Fig. S1†). The elemental (C·H·N) as well as the halogens analyses were performed to confirm the composition of the synthesized compounds. The obtained experimental values (Exp. (%)) are tabulated in Table 1 and the convergence of theoretical values (Theo. (%)) with the practical ones confirms the structural molecular formula of the compound.
:C12H12N2O (98%), CdBr2·2H2O (98%) and HBr (48%). A single crystal of CdODA was prepared by dissolving respectively 0.889 g of ODA (4.43 mmol) in ethanol with 0.683 g of CdBr2·2H2O (2.215 mmol). Then, 0.5 ml of an aqueous solution of HBr (4.43 mmol, 48%) were added. The obtained solution was heated to 60 °C. Light brown crystals of CdODA were obtained, by room temperature slow evaporation, with sample percent yield of 73%. Measuring diffracted intensities was carried out at the temperature T = 296 K, on a diffractometer Kappa Apex II using Mo-Kα radiation (λ = 0.71073 Å) and all reflections were executed from the WINGX program.73 The structures were solved and refined using SHELXS97 (ref. 74) and SHELXL97 (ref. 75) programs. Geometrical calculations were performed using PLATON.76 Given the good quality of intensity, we were able to locate the hydrogen atoms geometrically using HFIX statement. The molecular drawings were generated through the use of DIAMOND,77 Crystal Explorer 3.0 (ref. 78) and mercury 3.1 (ref. 79) programs. The examination of the obtained crystals using polarizing microscope shows uniform morphologies of mono-crystals having a single characteristic color (Fig. S1†). The elemental (C·H·N) as well as the halogens analyses were performed to confirm the composition of the synthesized compounds. The obtained experimental values (Exp. (%)) are tabulated in Table 1 and the convergence of theoretical values (Theo. (%)) with the practical ones confirms the structural molecular formula of the compound.
| Element | CdACP | CdODA | ||
|---|---|---|---|---|
| Exp. (%) | Theo. (%) | Exp. (%) | Theo. (%) | |
| C | 16.54(3) | 16.93 | 32.18(3) | 34.44 |
| H | 1.46(3) | 1.98 | 2.96(3) | 3.13 |
| N | 7.23(3) | 7.89 | 6.43(3) | 6.61 |
| Br | 43.98(5) | 45.06 | 37.84(6) | 38.32 |
Optical characterizations
Optical diffuse reflectance measurements were performed on a Varian Cary 5000 UV-Vis-NIR spectrophotometer operating in the 200–1000 nm region at room temperature. Steady-state photoluminescence spectra were recorded using HORIBA FluoroMax spectrophotometer equipped with a 150 W Xenon lamp. The temperature-dependent emission spectra were collected using a Horiba-Jobin Yvon HR 320 spectrophotometer where the sample was placed in a Janis closed cycle cryostat. Time-resolved emission data were recorded at room temperature using EasyLife X (HORIBA Scientific) system. The chromaticity coordinates, CRI and CCT of the emitted light at different excitations wavelengths were calculated using the ColorCalculator (version 7.7) by OSRAM Sylvania, Inc.Results and discussion
Description of the crystal structures
In this paper, tow structures are discussed: the [H(ACP)]2CdBr4·H2O (ACP = C5H6N2Cl = 4-amino-2-chloropyridine) and the [H(ODA)]2CdBr4 (ODA = C12H13N2O = 4,4′-oxydianiline). As the CdACP's structure has previously been studied,80 the focus of our structural discussion was on the new CdODA material. However, during this structural description, a comparison between these two supramolecular crystals structures is reported. As shown in Fig. 1, the CdACP and CdODA structures feature both isolated tetrahedral [CdBr4]2− anions separated by organic cations.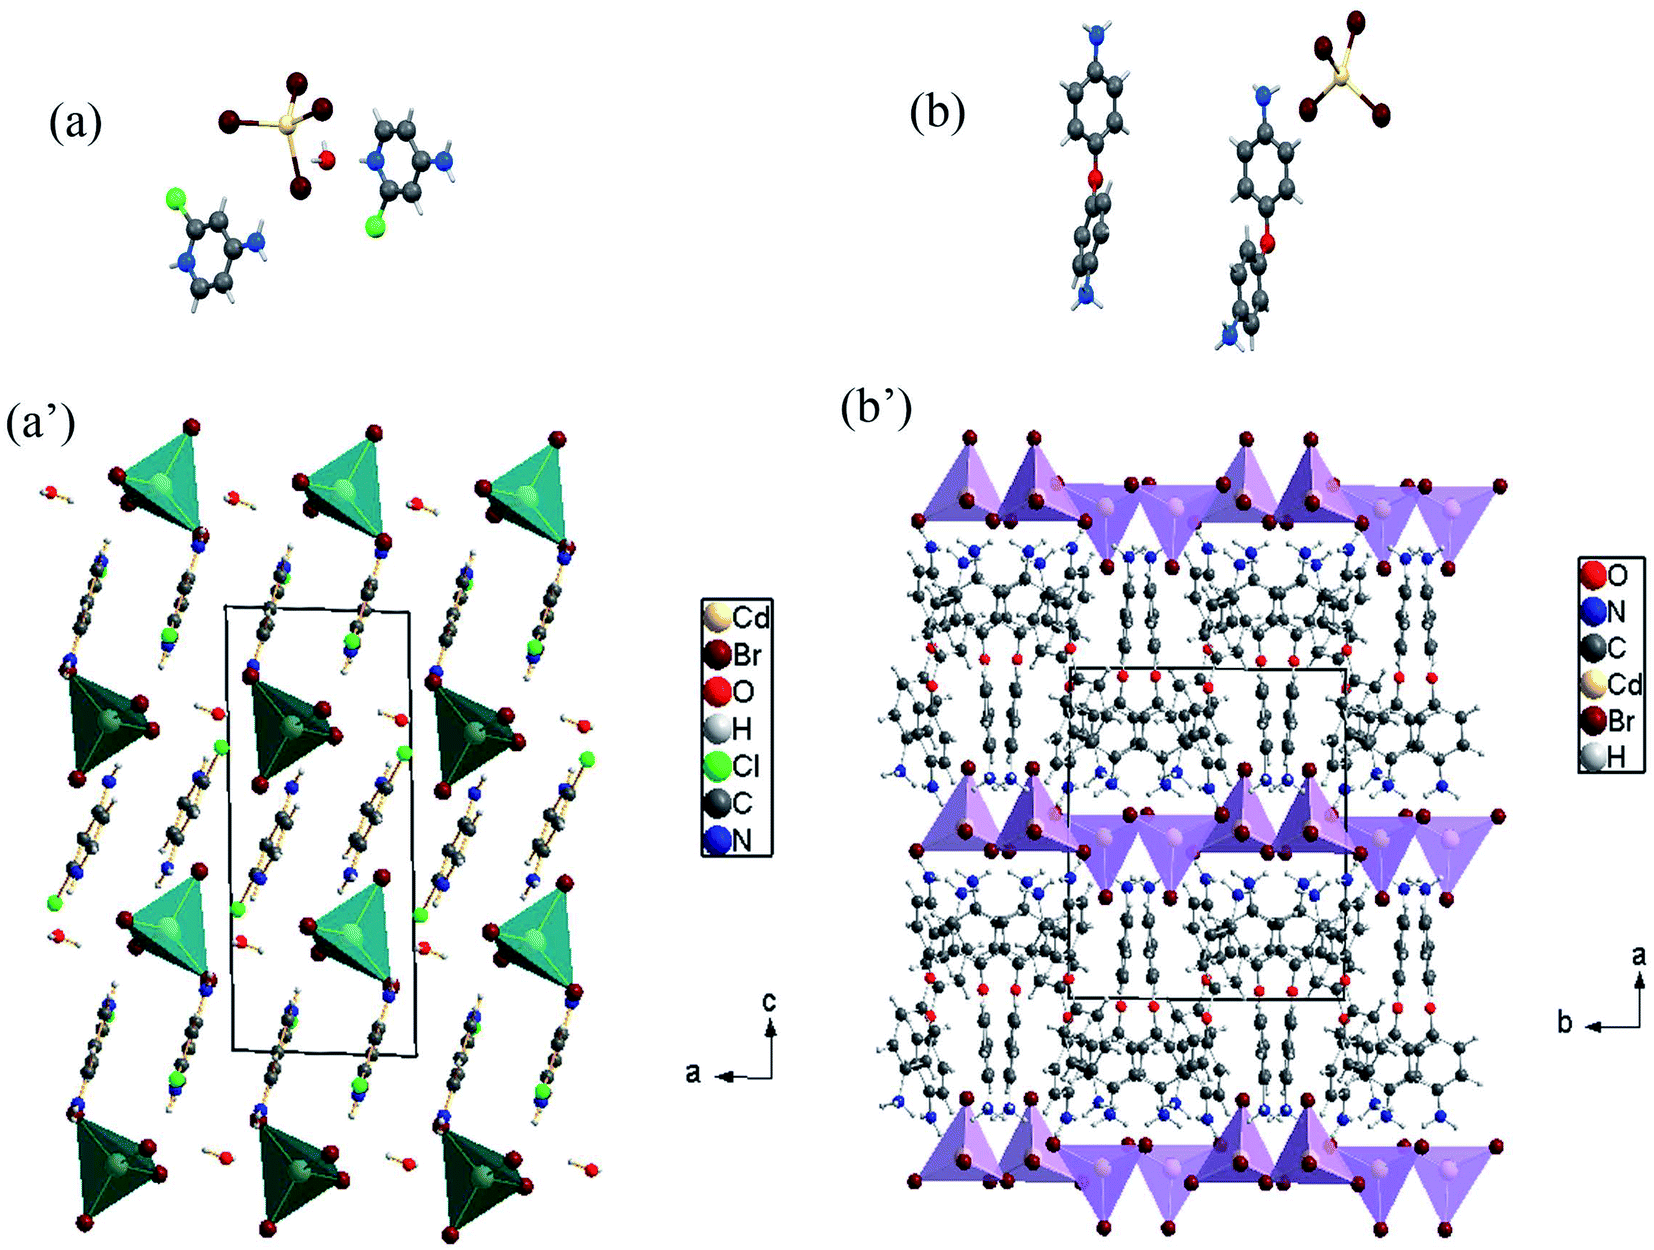 | ||
| Fig. 1 Asymmetric units and structure projection of CdACP ((a) and (a′)) and CdODA ((b) and (b′)). | ||
As reported in our previous work,80 the 3D packing of CdACP is ensured by H-bonds and π–π interactions. Detailed descriptions of the π–π interactions, with the corresponding centroid to centroid distances, between the organic molecules are illustrated in Fig. S2.†
The interaction between organic and inorganic moieties is stabilized by the Br⋯π+ electrostatic interaction between the bromine anion and the positively charged ring (Fig. 2) with Cg–Br distance of 3.77 Å.
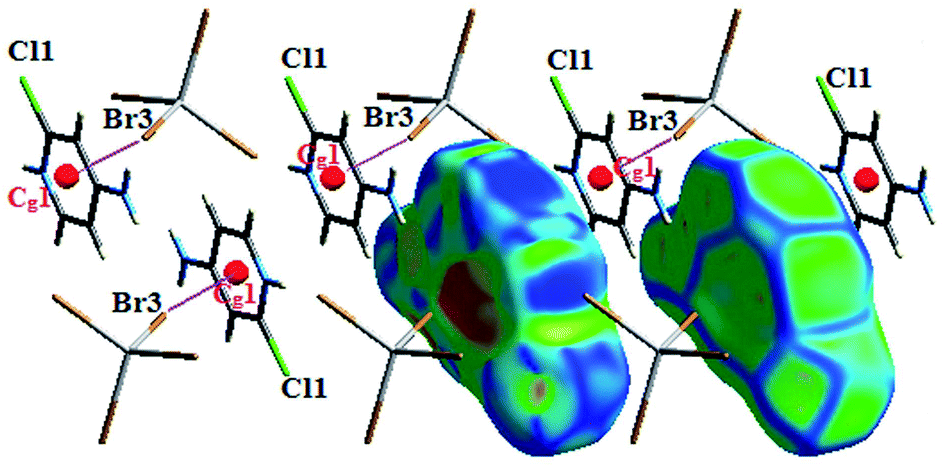 | ||
| Fig. 2 π+⋯Br− interactions within CdACP. | ||
The organic part is constituted by two isomers [C12H13N2O]+. The first isomer named [H(ODA)]+ (1) is characterized by a torsion angle C5–C6–O1–C7 = −97.0(7)° and C6–O1–C7 = 118.4(4)°. As for the second isomer named [H(ODA)]+ (2), the torsion angle C16–C18–O2–C19 = −54.2(10)° and C18–O2–C19 = 121.3(5)°.
There are extensive anions-cations intermolecular interactions through N–H⋯Br and C–H⋯Br hydrogen bonding involving Br− of [CdBr4]2− anions, –NH2 groups, –NH3+ groups and C23–H23 where H⋯Br distances of N–H⋯Br interactions are in the range of 2.57–2.89 Å and H23⋯Br4 = 2.91 Å. Organic cations are linked together by H2N+–H⋯NH2 and C–H⋯π interactions (Fig. 3) where H⋯N interactions are the shortest hydrogen bonds with H2B⋯N3 = 2.34 Å and H4B⋯N1 = 1.94 Å.
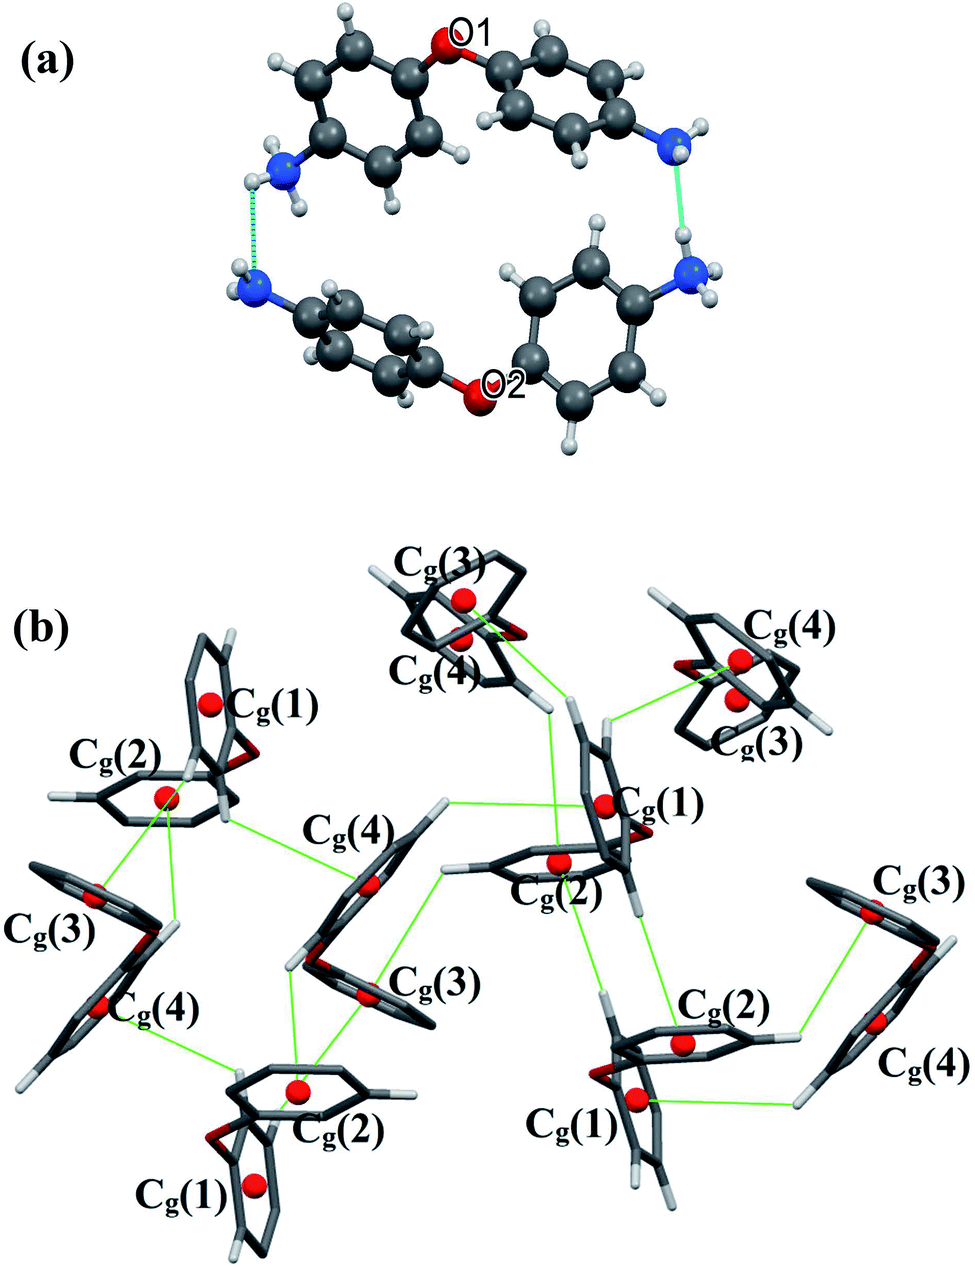 | ||
| Fig. 3 N–H⋯N (a) and C–H⋯π (b) interactions within CdODA structure. | ||
All C–H⋯π interactions are visualized in the projection of the organic part in (Fig. 3(b)) (only rings and hydrogen atoms which participate in C–H⋯π contacts are visualized for the clarity of the figure). This projection shows that [H(ODA)]+ (1) is connected to four other neighbour organic molecules via C–H⋯π interactions, and [H(ODA)]+ (2) is connected to three neighbor [H(ODA)]. Hence, the solid-state structure of CdODA includes a combination of intermolecular N–H⋯N, N–H⋯Br, C–H⋯Br and C–H⋯π hydrogen bonds. Table S2† displays all the geometric data of hydrogen bonds and Fig. S3† shows all hydrogen bonds within CdODA.
The Hirshfeld surfaces of the title compound are illustrated in Fig. S4† showing surfaces of each molecule of the asymmetric unit that have been mapped over dnorm range −0.2 Å to 0.9 Å. The red spots visible on Hirshfeld surfaces with dnorm present H⋯Br and H⋯N hydrogen bonds that are observed in Table S2.†
It also appear on the surface mapped with Shape Index as red concave regions around the H-acceptor atom and its corresponding blue regions are around the H-donor as depicted in Fig. S5 and S6.† The C⋯H interactions, between aromatic rings of organic molecules, result from combination of C⋯H short contacts (with C⋯H distances are in the order of the sum of van der Waals radius of carbon and hydrogen atoms (2.9 Å)) and the non-conventional π⋯H–C hydrogen bonds. The studies of this interaction types and the molecular environment of each cation indicate that for [H(ODA)]+ (1) the red spots (a), (b) and (e) presented on Shape Index Hirshfeld surface in Fig. S5† illustrate Cg(2)⋯H21–C21, Cg(1)⋯H22–C22 and Cg(2)⋯H5–C5 interactions, respectively, where Cg(1) and Cg(2) act as hydrogen bonds acceptors. In addition, the spots (d) and (f) refer to C11⋯H17 and C5⋯H14 interactions, respectively, which are the two shortest C⋯H contacts generated by PLATON with d(C11⋯H17) = 2.9277 Å and d(C5⋯H14) = 2.8630 Å. For [H(ODA)]+ (2), the red spots (a), (b) and (c) in Fig. S6† result from Cg(4)⋯H4–C4, Cg(3)⋯H10–C10 and Cg(3)⋯H2–C2 interactions, respectively.
To quantify individual contributions of intermolecular interactions involved within the structure, the 2D fingerprint plots were decomposed. The detailed analysis of the 2D fingerprint plots of [H(ODA)]+ molecules and [CdBr4]2− is reported in the ESI (Fig. S7–S9).†
Optical properties
In this section the absorption features of the synthesized material were studied in term of Kubelka–Munk absorption (F(R)) obtained using eqn (1) (where R is the reflectance of the sample) which translates the measured reflectance spectrum into absorption spectrum.
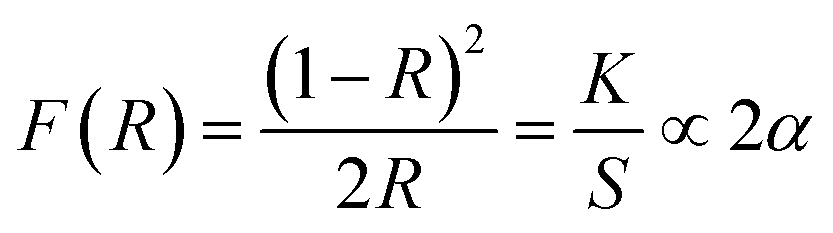 | (1) |
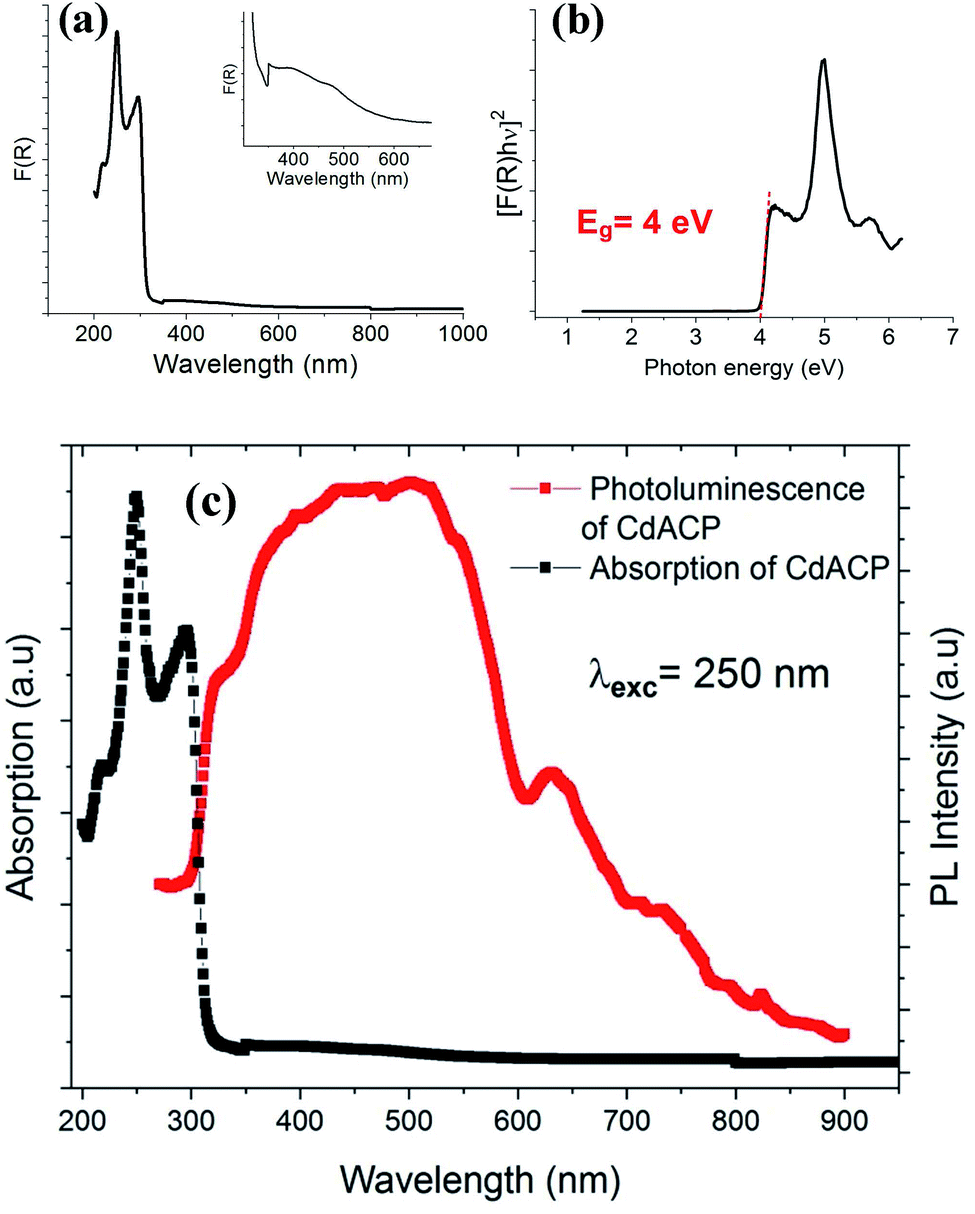 | ||
| Fig. 4 Absorption spectrum (a), Tauc plot for the direct gap (b) and, absorption and PL spectra (c) of CdACP. | ||
In fact, the use of the 4-amino-2-chloropyridinium as cation suggests an intense broad emission resulting from both fluorescence and phosphorescence mechanisms. Recent studies on organic white light emitters demonstrated that the ISC is effectively enhanced by nucleophilic aromatic addition with halogen atoms (especially Cl or Br) to improve the RTP.81,82 On the other hand, the Br−⋯π+ interactions promote the ISC through triplet state harvesting and then, generate the RTP.17,50 In our recent paper that studied the RTP phosphorescence from the 110-oriented perovskite (C3H8N6)[PbBr4],17 we theoretically demonstrated the effect of the Br−⋯π+ interaction on the triplet states of the protonated organic ring, containing heteroatoms, and the emission from the triplet states was confirmed. Hence, the coexistence of these two efficient strategies previously used for RTP stabilization suggests the RTP nature of the emission from CdACP. The temperature dependence emission spectrum measurement was performed to probe the thermally activated luminescence processes of CdACP using a laser excitation of 375 nm (3.3 eV). As shown in Fig. 5(a), significant temperature-dependent luminescence changes were revealed. It is known about that the emission from molecular crystals is highly sensitive to temperature variation, so that increasing temperature provokes intensification of molecular rotations and vibrations, thereby increasing the molecular vibrations and non-radiative loss. This is the so called thermal quenching effect. Inversely, decreasing temperature obstructs the molecular vibration which increases the radiative transitions.83,84 These thermal effects are obstacles to luminescent efficiency and restrict the practical suitability of phosphorescent materials for applications at high temperature. Therefore, obtaining thermal quenching resistant hybrid materials remains a challenge.
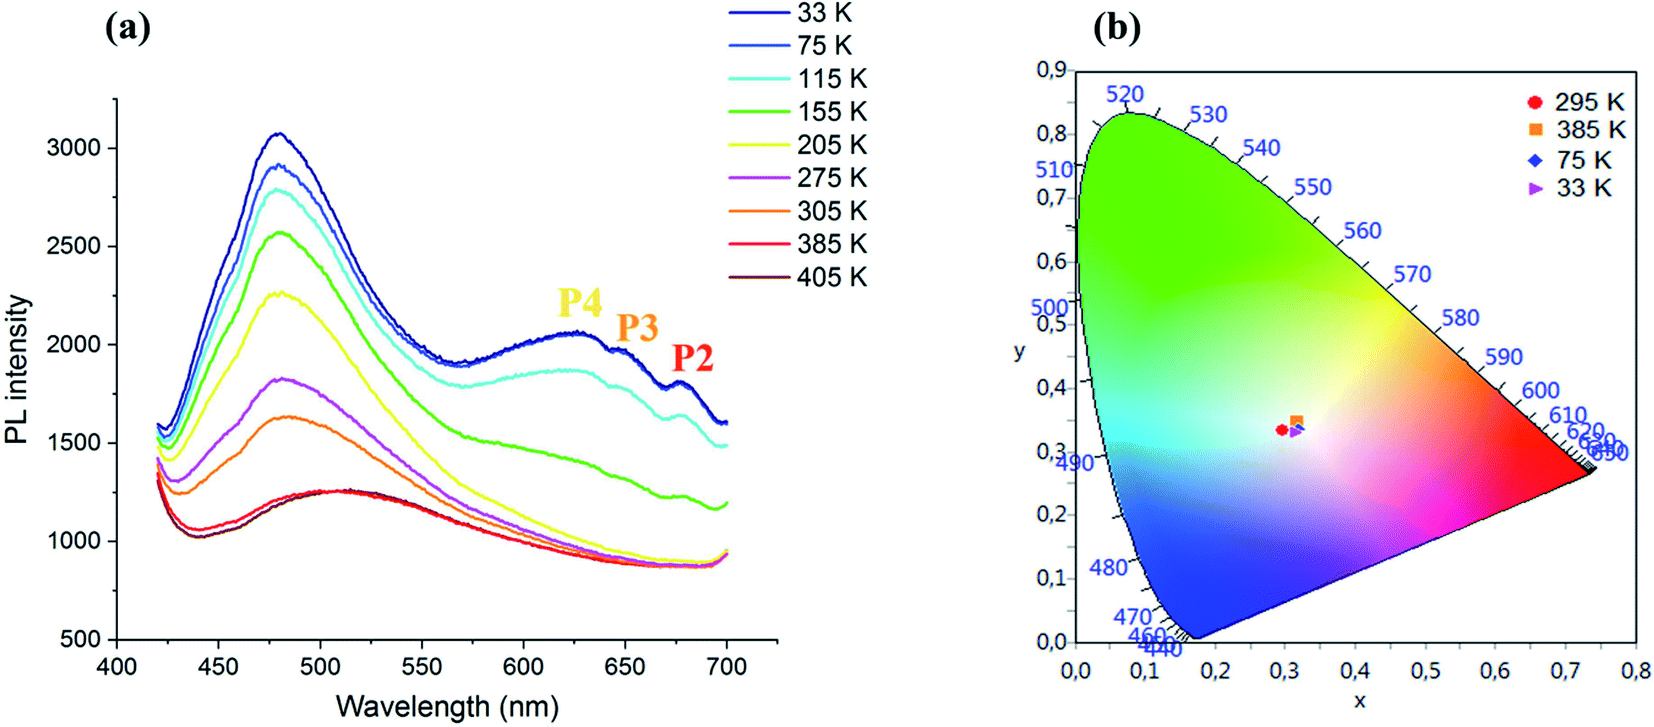 | ||
| Fig. 5 (a) Temperature dependence of the PL spectrum of CdACP under 375 nm and (b): color coordinates of the emitted light. | ||
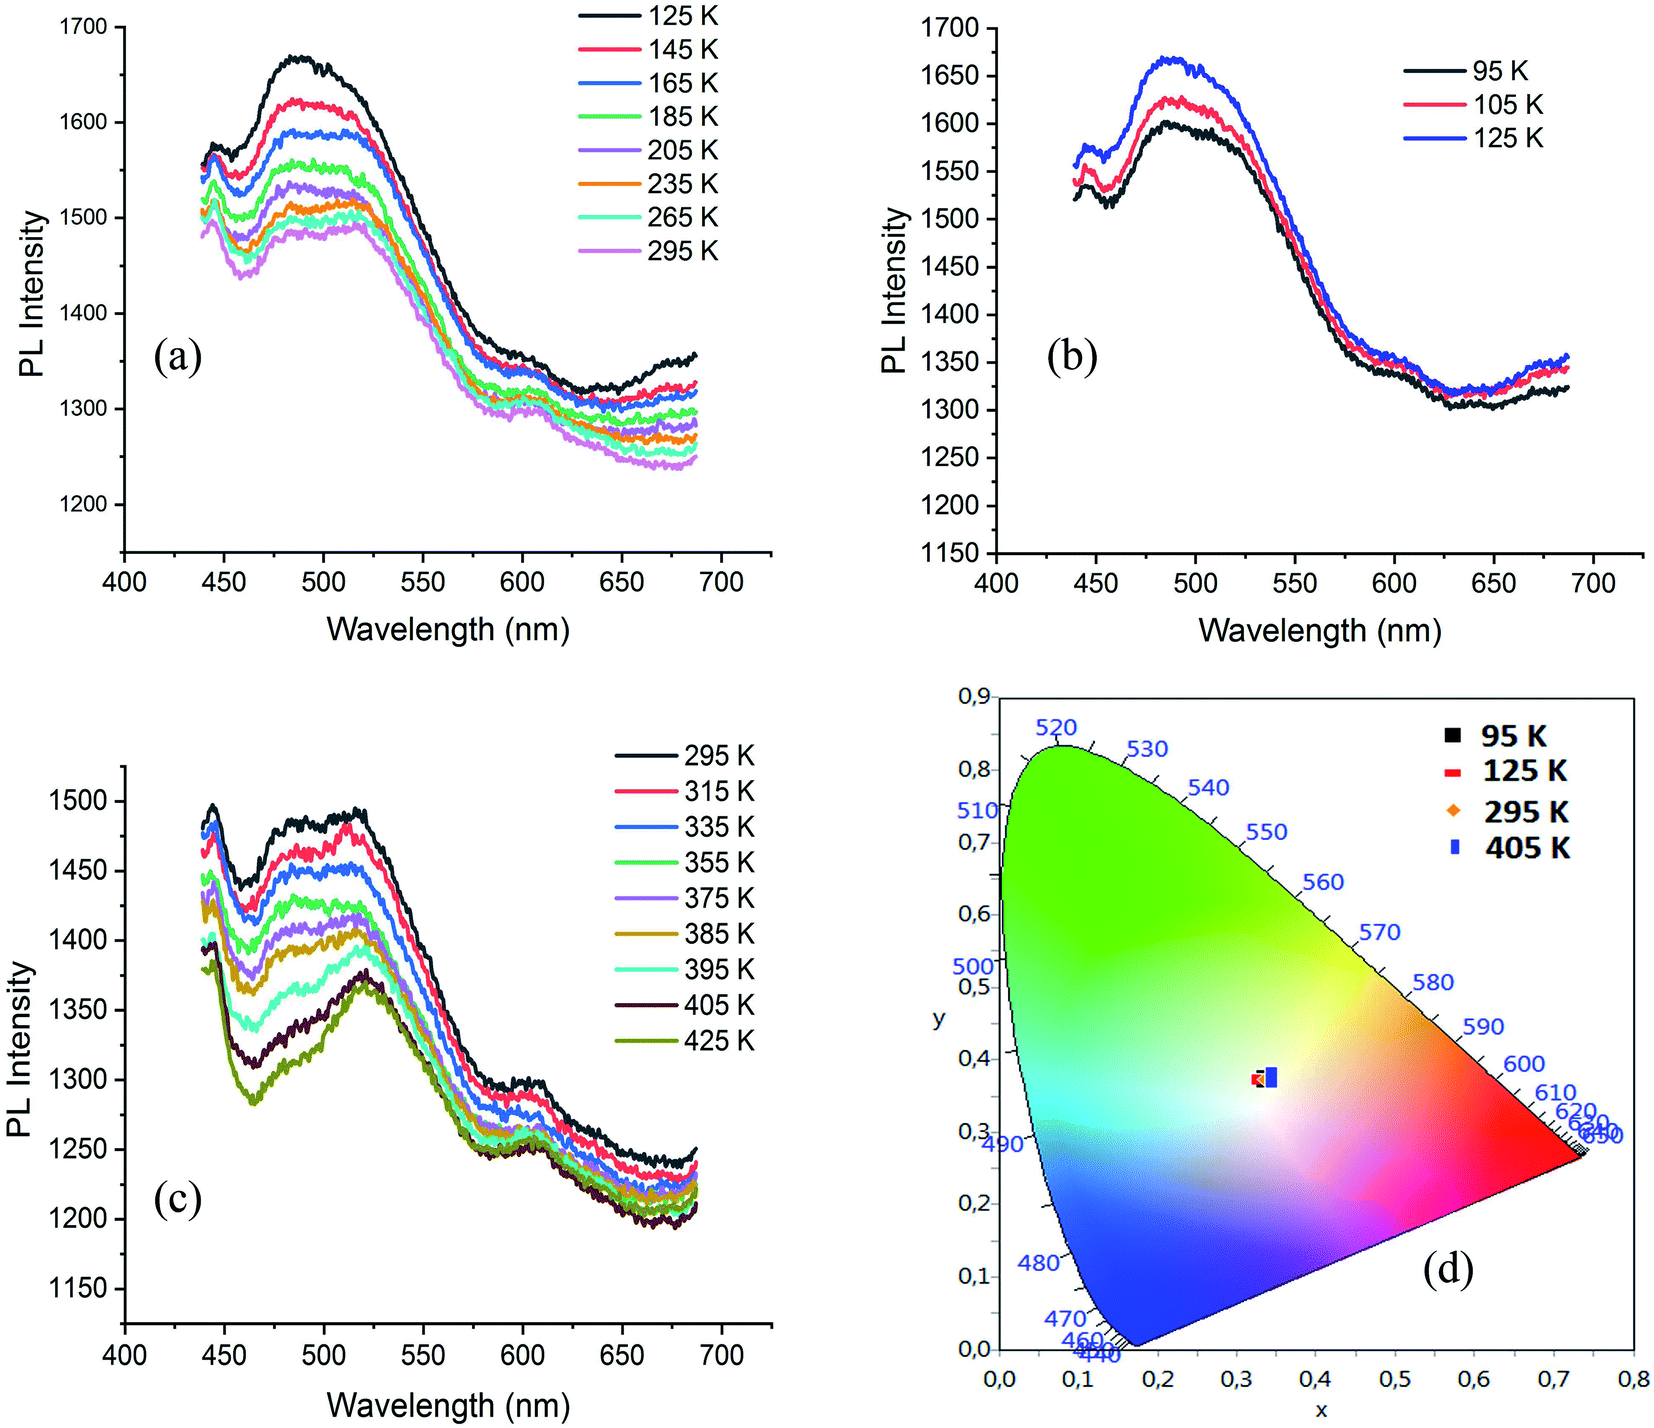
During temperature increase from the ambient temperature up to 405 K, a red shift of the broad-band between 425 and 650 nm accompanied with intensity lowering is observed. While, during cooling, an intensity increase of the broad band centred at 480 nm is occurred.
Three additional peaks are emerged at 630, 650 and 680 nm denoted as P4, P3 and P2, respectively, resulting from the phosphorescence emissions from triplet states. The chromaticity coordinates of the emitted light at different temperature are calculated and presented in Fig. 5(b). As shown in this figure, the WLE with an extra high CRI greater than 95 is detected under different temperature, which makes the material suitable for white light emitter devices. The Fig. 6 shows the effect of the variation of excitation energy on the emission behavior and the CdACP luminescence reveals high excitation dependence. This important excitation wavelength dependent emission is resulting from the multi-excitonic energetic sublevels of the organic triplet states. Under 345 nm, the recorded spectrum exhibits broad emission with three maxima at 400, 500 and 650 nm.
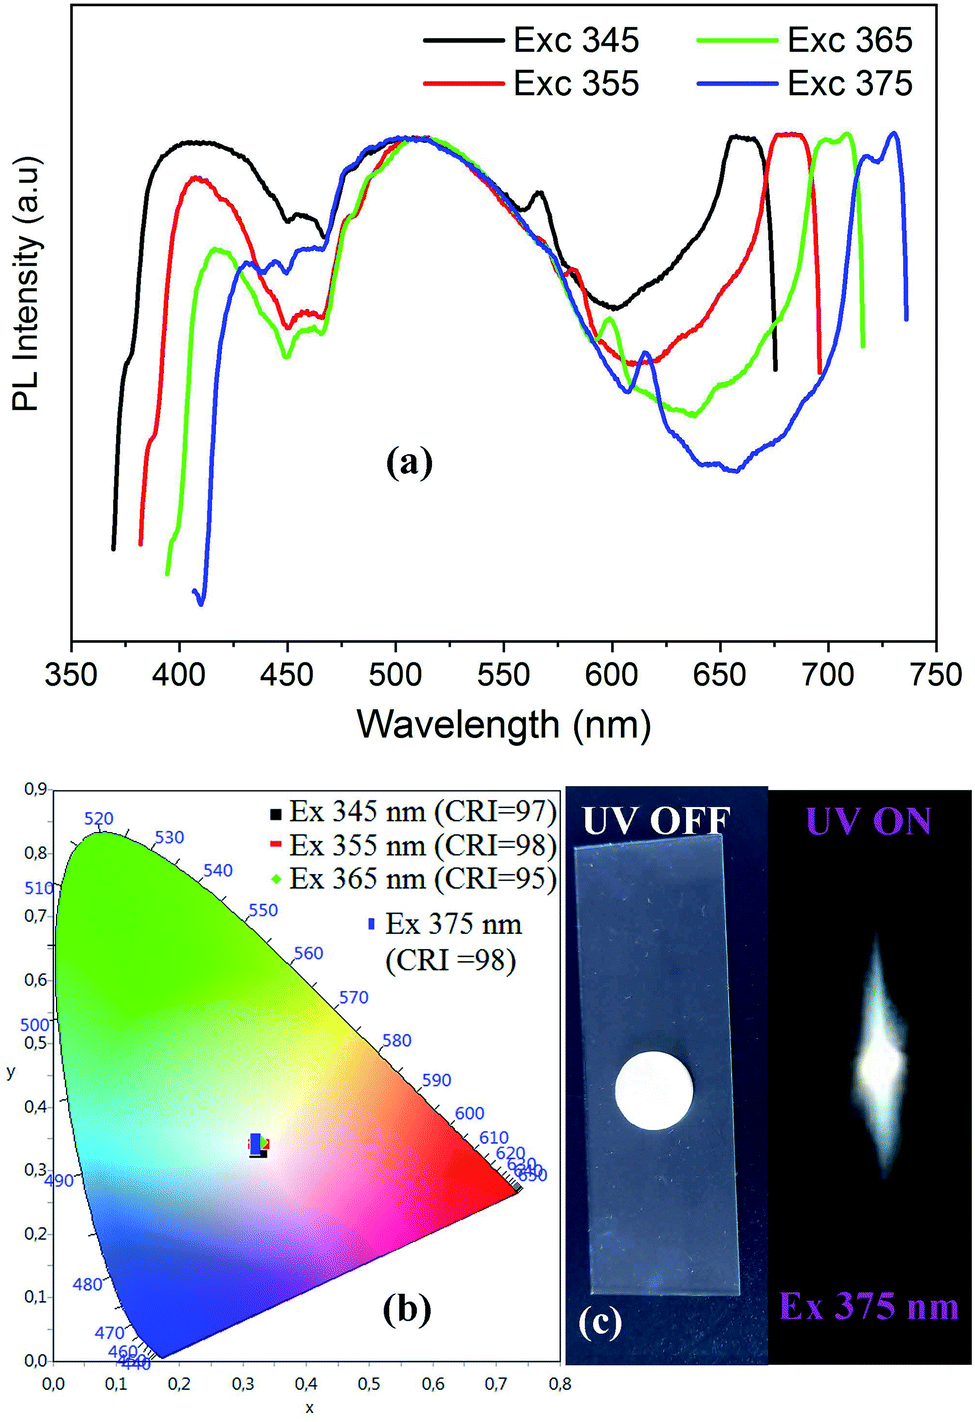 | ||
| Fig. 6 Excitation wavelength dependence of PL spectra of CdACP (a) with the corresponding color coordinates (b), and the digital photograph of the emitted light from CdACP under 365 nm (c). | ||
As shown in Fig. 6(a), when increasing the excitation wavelength from 345 to 375 nm the low energetic phosphorescence emission at around 650 nm is red-shifted to be observed at about 720 nm. While the band around 400 nm shows a red-shift with intensity lowering, the broad-band at 500 nm is not affected by the excitation energy decrease.
The visualization of the color coordinates CIE of the emitted light, under different excitation wavelengths, in the chromaticity diagram 1931 (Fig. 6(b)) reveals the white light emission from CdACP. The calculated chromaticity coordinates, the CCT and the CRI of lights observed at different excitation wavelength are presented in Table 2 and prove the emission of white light comparable to the pure daylight. The intense emitted white light from CdACP is clearly observed in the digital photograph of the sample when excited at 375 nm (Fig. 6(c)).
| λexc (nm) | 345 | 355 | 365 | 375 |
|---|---|---|---|---|
| (x, y) | (0.32, 0.33) | (0.32, 0.34) | (0.32, 0.34) | (0.32, 0.34) |
| CCT | 5870 | 5813 | 5857 | 6035 |
| CRI | 97 | 98 | 95 | 98 |
To thoroughly inspect the emission process inside the material, the emission spectrum of the organic salt H(ACP)·Br− has been recorded under different excitation wavelengths (Fig. S10†). As shown in this figure, the photoluminescence of the salt is highly dependent on the excitation energy. In the spectrum recorded under 250 nm, the WLE from the organic entities is detected which confirms their important contribution in the WLE from the CdACP material. Under 340 nm and 350 nm, only two emission bands are observed around 400 nm and 630 nm which are assigned to the organic fluorescence and phosphorescence, respectively, and no emission is detected around 500 nm.
In the previously studied Cd-based OIMHMs, the emission analysis revealed that the PL behavior are very similar to those of the pure CdX2 (X = Br, Cl and I).33,34,85 The emission peaks of the pure CdX2 compounds are observed in the range 326–620 nm and are assigned to the STE.86–90
Hence, the broad emission band observed in the PL spectra of CdACP, recorded under sub-gap excitation energies, is assigned to the STE emission within the CdBr4 tetrahedra. As a result, when it is excited above the gap energy, the emission from CdACP is assigned to the fluorescence and RTP of organic moieties. The excitation of the material below the gap energy activates the self-trapping mechanism within the CdBr4 tetrahedra and then, the emitted white light is resulting from both the STE inside the inorganic network and the fluorescence and RTP of the organic cations. Thanks to this RTP, the CdACP meet the requirements of WLE as well as energy conservation.
The decay spectra of the emission from CdACP, excited under 375 nm, were recorded at 480 nm and 520 nm. As designed above, the broad emission observed below 550 nm corresponds to the STE emission within inorganic tetrahedra. The average lifetimes were obtained from the bi-exponential decays. Fig. 7 shows the emission decays at room temperature, with long lifetimes calculated to be 168 and 717 ns for the bands at 480 and 520 nm, respectively. For the decay spectra collected at 650 and 666 nm, no decline was observed and this confirms that the lifetimes are above at least three microseconds (Fig. S11†).
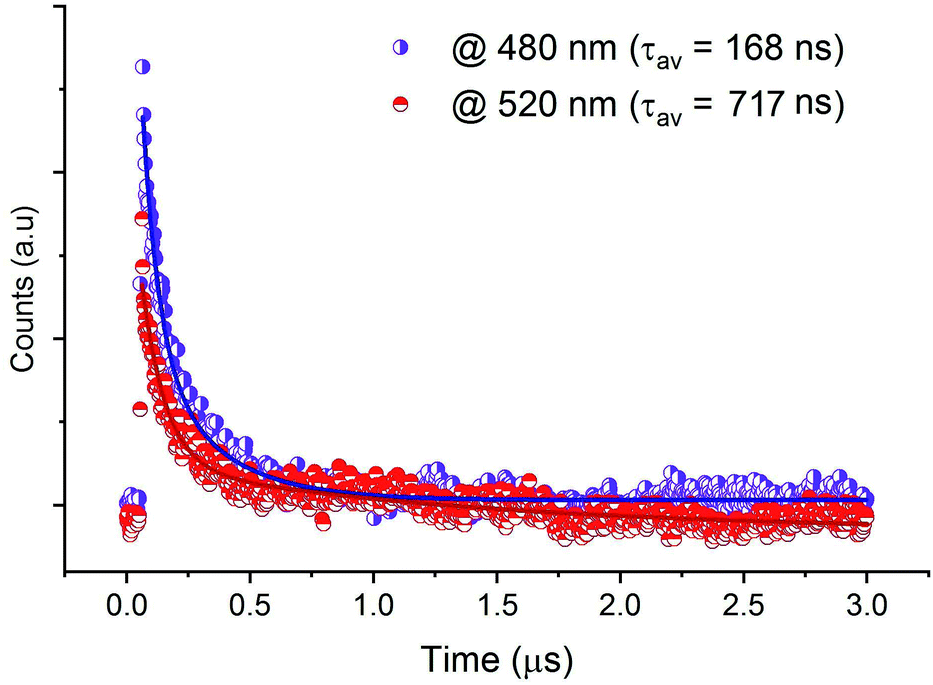 | ||
| Fig. 7 PL lifetime profiles of CdACP under excitation wavelength λexc = 375 nm. | ||
 | ||
| Fig. 8 Absorption spectrum (a), Tauc plot for the direct gap (b), and absorption and PL spectra (c) of CdODA. | ||
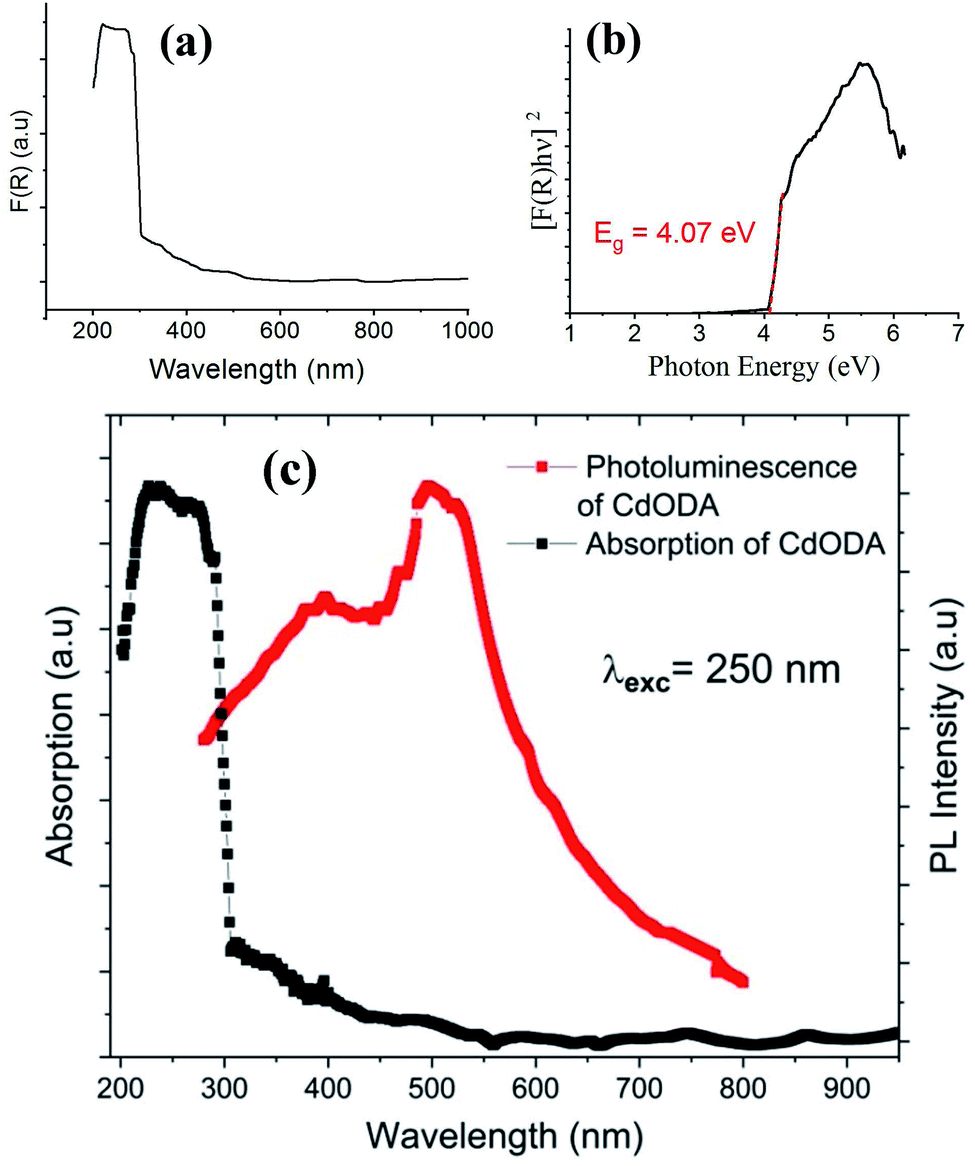
The direct fundamental gap of the CdODA is obtained from Tauc plot, Fig. 8(b), and it is found to be of about 4.07 eV (304 nm) which is too close to that of CdACP.
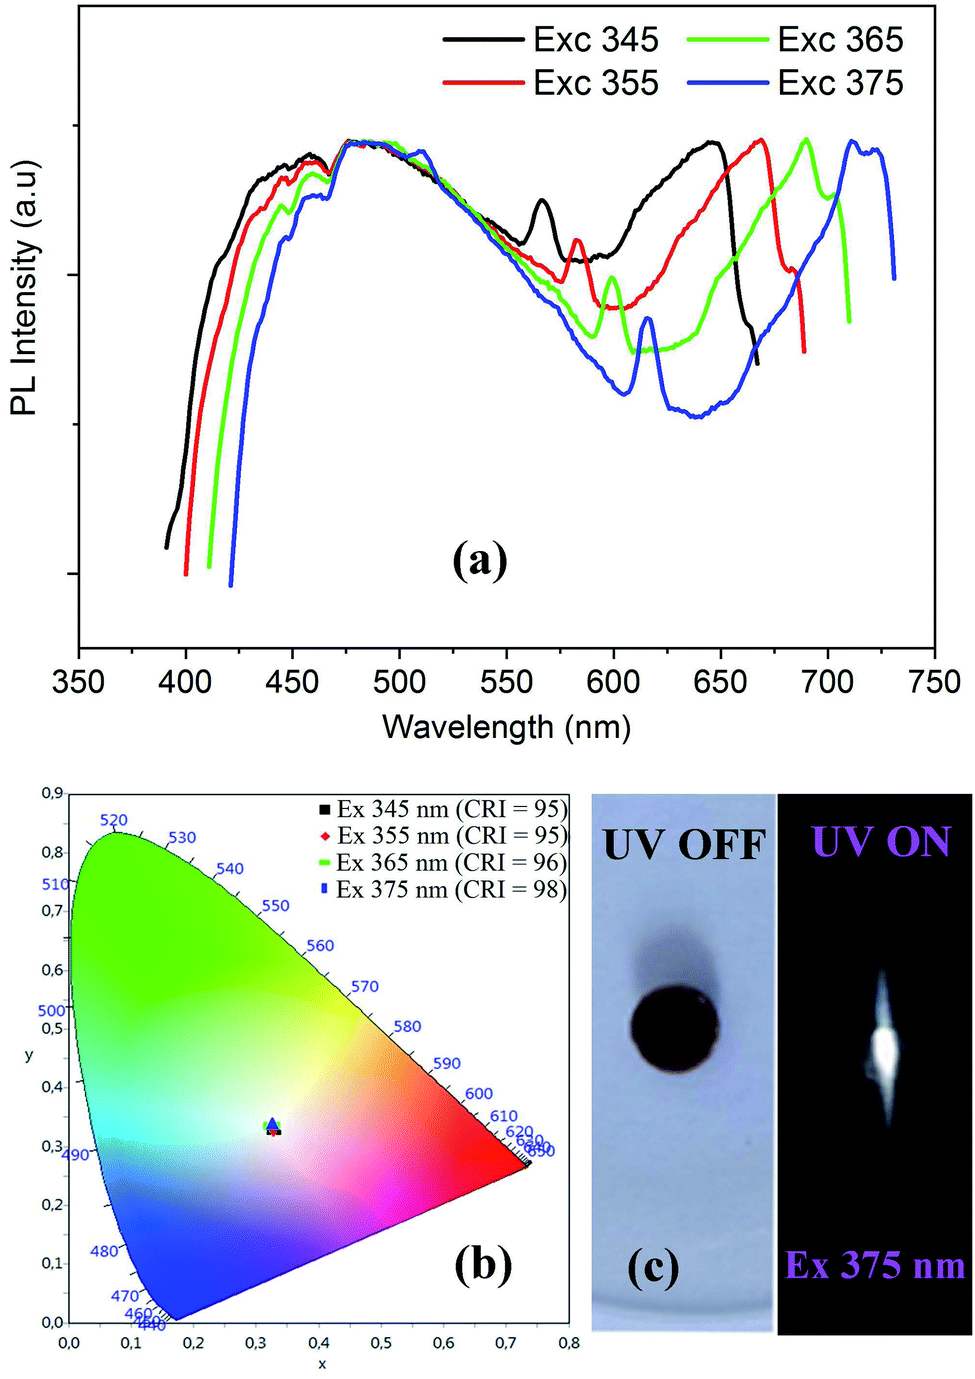
The solid-state PL properties of the synthesized material are studied under different excitation wavelengths. Using excitation source of 250 nm (4.96 eV), the PL spectra exhibits a broad emission band covering the whole UV-visible region (Fig. 8(c)) with two maxima at around 400 nm and 500 nm. As the improving of the emission from the STE need a sub-gap excitation, we excited the material with different excitation energies below the fundamental gap (Fig. 9(a)). Under excitation of 345 nm, the CdODA displays broad emission spanning the visible spectra. When increasing the excitation wavelength, a red-shift accompanied with intensity decrease of the band between 400 and 470 nm is observed. It is clear that the emission band observed at 650 nm is highly dependent on the excitation energy. As shown in Fig. 9(a), for the wide emission band centred at 490 nm, no excitation energy dependence is detected.
 | ||
| Fig. 9 Excitation wavelength dependence of PL spectra (a) with the corresponding color coordinates (b), and the digital photograph of the emitted light from CdODA under 365 nm (c). | ||
The visualization of the color coordinates CIE of the emitted light, at different excitation wavelengths, in the chromaticity diagram 1931 (Fig. 9(b)) reveals the WLE from CdODA. The characteristic parameters of the emitted lights are tabulated in Table 3. The Fig. 9(c) shows the digital photograph of the white light emitted from CdODA sample under 375 nm.
| λexc (nm) | 345 | 355 | 365 | 375 |
|---|---|---|---|---|
| (x, y) | (0.32, 0.33) | (0.32, 0.33) | (0.32, 0.33) | (0.32, 0.33) |
| CCT | 5646 | 5689 | 5759 | 5786 |
| CRI | 95 | 95 | 96 | 98 |
The structural study of CdODA demonstrates that inside this crystal assembly, unlike the CdACP structure, no molecular packing mode that harvesting the triplet states is observed. While, the strong N–H⋯N hydrogen bonds and the T-shaped C–H⋯π interactions, between the neighboring organic cations, assist the ESIPT process.51,52,54 Hence the white light emission from CdODA can be fluorescence in nature and results from the transitions from the excited singlet states  of the keto form to the excited singlet state
  of the keto form. The excitation wavelength dependence of the emission through the ESIPT is reported as anti-Kasha ESIPT process.91
To scrutinize the emission mechanism of CdODA, we measured the PL spectra of the organic amine ODA under 250 nm and 350 nm (Fig. S12†). In fact, as the crystal structure of the ODA is previously reported,92 we have chosen to measure the PL of the neutral ODA and not of its bromide salt. Herein, a simple comparison between the intermolecular interactions can help us to understand the origin of the emission observed within CdODA. As indicated in ref. 92, the supramolecular crystal structure of ODA is stabilized through NH⋯N, NH⋯O and NH⋯π intermolecular contacts.
The visualization of C⋯H contacts on the Hirshfeld surface of ODA (Fig. S13†), shows also the existence of C–H⋯π interactions. N–H⋯π and C–H⋯π interactions are presented in Fig. S14.† The PL spectrum of ODA, under excitation wavelength of 250 nm, exhibits broad emission band between 380 and 650 nm centred at 500 nm with tow intense bands at 690 and 760 nm. The disappearance of the intense emission bands in the spectrum of CdODA (Fig. 8(c)) is mainly related to the replacement of the strong N–H⋯π interactions within the ODA by the N–H⋯Br within CdODA. The excitation of ODA under 350 nm shows an intense emission in the range 550–700 nm. When comparing this spectrum with respect to that recorded under excitation wavelength upper 350 nm (Fig. 9(a)), we conclude that the broad emission between 400 and 600 nm is directly related to the existence of the inorganic framework. So, the broad emission band from CdODA centred at 490 nm that was not affected by excitation energy variation would be assigned to the STE emission from CdBr4 tetrahedra. The emission between 400 and 470 nm result mainly from the charge transfer between the organic and inorganic moieties. To confirm this, the temperature-dependent PL curves of CdODA were recorded under λexc of 375 nm (3.3 eV). As shown in Fig. 10, the emission intensity is less affected by the temperature variation comparing with the temperature-dependent intensity of the emission from CdACP. During the cooling from 295 K to 125 K, the emission intensity increases (Fig. 10(a)). In contrast to the well-known thermal quenching, in the range 125–95 K, the emission intensity decreases with temperature lowering (Fig. 10(b)). This phenomenon is observed in the case of fluorescent materials with ESIPT stabilized through intermolecular H-bonds when a conversion from the excited keto form to the excited enol form is occurred.93 This conversion results from the fact that, in this temperature range, the enol form is more stable than the keto form. Abnormally, this intensity decrease is also observed for the broad-band centred at 490 nm. Hence, this band is affected by the organic fluorescence which confirms the energy transfer between the inorganic clusters and the organic molecules. The heating of the sample from 295 K up to 425 K is accompanied by PL intensity decrease (Fig. 10(c)). Simplified emission diagrams comparing the difference between the photoluminescence mechanisms of CdODA and that of CdACP are shown in Fig. 11.
 | ||
| Fig. 10 (a–c) Temperature dependence of the PL spectrum of CdODA under 375 nm and (d): color coordinates of the emitted light at different temperature. | ||
 | ||
| Fig. 11 Proposed emission diagrams for the emissive transitions from CdACP and CdODA compounds. | ||
Fig. 10(d) presents the visualization of the calculated chromaticity coordinates of the emitted light, at different temperature, on the CIE chromaticity diagram. As shown in this figure, under different temperature the WLE with an extra high CRI greater than 90 is detected.
Therefore, when excited upper the gap energy the WLE from CdODA originates purely from the organic sub-lattice, while, under sub-gap excitation energies it is directly related to the STE within the inorganic sub-lattice. Then, under sub-gap excitation, the intense emission of CdODA in the green-blue region is related to the inorganic moieties while the intense red emission is assigned to the organic molecules.
The lifetime measurements were recorded and presented in Fig. 12. We measured the time resolved PL decays of three emission peaks under excitation wavelength of 365 nm. Fig. 12 reveals that the PL decay data for the broadband at 490 nm, assigned to the emission from STE within CdBr4, is 2.16 ns. The measured lifetimes at 430 and 450 nm are 2.12 and 1.56 ns, respectively. The fast decay of the emission bands reveals the ultra-fast fluorescence of CdODA. So, the emitted white light from CdACP is with high performance than that from CdODA and in contrast to the CdACP, the CdODA couldn't be applied in energy conversation. In addition, thanks to the ESIPT, the CdODA would be used for solid state optical sensing applications.94
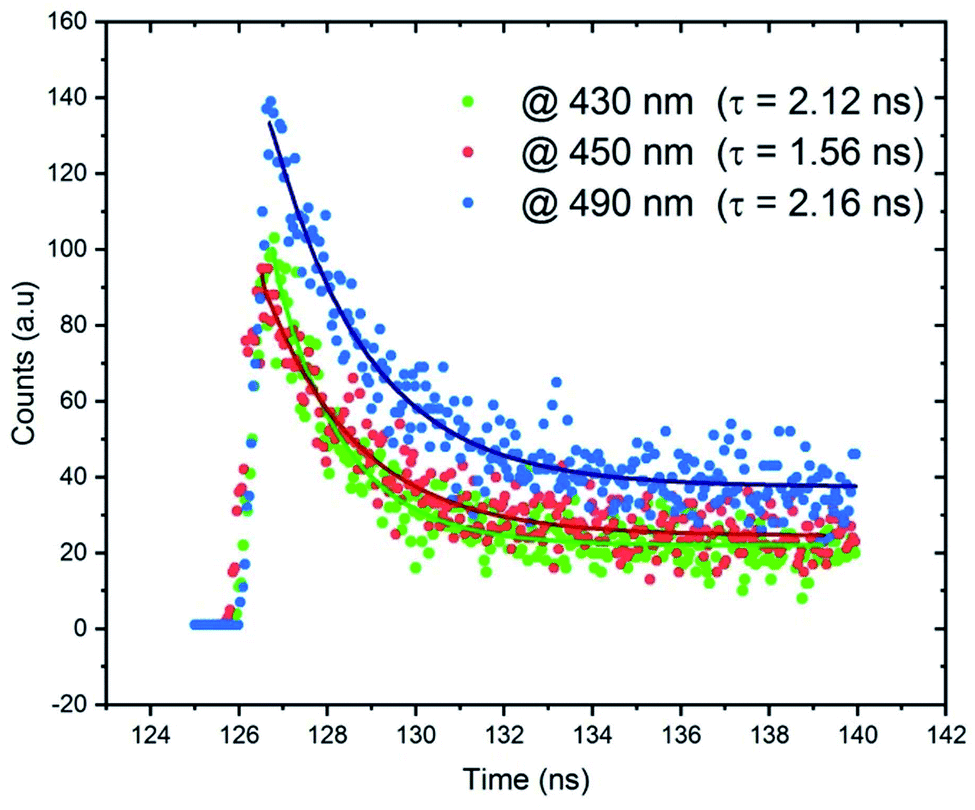 | ||
| Fig. 12 PL lifetime profiles of CdODA under excitation wavelength λexc = 365 nm. | ||
Conclusions
In sum, two zero dimensional hybrid white light emitters, (C5H6N2Cl)2CdBr4·H2O (CdACP) and (C12H13N2O)2CdBr4 (CdODA), were stabilized. These compounds form 0D crystal structures containing alternating layers of isolated inorganic CdBr4 tetrahedral anions and organic cations. The 3D organic–inorganic molecular packing through different intermolecular interactions leads to broad weak bands near the band gap, indicative of localized electronic states. The absorption analysis reveals that the synthesized compounds display wide direct gap with gap energy of about 4 eV. The solid-state photoluminescence measurements show broad-band white light emission from the investigated materials CdACP and CdODA. Both structural and emission studies suggest the RTP-activity of CdACP where the ISC is promoted by heavy atoms (Br and Cl) effect through harvesting triplet states. For the CdODA, the triplet states of the organic molecules are not harnessed. While, the C–H⋯π and N–H⋯N intermolecular hydrogen bonds ensure the proton transfer within the organic cations leading to ESIPT emission. Hence, under excitation energy above the gap energy, the white light emission from CdACP is resulting from both fluorescence and phosphorescence emission of the organic cations, while, that from CdODA is fluorescence in nature. Under sub-gap energy excitation, the emitted white light from the ODA originates from the STE within the inorganic tetrahedra CdBr4 and the fluorescence from the organic moieties. The measured fast decay of the luminescence is consistent with the ultra-fast fluorescence from the ODA cations. The investigated materials are suitable for solid-state WLE but the emission from CdACP is more efficient than that from the CdODA. In addition the RTP of the CdACP enables it to be applied in WLE with advantages of high-energy conversion efficiency.Conflicts of interest
There are no conflicts to declare.Acknowledgements
The authors extend their appreciation to the Deanship of Scientific Research at Imam Mohammad Ibn Saud Islamic University for funding this work through Research Group no. RG-21-09-71.Notes and references
- S. Walha, H. Naïli, S. Yahyaoui, B. F. Ali, M. M. Turnbull, T. Mhiri and S. W. Ng, J. Supercond. Novel Magn., 2013, 26, 437–442 CrossRef CAS.
- A. M. Ben Salah, H. Naïli, M. Arczyński and M. Fitta, J. Organomet. Chem., 2016, 805, 42–48 CrossRef.
- N. L. Nkhili, W. Rekik and H. Naïli, Monatsh. Chem., 2014, 145, 931–936 CrossRef CAS.
- N. Hfidhi, O. Kammoun, R. Pelka, M. Fitta and H. Naïli, Inorg. Chim. Acta, 2018, 469, 431–439 CrossRef CAS.
- S. Dgachi, A. M. Ben Salah, M. M. Turnbull, T. Bataille and H. Naïli, J. Alloys Compd., 2017, 726, 315–322 CrossRef CAS.
- N. Hfidhi, M. Korb, M. Fitta, E. Čižmár, H. Lang and H. Naïli, Inorg. Chim. Acta, 2019, 484, 206–213 CrossRef CAS.
- S. Dgachi, S. Saïd, J. C. Monroe, M. M. Turnbull and H. Naïli, J. Alloys Compd., 2017, 709, 356–361 CrossRef CAS.
- M. Abid Derbel, M. M. Turnbull, H. Naïli and W. Rekik, Polyhedron, 2020, 175, 114220 CrossRef CAS.
- N. Hfidhi, I. bkhairia, D. Atoui, J. Boonmak, M. Nasri, R. Ben Salem, S. Youngme and H. Naïli, Appl. Organomet. Chem., 2019, 33, 1–14 CrossRef.
- R. Jlassi, A. P. C. Ribeiro, G. A. O. Tiago, J. Wang, M. S. Krawczyk, L. M. D. R. S. Martins, H. Naïli, A. J. L. Pombeiro and W. Rekik, Inorg. Chim. Acta, 2018, 471, 76–81 CrossRef CAS.
- A. M. Ben Salah, L. B. Fendri, T. Bataille, R. P. Herrera and H. Naïli, Chem. Cent. J., 2018, 12, 1–12 CrossRef PubMed.
- R. Jlassi, A. P. C. Ribeiro, M. Mendes, W. Rekik, G. A. O. Tiago, K. T. Mahmudov, H. Naïli, M. F. C. Guedes da Silva and A. J. L. Pombeiro, Polyhedron, 2017, 129, 182–188 CrossRef CAS.
- S. Saïd, R. Ben Abdallah Kolsi and H. Naïli, J. Organomet. Chem., 2016, 809, 45–56 CrossRef.
- K. Dammak, M. Porchia, M. De Franco, M. Zancato, H. Naïli, V. Gandin and C. Marzano, Molecules, 2020, 25, 5484 CrossRef CAS PubMed.
- D. Ben Hassan, W. Rekik, A. Otero-de-la Roza, F. Ben Mefteh, T. Roisnel, T. Bataille and H. Naïli, Polyhedron, 2016, 119, 238–247 CrossRef CAS.
- C. Zhou, H. Lin, Q. He, L. Xu, M. Worku and M. Chaaban, Mater. Sci. Eng., R, 2019, 137, 38–65 CrossRef.
- R. Msalmi, S. Elleuch, B. Hamdi, E. Radicchi, A. Tozri, H. Naïli and M. R. Berber, New J. Chem., 2021, 45, 20850–20859 RSC.
- W. Jabeur, R. Msalmi, M. Korb, M. Holub, E. Mosconi, E. Čižmár, A. Tozri, N. A. Althubiti and H. Naïli, J. Mater. Chem. C, 2021, 9, 17158–17166 RSC.
- M. Bourwina, R. Msalmi, S. Walha, M. M. Turnbull, T. Roisnel, F. Costantino, E. Mosconi and H. Naïli, J. Mater. Chem. C, 2021, 9, 5970–5976 RSC.
- A. Kojima, K. Teshima, Y. Shirai and T. Miyasaka, J. Am. Chem. Soc., 2009, 6050–6051 CrossRef CAS PubMed.
- T. M. Koh, K. Fu, Y. Fang, S. Chen, T. C. Sum, N. Mathews, S. G. Mhaisalkar, P. P. Boix and T. Baikie, J. Phys. Chem. C, 2014, 118, 16458–16462 CrossRef CAS.
- P. Zawal, H. Sen, S. Klejna, T. Mazur, E. Wlaz and K. Szaciłowski, Coord. Chem. Rev., 2020, 415, 213316 CrossRef.
- J. Wang, Y. Liu, S. Han, Y. Li, Z. Xu, J. Luo, M. Hong, Z. Sun, Y. Liu, S. Han, Y. Li, Z. Xu, J. Luo, M. Hong and Z. Sun, Sci. Bull., 2020, 66, 158–163 CrossRef.
- X. Yang, L. F. Ma and D. Yan, Chem. Sci., 2019, 10, 4567–4572 RSC.
- J. Yin, H. Li, D. Cortecchia, C. Soci and J. L. Brédas, ACS Energy Lett., 2017, 2, 417–423 CrossRef CAS.
- Z. Qi, Y. Chen, Y. Guo, X. Yang, F. Q. Zhang, G. Zhou and X. M. Zhang, J. Mater. Chem. C, 2021, 9, 88–94 RSC.
- M. H. Jung, New J. Chem., 2020, 44, 171–180 RSC.
- Z. Yuan, C. Zhou, Y. Tian, Y. Shu, J. Messier, J. C. Wang, L. J. Van De Burgt, K. Kountouriotis, Y. Xin, E. Holt, K. Schanze, R. Clark, T. Siegrist and B. Ma, Nat. Commun., 2017, 8, 14051 CrossRef CAS PubMed.
- A. Yangui, S. Pillet, E. E. Bendeif, A. Lusson, S. Triki, Y. Abid and K. Boukheddaden, ACS Photonics, 2018, 5, 1599–1611 CrossRef CAS.
- X. Jiang, Z. Chen and X. Tao, Front. Chem., 2020, 8, 2–9 CrossRef PubMed.
- D. Shanthi, P. Selvarajan and S. Perumal, Optik, 2016, 127, 3192–3199 CrossRef CAS.
- C. Deng, G. Zhou, D. Chen, J. Zhao, Y. Wang and Q. Liu, J. Phys. Chem. Lett., 2020, 11, 2934–2940 CrossRef CAS PubMed.
- R. Roccanova, M. Houck, A. Yangui, D. Han, H. Shi, Y. Wu, D. T. Glatzhofer, D. R. Powell, S. Chen, H. Fourati, A. Lusson, K. Boukheddaden, M. Du and B. Saparov, ACS Omega, 2018, 3, 18791–18802 CrossRef CAS PubMed.
- R. Roccanova, W. Ming, V. R. Whiteside, M. AMcGuire, I. R. Sellers, M. Du and B. Saparov, Inorg. Chem., 2017, 56, 13878–13888 CrossRef CAS PubMed.
- A. Yangui, R. Roccanova, T. M. McWhorter, Y. Wu, M. Du and B. Saparov, Chem. Mater., 2019, 31, 2983–2991 CrossRef CAS.
- S. Elleuch, A. Lusson, S. Pillet, K. Boukheddaden and Y. Abid, ACS Photonics, 2020, 7, 1178–1187 CrossRef CAS.
- S. Kundu, B. Sk, P. Pallavi, A. Giri and A. Patra, Chem.–Eur. J., 2020, 26, 5557–5582 CrossRef CAS PubMed.
- S.-K. Fang, H.-Y. Tsai, J.-W. Hu and K.-Y. Chen, Int. J. Photoenergy, 2014, 2014, 124753 CrossRef.
- Q. Zhang, H. Ting, S. Wei, D. Huang, C. Wu, W. Sun, B. Qu, S. Wang, Z. Chen and L. Xiao, Mater. Today Energy, 2018, 8, 157–165 CrossRef.
- H. Uoyama, K. Goushi, K. Shizu, H. Nomura and C. Adachi, Nature, 2012, 492, 234–238 CrossRef CAS PubMed.
- S. Achelle, J. Rodríguez-López, C. Katan and F. R. Guen, J. Phys. Chem. C, 2016, 120, 26986–26995 CrossRef CAS.
- X.-H. Jin, C. Chen, C.-X. Ren, L.-X. Cai and J. Zhang, Chem. Commun., 2014, 50, 15878–15881 RSC.
- J. Wang, X. Gu, H. Ma, Q. Peng, X. Huang, X. Zheng, S. H. P. Sung, G. Shan, J. W. Y. Lam, Z. Shuai and B. Z. Tang, Nat. Commun., 2018, 9, 2963 CrossRef PubMed.
- P. Sudhakar and T. P. Radhakrishnan, J. Mater. Chem. C, 2019, 7, 7083–7089 RSC.
- F. B. Dias, K. N. Bourdakos, V. Jankus, K. C. Moss, T. Kamtekar, V. Bhalla, J. Santos, M. R. Bryce and A. P. Monkman, Adv. Mater., 2013, 25, 3707–3714 CrossRef CAS PubMed.
- Y. Yang, X. Fang, S. S. Zhao, F. Bai, Z. Zhao, K. Z. Wang and D. Yan, Chem. Commun., 2020, 56, 5267–5270 RSC.
- X. G. Yang, X. M. Lu, Z. M. Zhai, J. H. Qin, X. H. Chang, M. Le Han, F. F. Li and L. F. Ma, Inorg. Chem. Front., 2020, 7, 2224–2230 RSC.
- X. Yang and D. Yan, Chem. Commun., 2017, 53, 1801–1804 RSC.
- W. Sasa, L. Li, Z. Sun, C. Ji, S. Liu, Z. Wu, S. Zhao, M. Hong and J. Luo, J. Mater. Chem. C, 2017, 5, 4731–4735 RSC.
- S. Liu, X. Fang, B. Lu and D. Yan, Nat. Commun., 2020, 11, 4649 CrossRef CAS PubMed.
- V. S. Padalkar and S. Seki, Chem. Soc. Rev., 2016, 45, 169–202 RSC.
- A. Shahraki, A. Ebrahimi, S. Rezazadeh and R. Behazin, Mol. Syst. Des. Eng., 2021, 6, 66–79 RSC.
- H. C. Joshi and L. Antonov, Molecules, 2021, 26, 1475 CrossRef CAS PubMed.
- Z. Huang and X. Ma, Cell Rep. Phys. Sci., 2020, 1, 100167 CrossRef CAS.
- X. Zheng, X. Wang, H. Mao, W. Wu, B. Liu and X. Jiang, Nat. Commun., 2015, 6, 1–12 Search PubMed.
- Z. Tao, G. Hong, C. Shinji, C. Chen, S. Diao, A. L. Antaris, B. Zhang, Y. Zou and H. Dai, Angew. Chem., Int. Ed., 2013, 52, 13002–13006 CrossRef CAS PubMed.
- L. Xiao, Y. Wu, J. Chen, Z. Yu, Y. Liu, J. Yao and H. Fu, J. Phys. Chem. A, 2017, 121, 8652–8658 CrossRef CAS PubMed.
- J. Yuan, P. R. Christensen and M. O. Wolf, Chem. Sci., 2019, 10, 10113–10121 RSC.
- A. Ashraf, M. Islam, M. Khalid, A. P. Davis, M. T. Ahsan, M. Yaqub, A. Syed, A. M. Elgorban, A. H. Bahkali and Z. Shafiq, Sci. Rep., 2021, 11, 1–13 CrossRef PubMed.
- Z. Shu, F. Kemper, E. Beckert, R. Eberhardt and A. Tünnermann, RSC Adv., 2017, 7, 26384–26391 RSC.
- Y. Zhang, J. Lee and S. R. Forrest, Nat. Commun., 2014, 5, 1–7 CAS.
- P. Xiao, T. Dong, J. Xie, D. Luo, J. Yuan and B. Liu, Appl. Sci., 2018, 8, 299 CrossRef.
- X. G. Yang, Z. M. Zhai, X. M. Lu, J. H. Qin, F. F. Li and L. F. Ma, Inorg. Chem., 2020, 59, 10395–10399 CrossRef CAS PubMed.
- X. G. Yang, X. M. Lu, Z. M. Zhai, Y. Zhao, X. Y. Liu, L. F. Ma and S. Q. Zang, Chem. Commun., 2019, 55, 11099–11102 RSC.
- X. Yang and D. Yan, Chem. Sci., 2016, 7, 4519–4526 RSC.
- S. Ye, F. Xiao, Y. X. Pan, Y. Y. Ma and Q. Y. Zhang, Mater. Sci. Eng., R, 2010, 71, 1–34 CrossRef.
- M. S. Rea and J. P. Freyssinier, Color Res. Appl., 2010, 35, 401–409 CrossRef.
- A. Santra, K. Panigrahi, S. Saha, N. Mazumder, A. Ghosh, S. Bakuli, K. K. Chattopadhyay and U. K. Ghorai, J. Mater. Sci.: Mater. Electron., 2019, 30, 6311–6321 CrossRef CAS.
- A. De, B. Samanta, A. K. Dey, N. Chakraborty, T. K. Parya, S. Saha and U. K. Ghorai, ACS Appl. Nano Mater., 2022, 5, 331–340 CrossRef CAS.
- S. Saha, S. Das, U. K. Ghorai, N. Mazumder, D. Ganguly and K. K. Chattopadhyay, J. Phys. Chem. C, 2015, 119, 16824–16835 CrossRef CAS.
- K. Panigrahi, S. Saha, S. Sain, R. Chatterjee, A. Das, U. K. Ghorai, N. Sankar Das and K. K. Chattopadhyay, Dalton Trans., 2018, 47, 12228–12242 RSC.
- S. Saha, S. Das, D. Sen, U. K. Ghorai, N. Mazumder, B. K. Gupta and K. K. Chattopadhyay, J. Mater. Chem. C, 2015, 3, 6786–6795 RSC.
- L. J. Farrugia, J. Appl. Crystallogr., 2012, 45, 849–854 CrossRef CAS.
- G. Sheldrick, A short Hist. SHELX, 2008, vol. 64, pp. 112–122 Search PubMed.
- G. M. Sheldrick, Acta Crystallogr., Sect. A: Found. Crystallogr., 2008, 64, 112–122 CrossRef CAS PubMed.
- A. L. Spek, Acta Crystallogr., Sect. D: Biol. Crystallogr., 2009, 65, 148–155 CrossRef CAS PubMed.
- H. Putz and K. Brandenburg, Diamond – Crystal and Molecular Structure Visualization, Crystal Impact, Kreuzherrenstr, Bonn, Germany, 2018 Search PubMed.
- S. K. Wolff, D. J. Grimwood, J. J. McKinnon, M. J. Turner and D. Jayatilaka, CrystalExplorer3.0, University of Western Australia, https://crystalexplorer.net Search PubMed.
- C. F. Macrae, I. J. Bruno, J. A. Chisholm, P. R. Edgington, P. McCabe, E. Pidcock, L. Rodriguez-Monge, R. Taylor, J. Van De Streek and P. A. Wood, J. Appl. Crystallogr., 2008, 41, 466–470 CrossRef CAS.
- R. Msalmi, S. Elleuch, B. Hamdi, R. Zouari and H. Naïli, J. Mol. Struct., 2020, 1222, 128853 CrossRef CAS.
- J. A. Li, J. Zhou, Z. Mao, Z. Xie, Z. Yang, B. Xu, C. Liu, X. Chen, D. Ren, H. Pan, G. Shi, Y. Zhang and Z. Chi, Angew. Chem., Int. Ed., 2018, 57, 6449–6453 CrossRef CAS PubMed.
- Z. He, W. Zhao, J. W. Y. Lam, Q. Peng, H. Ma, G. Liang, Z. Shuai and B. Z. Tang, Nat. Commun., 2017, 8, 416 CrossRef PubMed.
- S. Xu, R. Chen, C. Zheng and W. Huang, Adv. Mater., 2016, 28, 9920–9940 CrossRef CAS PubMed.
- Y. Liu, G. Zhan, Z. W. Liu, Z. Q. Bian and C. H. Huang, Chin. Chem. Lett., 2016, 27, 1231–1240 CrossRef CAS.
- A. Ohnishi, T. Yamada, T. Yoshinari, I. Akimoto, K. Kanno and T. Kamikawa, J. Electron Spectrosc. Relat. Phenom., 1996, 79, 163–166 CrossRef CAS.
- A. Ohnishi, M. Kitaura and H. Nakagawa, J. Phys. Soc. Jpn., 1994, 63, 4648–4654 CrossRef CAS.
- H. Nakagawa, K. Hayashi and H. Matsumoto, J. Phys. Soc. Jpn., 1977, 43, 1655–1663 CrossRef CAS.
- H. Matsumoto and H. Nakagawa, J. Lumin., 1979, 18–19, 19–22 CrossRef CAS.
- T. Hayashi, T. Ohata and S. Koshino, Solid State Commun., 1981, 38, 845–847 CrossRef CAS.
- M. Kitaura, A. Nakawa, K. Fukui, M. Fujita, T. Miyanaga and W. Makoto, J. Electron Spectrosc. Relat. Phenom., 1996, 79, 175–178 CrossRef CAS.
- A. P. Demchenko, V. I. Tomin and P. T. Chou, Chem. Rev., 2017, 117, 13353–13381 CrossRef CAS PubMed.
- G. Sharma, S. Anthal, D. V. Geetha, F. H. Al-Ostoot, M. Q. A. Al-Gunaid, S. A. Khanum, M. A. Sridhar and R. Kant, Rasayan J. Chem., 2019, 12, 2311–2317 CrossRef CAS.
- A. Li, H. Liu, C. Song, Y. Geng, S. Xu, H. Zhang, H. Zhang, H. Cui and W. Xu, Mater. Chem. Front., 2019, 3, 2128–2136 RSC.
- L. Chen, P. Y. Fu, H. P. Wang and M. Pan, Adv. Opt. Mater., 2021, 9, 1–25 CAS.
Footnote |
| † Electronic supplementary information (ESI) available. CCDC 1835268. For ESI and crystallographic data in CIF or other electronic format see DOI: 10.1039/d1ra08953f |
| This journal is © The Royal Society of Chemistry 2022 |