DOI:
10.1039/D2RA00696K
(Paper)
RSC Adv., 2022,
12, 10443-10459
5-Arylidene-1,3-dialkylbarbituric acid derivatives as efficient corrosion inhibitors for carbon steel in molar hydrochloric acid solution
Received
1st February 2022
, Accepted 17th March 2022
First published on 6th April 2022
Abstract
The inhibiting impact of two ecofriendly 5-arylidene barbituric acid derivatives (5-ABA), namely 5-(3,4-dimethoxybenzylidene)-1,3-dimethylpyrimidine-2,4,6(1H,3H,5H)-trione (inhibitor I, 3a) and 5-(3,4-dimethoxybenzylidene)-1,3-diethyl-2-thioxodihydropyrimidine-4,6(1H,5H)-dione (inhibitor II, 3b), in 1 M HCl on the corrosion of carbon steel has been examined via the weight loss (WL) method, potentiodynamic polarization (PP), electrochemical impedance spectroscopy (EIS), and electrochemical frequency modulation (EFM) tests. In addition, DFT calculations and MC simulations were used to study the relationship between the inhibitor structure and its inhibition performance. The attained outcomes exhibit that the investigated compounds are excellent inhibitors and their inhibition efficiency (%IE) increases with the increase in the concentration and temperature. The adsorption of 5-arylidene barbituric acid on the C-steel surface was found to follow the Langmuir adsorption isotherm. The adsorption process of the investigated compounds is spontaneous and considered as the chemisorption type. The PP curves revealed that 5-arylidene barbituric acid derivatives are mixed-type inhibitors. Moreover, the EIS results confirmed the adsorption of 5-arylidene barbituric acid derivatives on the C-steel surface by increasing the charge transfer resistance (Rct) values. The %IE of the inhibitors (II & I) reached 92.8% and 86.6% at a concentration of 21 × 10−6 M, according to the WL method. The surface analysis of the C-steel surface was confirmed by scanning electron microscopy and energy dispersive X-ray techniques. Finally, the experimental and theoretical results are in good agreement.
1 Introduction
Acidic media are generally applied for the elimination of unwanted scales and corrosion in several industrial procedures. By monitoring metal dissolution due to acidic exposure, inhibitors are commonly applied within these operations.1 Nowadays, organic inhibitors show better inhibition of corrosion than inorganic inhibitors.2 Organic compounds are a kind of acidic inhibitors including heteroatoms, for example, oxygen, sulfur, and nitrogen. Among these, organic inhibitors have several advantages, for instance, not expensive, low poisonousness, high inhibition efficiency, and easy to organize.3–6 In general, heterocyclic organic compounds are applied for corrosion inhibition on copper,7 aluminum,8–10 iron,11–16 and also other metals17,18 within a diverse corrosion media. A review of the literature on acid corrosion inhibitors reveals that they work by adsorbing on the metal's surface. This effect may be caused by electrostatic attraction between the charged metal and the charged inhibitor molecules, (ii) dipole-type interaction between the uncharged electron pairs in the inhibitor and the metal, (iii) electron-interaction with the metal, or (iv) a combination of the aforementioned.19 Pyrimidine is a six-membered heterocyclic aromatic chemical molecule with two nitrogen atoms at positions 1 and 3. The chemistry of pyrimidine derivatives is crucial in medicine, agrochemicals, and a variety of biological activities. Numerous well-known commercial medications contain pyrimidine derivatives, such as Uramustine, Piritrexim, Isetionate, Tegafur, Floxuridine, Fluorouracil, Cytarabine, and Methotrexate. Furthermore, the pyrimidine skeleton is found in a wide range of natural products, including nucleic acids, vitamins, enzymes, chlorophyll, haemoglobin, and hormones. A list of organic derivatives utilized as corrosion inhibitors for metals is shown below:
| Pyrimidine derivatives |
Sample |
Medium |
%IE |
Ref. |
| 5-Phenyl-1,3,5,6,8-pentahydro-pyrimido[4,5-d] pyrimidine-2,4,7-trione (PPD-4), 5-(4-methoxyphenyl)-1,3,5,6,8-pentahydropyrimido[4,5-d] pyrimidine-2,4,7-trione (PPD-3), 5-phenyl-1,3,5,6,8-pentahydro-7-thioxo-pyrimido[4,5-d]pyrimidine-2,4-dione (PPD-2), and 5-(4-methoxyphenyl)-1,3,5,6,8-pentahydro-7-thioxo-pyrimido[4,5-d]pyrimidine-2,4-dione (PPD-1) |
Mild steel |
1 M HCl |
88–97.1% at 400 mg L−1 |
20 |
| (a) 6-Methyl-4-morpholin-4-yl-2-oxo-,2,3,4-tetrahydro-pyrimidine-5-carboxylic-acid-ethyl-ester |
Carbon steel |
0.5 M HCl |
80–86 at 0.25 g L−1 |
21 |
| (b) 6-Methyl-4-morpholin-4-yl-2-thioxo-1,2,3,4-tetrahydro-pyrimidine-5-carboxylic acid ethyl ester |
Mild steel |
0.5 M HCl |
80–86 at 0.25 g L−1 |
21 |
| (c) 6-Methyl-4-morpholin-4-yl-2-oxo-1,2,3,4-tetrahydro-pyrimidine-5-carboxylic acid hydrazide |
| (d) 6-Methyl-4-morpholin-4-yl-2-thioxo-1,2,3,4-tetrahydro-pyrimidine-5-carboxylic acid hydrazide |
| 5-Benzoyl-4-(4-carboxphenyl)-6-phenyl-1,2,3,4-tetrahydro-2-iminopyrimidine, 5-benzoyl-4-tolyl-6-phenyl-1,2,3,4-tetrahydro-2-thioxopyrimidine in 1 M HCl |
Stainless steel |
1 M HCl |
90 at 5 × 10⁻³ M |
22 |
| 5-Benzoyl-4-(substituted phenyl)-6-phenyl-3,4-dihydropyrimidine-2(1H)-(thio)ones in 0.5 M H2SO4 |
Stainless steel |
0.5 M H2SO4 |
92 at 2 × 10⁻³ M |
23 |
| (a) 5-(4-Methoxyphenyl)-1,3,5,6,8-pentahydro-7-thioxo-pyrimido[4,5-d]pyrimidine-2,4-dione |
Mild steel |
1 M HCl |
97.1–88.0 at 400 ppm |
24 |
| (b) 5-Phenyl-1,3,5,6,8-pentahydro-7-thioxo-pyrimido[4,5-d]pyrimidine-2,4-dione |
| (c) 5-(4-Methoxyphenyl)-1,3,5,6,8-pentahydro-pyrimido[4,5-d]pyrimidine-2,4,7-trione |
| (d) 5-Phenyl-1,3,5,6,8-pentahydro-pyrimido[4,5-d]pyrimidine-2,4,7-trione in HCl |
| 1-(7-Methyl-5-morpholin-4-yl-thiazolo[4,5-d]pyrimidin-2-yl)-hydrazine |
Carbon steel |
0.5 M H2SO4 |
90 at 400 ppm |
25 |
| (a) 4,6-Diphenyl-3,4-dihydropyrimidine-2(1H)-thione |
Carbon steel |
1 M H2SO4 |
99–98 at 10 mM |
26 |
| (b) 4-(4-Methylphenyl)-6-phenyl-3,4-dihydropyrimidine-2(1H)-thione |
| (c) 4-(4-Methoxy-phenyl)-6-phenyl-3,4-dihydropyrimidine-2(1H)-thione |
| (a) 4-(4′-Methylphenyl)-6-(phenyl)-3,4-dihydropyrimidine-2(1H)-thione |
Stainless steel 304 |
2 M H2SO4 |
97.8, 96.2 at 5 mM |
27 |
| (b) 4-(4′-Methoxylphenyl)-6-(phenyl)-3,4-dihydro-pyrimidine-2(1H)-thione in 2.0 M H2SO4 (ref. 39) for stainless steel 304 |
| (3a, MA-1230), (3b, MA-1231) and (3c, MA-1232) |
Copper |
1 M HNO3 |
90.3–92.1 at 21 μM |
28 |
| (i) Ethyl(2-amino-5-methyl[1,2,4]-triazolo[1,5-a]pyrimidin-7-yl)acetate |
Mild steel |
1 M HCl |
84, 85, respectively at 10−3 M |
29 |
| (ii) Ethyl(5-methyl[1,2,4]triazolo[1,5-a]pyrimidin-7-yl)-acetate |
The efficacy of the organic compounds including hetero atoms as corrosion inhibitors in acidic solutions for C-steels is well recognized.30–34 Pyrimidines and their derivatives are important because they are available in nature, particularly in the nucleobases present in nucleic acids, and many of them have been discovered to be beneficial in chemotherapy.35 Currently in use as anticancer, antifungal, and antibacterial medicines are pyrimidine-containing chemotherapeutics.36 Furthermore, in HCl and H2SO4 solutions, several pyrimidine derivatives were found to be efficient corrosion inhibitors for steel.37
The purpose of this work is to study the impact of 5-arylidene barbituric acid derivatives as ecofriendly inhibitors for C-steel in 1 M hydrochloric acid solution by applying WL, PP, EIS, and EFM tests. These 5-arylidene 1,3-dialkylbarbituric acid derivatives are less toxic, have large molecular sizes, and contain donating atoms such as N, O, S, benzene ring, and groups such as CH3 or C2H5. In addition, computational studies (i.e., DFT calculation and MC simulations) were undertaken to demonstrate the adsorption sites found in the inhibitor's molecules. These 5-arylidene barbituric acid derivatives have not been reported as corrosion inhibitors for steel in the literature until now.
2 Materials and methods
2.1 Materials
The chemical configuration of C-steel samples in weight percentage is carbon (0.200%); manganese (0.350%); phosphor (0.024%); chromium; sulfur (0.003%); and balance iron.
2.2 Inhibitors
5-Arylidene barbituric acid derivatives were synthesized as outlined in Scheme 1 (molecular formula, molecular weights, and structures of the studied compounds are presented in Table 1). The detailed information of inhibitor I (3a), including the spectroscopic data has been reported,38 mp 229–231 °C, IR (KBr) ν′/cm−1: 3122, 3004 (sp2 C–H stretch), 2947, 2906, 2839 (sp3 C–H stretch), 1720, 1651 (CO stretch), 1598, 1556, 1502 (C![[double bond, length as m-dash]](https://www.rsc.org/images/entities/char_e001.gif) C stretch). 1H-NMR (CDCl3); δ 3.39, 3.40 (2 s, 6H; 2× N–CH3), 3.97, 3.98 (2s, 6H; 2× OCH3), 6.94 (d, J = 8.7 Hz, 1H), 7.78 (dd, J = 8.7 Hz, 2.1 Hz, 1H), 8.38 (d, J = 2.1 Hz, 1H), 8.48 (s, 1H, methine H). Inhibitor II (3b) was prepared by the treatment of 1,3-diethylthiobarbituric acid (1b, 5 mmol) with 3,4-dimethoxybenzaldehyde (2, 5 mmol) in 30 mL methanol at reflux in the presence of triethylamine as the catalyst to afford inhibitor II (3b) in 84% yield, mp 186–187 °C (DMF/EtOH), lit39 mp 185–187 °C; IR (KBr) ν′/cm−1: 3115 (sp2 C–H stretch), 2976, 2928, (sp3 C–H stretch), 1689 (CO stretch), 1660, 1541, 1502 (C
C stretch). 1H-NMR (CDCl3); δ 3.39, 3.40 (2 s, 6H; 2× N–CH3), 3.97, 3.98 (2s, 6H; 2× OCH3), 6.94 (d, J = 8.7 Hz, 1H), 7.78 (dd, J = 8.7 Hz, 2.1 Hz, 1H), 8.38 (d, J = 2.1 Hz, 1H), 8.48 (s, 1H, methine H). Inhibitor II (3b) was prepared by the treatment of 1,3-diethylthiobarbituric acid (1b, 5 mmol) with 3,4-dimethoxybenzaldehyde (2, 5 mmol) in 30 mL methanol at reflux in the presence of triethylamine as the catalyst to afford inhibitor II (3b) in 84% yield, mp 186–187 °C (DMF/EtOH), lit39 mp 185–187 °C; IR (KBr) ν′/cm−1: 3115 (sp2 C–H stretch), 2976, 2928, (sp3 C–H stretch), 1689 (CO stretch), 1660, 1541, 1502 (C![[double bond, length as m-dash]](https://www.rsc.org/images/entities/char_e001.gif) C stretch), 1381 (C
C stretch), 1381 (C![[double bond, length as m-dash]](https://www.rsc.org/images/entities/char_e001.gif) S stretch) cm−1. 1H-NMR (DMSO-d6); δ 1.15–1.21 (m, 6H; 2× CH3 of ethyl group), 3.81 (s, 3H; OCH3), 3.89 (s, 3H; OCH3), 4.39–4.44 (m, 4H; 2× CH2 of ethyl group), 7.13 (d, J = 8.5 Hz, 1H), 7.99 (dd, J = 8.5 Hz, 2.0 Hz, 1H), 8.23 (d, J = 2.0 Hz, 1H), 8.36 (s, 1H, methine proton). MS (EI) m/z (rel. int.); 348 (M+, 100).
S stretch) cm−1. 1H-NMR (DMSO-d6); δ 1.15–1.21 (m, 6H; 2× CH3 of ethyl group), 3.81 (s, 3H; OCH3), 3.89 (s, 3H; OCH3), 4.39–4.44 (m, 4H; 2× CH2 of ethyl group), 7.13 (d, J = 8.5 Hz, 1H), 7.99 (dd, J = 8.5 Hz, 2.0 Hz, 1H), 8.23 (d, J = 2.0 Hz, 1H), 8.36 (s, 1H, methine proton). MS (EI) m/z (rel. int.); 348 (M+, 100).
 |
| | Scheme 1 Synthetic routes of 5-aryldine 1,3-dialkylbarbituric acid derivatives. | |
Table 1 The molecular structure of the investigated inhibitors
| Inhibitors |
Structure/chemical name |
| Inhibitor (I) |
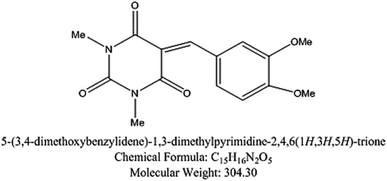 |
| Inhibitor (II) |
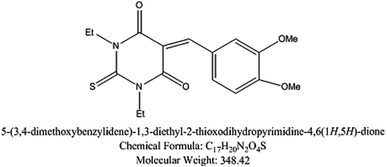 |
2.3 Aqueous solutions
The corrosive solutions, 1 M hydrochloric acid, was prepared by the dilution of analytical grade 37% hydrochloric acid via double-distilled water, and the concentration range of the applied inhibitors was 1–21 × 10−6 M.
2.4 Weight loss (WL) method
Seven identical pieces of C-steel having dimensions 2.5 × 2.0 × 0.06 cm2 were polished by abrasive paper (grades 320–1200), then washed by double-distilled water. The pieces were weighted and submerged in a 100 mL beaker, including 100 mL hydrochloric acid without and with diverse concentrations of the examined inhibitors.
Corrosive acid solutions were left open in air. After 30 min intervals, pieces were ejected, cleaned, dried, and then weighed perfectly for 3 h. The θ and IE% of the examined inhibitors were calculated from the subsequent equation.40
| |
 | (1) |
where,
W° and
W are the values of the average weight loss without and with the inhibitor, respectively.
2.5 Electrochemical techniques
Electrochemical measurements were taken within a traditional three electrode glass cell including saturated calomel electrode (SCE) linked with fine “Luggin capillary, platinum counter electrode, and the working electrode was carbon steel with a square cut shape and surface area of 1.0 × 1.0 cm2. PP curves were established by altering the electrode potential automatically from −1000 to 0.0 mV vs. OCP with a sweep rate of 0.2 mV s−1. The Stern-Geary41 definition of corrosion current was achieved via deducing on cathodic and anodic Tafel lines to a point that provides log![[thin space (1/6-em)]](https://www.rsc.org/images/entities/char_2009.gif) icorr and the resulting Ecorr for inhibitor-free acid and to any concentration of the inhibitor. Thereafter, icorr can be applied to examine of θ and IE% as:
icorr and the resulting Ecorr for inhibitor-free acid and to any concentration of the inhibitor. Thereafter, icorr can be applied to examine of θ and IE% as:| |
 | (2) |
where, icorr(free) and icorr(inh) are the corrosion current densities in the absence and presence of the inhibitor, respectively.
EIS was applied within the frequency range from 100 kHz to 10 mHz and 5 mV amplitude peak-to-peak at OCP. The θ and the IE% achieved from the impedance calculation were assessed through the following equation.
| |
 | (3) |
where,

and
Rct are the resistance of charge transfer in the absence and existence of the inhibitor, respectively.
EFM tests were accomplished via dual frequencies 2 and 5 Hz with a base frequency of 0.1 Hz; consequently, the wave shape repeats subsequently at 1 s. The large peaks located in the intermodulation spectra were utilized to assess the corrosion current density (icorr), the Tafel slopes (βa and βc), and CF-2 & CF-3;42,43 %IE and θ were assessed from eqn (2).
All electrochemical experiments were carried out in the solution at 25 ± 1 °C. The potential of the electrode can be permitted until it becomes stable 30 min prior to the start of the measurements. All electrochemical experiments were done at 25 ± 1 °C and accomplished via a Gamry (PCI4/750G) Potentiostat/Galvanostat/ZRA. This includes the Gamry Framework for controlling and the Echem Analyst 5.58 software for data analysis and plotting.
2.6 DFT calculations and MC simulations
The Dmol3 and adsorption locator modules of Accelrys Inc., USA Materials Studio software V.7.0 were used to perform the DFT calculations and MC simulations. The GGA/BLYP basis set in the aqueous phase was used to optimize the 5-arrylidene barbituric acid derivative molecules.44 The following equations were used to compute various quantum parameters such as ionization potential (I), electron affinity (A), electronegativity (χ), global hardness (η), and global softness (σ).45| |
 | (6) |
| |
 | (7) |
| |
 | (8) |
The fraction of electrons transferred (ΔN) from the inhibitor molecules to the metallic surface through adsorption can be determined employing eqn (9):
| |
 | (9) |
where, “
χFe,
χinh,
ηFe, and
ηinh are the electronegativity and hardness values of Fe and inhibitor molecules, respectively. The value of
χFe is 7.00 eV and
ηFe is 0.
46 The adsorption locator discovers the potential adsorption configurations of the 5-arylidene barbituric acid derivative molecules with Monte Carlo searches on the Fe (1 1 0) surface for assessing the inhibition performance of 5-arylidene barbituric acid derivative molecules.
47 In a simulation box (32.27 Å × 32.27 Å × 50.18 Å) with periodic boundary conditions, the interactions of 5-arylidene barbituric acid molecules and the surface of Fe (110) were accomplished. The energy optimization of 5-arylidene barbituric acid derivatives molecules was implemented by exploiting Forcite classical simulation engine.
48 The corrosion system in the aqueous media was established
via the layer builder, and this system involves the optimized 5-arylidene barbituric acid derivatives molecules, Fe (110) surface, and water. For the adsorption capacity simulation of 5-arylidene barbituric acid derivative molecules on the surface of Fe (110), the COMPASS simulation investigation with force field was executed.
49
2.7 Surface examinations
C-Steel samples prior and after immersion in 1 M HCl solutions without and with 21 × 10−6 M of compound I and II for 24 h at 25 °C were examined. Then, the C-steel samples were taken and dried. Surface examinations of C-steel samples were achieved by a JEOL JSM-6510 LV for SEM and EDX analysis.
3 Results and discussion
3.1 Weight loss (WL) method
The WL-time diagrams for the corrosion of C-steel in 1 M hydrochloric solution before and after the addition of diverse concentrations of compounds (I and II) are displayed within Fig. 1. This figure demonstrates that the values of WL for C-steel with 1 M hydrochloric acid solution lies higher than that in inhibitors and the WL decreases as the inhibitor dose increases, which means the strengthening of corroiksion inhibition on increasing the inhibitor concentration, as listed in Table 2. This explains the adsorption of inhibitor molecules on the C-steel surface, i.e., the C-steel surface is shielded from the aqueous media by the creation of a protecting film on this surface.50,51 The order of inhibition proficiency for 5-arylidene barbituric acid derivatives achieved from the WL method is inhibitor II > inhibitor I.
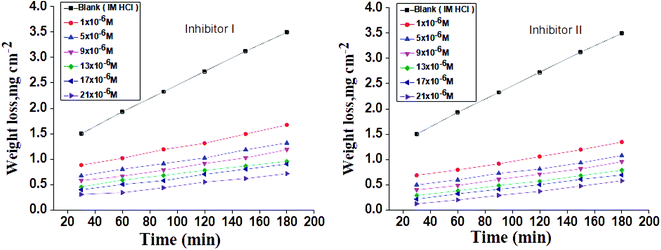 |
| | Fig. 1 Time-WL curves for C-steel in 1 M HCl in the absence and presence of diverse doses of inhibitors (I and II) at 25 °C. | |
Table 2 Variation of %IE with altered doses of the investigated compounds at 25 °C from WL measurements at 120 min dipping in 1.0 M HCl
| Comp. |
Conc. (M) |
C.R. (mg cm−2 min−1) |
%IE |
| Blank |
— |
0.028 ± 0.0021 |
— |
| Inhibitor (I) |
1 × 10⁻⁶ |
0.015 ± 0.0015 |
60.8 |
| 5 × 10⁻⁶ |
0.012 ± 0.0023 |
65.5 |
| 9 × 10⁻⁶ |
0.010 ± 0.0009 |
70.9 |
| 13 × 10−6 |
0.008 ± 0.0019 |
70.9 |
| 17 × 10−6 |
0.007 ± 0.0009 |
81.0 |
| 21 × 10−6 |
0.006 ± 0.0023 |
86.6 |
| Inhibitor (II) |
1 × 10⁻⁶ |
0.012 ± 0.0026 |
69.1 |
| 5 × 10⁻⁶ |
0.009 ± 0.0021 |
73.9 |
| 9 × 10⁻⁶ |
0.007 ± 0.0017 |
79.2 |
| 13 × 10−6 |
0.006 ± 0.0021 |
82.5 |
| 17 × 10−6 |
0.005 ± 0.0017 |
87.6 |
| 21 × 10−6 |
0.003 ± 0.0020 |
92.8 |
3.2 PP studies
Fig. 2 illustrates the Tafel polarization diagrams for C-steel in 1 M hydrochloric acid in the absence and presence of diverse inhibitors doses at 25 °C, respectively. From Fig. 2, it is obvious that anodic metal dissolution and cathodic H2 reduction reactions were controlled when these inhibitors were added to 1 M HCl solution. Also, this inhibition was more obvious with increasing doses of inhibitors. Also, these figures show that the cathodic curves give approximately parallel lines, suggesting that the hydrogen discharge reaction lowers, its activation being controlled52 by the addition of inhibitors in aggressive medium. The inhibition mode of the anodic process depends on the electrode potential.52 Table 3 illustrates that icorr declines with the addition of the inhibitors and by increasing their doses. Furthermore, Ecorr does not change clearly (70 and 44 mV for I and II, respectively), and this exhibits that these derivatives are considered as mixed-type inhibitors.53 Moreover, Tafel slopes [βa‚ βc] are almost constant, indicating that the two reactions (i.e., anodic metal dissolution and cathodic hydrogen reduction) were slightly affected without altering the mechanism of dissolution.54,55 The order of inhibition efficiency for 5-arylidene barbituric acid derivatives achieved from PP studies is inhibitor II > inhibitor I.
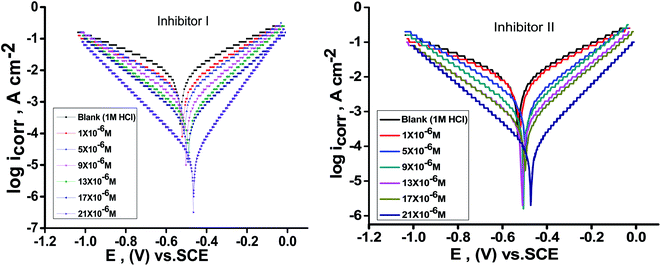 |
| | Fig. 2 PP diagrams for the dissolution of C-steel in 1 M HCl in the presence and absence of altered doses of inhibitors (I & II) at 25 °C. | |
Table 3 Corrosion parameters of C-steel electrode in 1 M HCl solution containing altered doses of inhibitors (I & II) at 25 °C from the PP technique
| Comp. |
Conc., M |
−Ecorr mV vs. SCE |
icorr mA cm−2 |
βc mV dec−1 |
βa mV dec−1 |
C.R. mmy−1 |
θ |
%IE |
| 1 M HCl |
00 |
531 ± 0.2028 |
422 ± 0.2028 |
42 ± 0.2028 |
22 ± 0.1453 |
220.6 |
— |
— |
| Inhibitor (I) |
1 × 10⁻⁶ |
515 ± 0.2431 |
246 ± 0.1155 |
26 ± 0.1421 |
13 ± 0.2906 |
130.0 |
0.459 |
45.9 |
| 5 × 10⁻⁶ |
534 ± 0.2055 |
234 ± 0.2603 |
48 ± 0.1535 |
39 ± 0.2624 |
96.2 |
0.634 |
63.4 |
| 9 × 10⁻⁶ |
494 ± 0.1452 |
214 ± 0.1764 |
47 ± 0.1214 |
50 ± 0.2224 |
75.4 |
0.791 |
79.1 |
| 13 × 10−6 |
502 ± 0.1742 |
174 ± 0.2028 |
82 ± 0.1121 |
47 ± 0.2006 |
62.4 |
0.814 |
81.4 |
| 17 × 10−6 |
512 ± 0.2102 |
101 ± 0.1732 |
74 ± 0.1074 |
85 ± 0.2421 |
45.1 |
0.834 |
83.4 |
| 21 × 10−6 |
464 ± 0.2209 |
58 ± 0.1453 |
127 ± 0.231 |
57 ± 0.2028 |
29.2 |
0.906 |
90.6 |
| Inhibitor (II) |
1 × 10⁻⁶ |
516 ± 0.2119 |
223 ± 0.1732 |
20 ± 0.2333 |
15 ± 0.2082 |
119.5 |
0.644 |
64.4 |
| 5 × 10⁻⁶ |
496 ± 0.2010 |
180 ± 0.2028 |
46 ± 0.1202 |
19 ± 0.1732 |
80.9 |
0.702 |
70.2 |
| 9 × 10⁻⁶ |
504 ± 0.1753 |
126 ± 0.2010 |
45 ± 0.1732 |
32 ± 0.2082 |
45.9 |
0.725 |
72.5 |
| 13 × 10−6 |
510 ± 0.1613 |
101 ± 0.1764 |
75 ± 0.1453 |
41 ± 0.1764 |
41.2 |
0.782 |
78.2 |
| 17 × 10−6 |
498 ± 0.1421 |
80 ± 0.1453 |
67 ± 0.2027 |
39 ± 0.1154 |
36.6 |
0.837 |
83.7 |
| 21 × 10−6 |
472 ± 0.1253 |
45 ± 0.1732 |
112 ± 0.233 |
67 ± 0.1245 |
20.9 |
0.924 |
92.4 |
3.3. EIS studies
The impact of the dose of the inhibitor on the impedance of C-steel in 1 M HCl at 25 °C is shown in Fig. 3a and b. The curves showed identical Nyquist curves for C-steel in the presence of diverse doses of inhibitors (I & II). The presence of a single semi-circle displayed the single charge transfer procedure through dissolution, which is unaltered in the presence of inhibitors. Deviations from the ideal circular form frequently signal the frequency dispersal of impedance interfacial, which occurs because of impurities, surface coarseness, grain limits, dislocations, forming of porous layers, and adsorption of derivatives, which is also homogenized on the surface of the electrode.56,57 The observation of these data detected from all the impedance graphs contains a large capacitive circle by only time constant of capacitance with the Bode-phase graphs (Fig. 3b). In the Bode diagram (Fig. 3b), it can be seen that the impedance response of C-steel in HCl solution shows a significant change after inhibitor addition, indicating that the electrode impedance increases with increasing inhibitor doses. From the Bode graph, it may be observed that the phase angle does not exceed 90 °C. The electrical equivalent circuit is displayed in Fig. 4 and it is applied for examining the impedance data. This circuit involves Rct, Cdl, and also the solution resistance (Rs). Excellent fit through this model can be gained through the experimental data. The EIS outcomes in Table 4 distinguished that the Cdl values decline and the Rct values increase by increasing the doses of the inhibitors. This is due to the exchange of the adsorbed water molecules with the inhibitor molecules on the surface of the metal, decreasing the metal dissolution reaction.58,59 The decrease in Cdl can be caused by a drop in the local dielectric constant and/or a rise in the thickness of the double electrical layer, which suggests that the inhibitor molecules function through adsorption at the metal and solution interface.60 It is also worth noting that the “n” values increases as the inhibitor doses increase. This can be explained by the reduction in the surface heterogeneity caused by inhibitor molecules adsorbed on the C-steel surface. The precision of fitting outputs was assessed using a chi-square test for goodness of fit; the tiny chi-square values (Table 4) obtained for all the outcomes suggest that the fitted results are very close to the experimental findings. The %IE obtained from the EIS studies are close to those inferred from the PP studies. The order of %IE for 5-arrylidene barbituric acid derivatives achieved from the EIS studies is inhibitor II > inhibitor I.
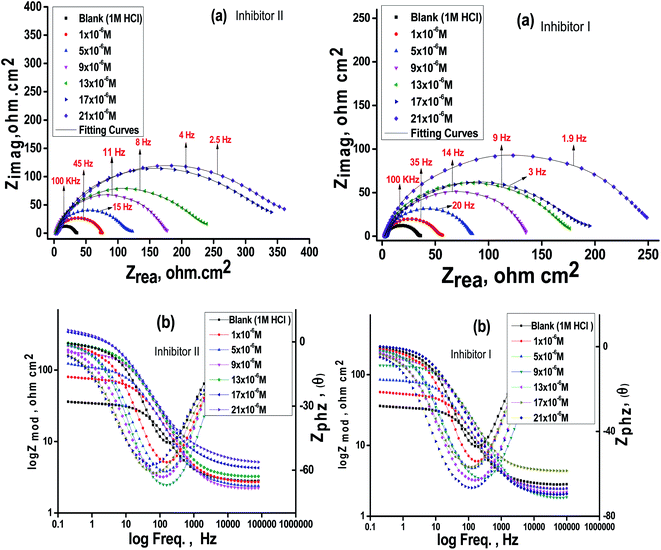 |
| | Fig. 3 Nyquist (a) and Bode (b) plots for C-steel in 1 M HCl at altered doses of the inhibitors (I & II) at 25 °C. | |
 |
| | Fig. 4 Electrical equivalent circuit model utilized to fit the results of impedance. | |
Table 4 EIS data of C-steel in 1 M HCl and in the presence of altered doses of the investigated inhibitors (I & II) at 25 °C
| Comp. |
Conc., M |
Cdl, μF cm−2 |
Rct, Ω cm2 |
n |
θ |
IE% |
χ2 |
| 1 M HCl |
00 |
117.9 ± 0.2333 |
31.8 ± 0.1764 |
0.84 ± 0.01 |
— |
— |
0.002 |
| Inhibitor (I) |
1 × 10⁻⁶ |
93.7 ± 0.2145 |
51.6 ± 0.1453 |
0.85 ± 0.02 |
0.386 |
38.6 |
0.004 |
| 5 × 10⁻⁵ |
88.9 ± 0.1453 |
81.6 ± 0.2028 |
0.85 ± 0.02 |
0.613 |
61.3 |
0.003 |
| 9 × 10⁻⁵ |
81.2 ± 0.1732 |
134.1 ± 0.2309 |
0.87 ± 0.01 |
0.764 |
76.4 |
0.005 |
| 13 × 10−5 |
78.9 ± 0.1245 |
178.3 ± 0.1732 |
0.86 ± 0.01 |
0.822 |
82.2 |
0.001 |
| 17 × 10−5 |
63.6 ± 0.1178 |
197.3 ± 0.2028 |
0.87 ± 0.02 |
0.839 |
83.9 |
0.006 |
| 21 × 10−5 |
61.7 ± 0.1714 |
244 ± 0.1453 |
0.88 ± 0.03 |
0.870 |
87.0 |
0.007 |
| Inhibitor (II) |
1 × 10⁻⁶ |
91.4 ± 0.1412 |
74.3 ± 0.1241 |
0.90 ± 0.01 |
0.572 |
57.2 |
0.002 |
| 5 × 10⁻⁵ |
86.3 ± 0.1453 |
110.9 ± 0.1653 |
0.91 ± 0.01 |
0.715 |
71.5 |
0.003 |
| 9 × 10⁻⁵ |
79.6 ± 0.2333 |
168.4 ± 0.1012 |
0.92 ± 0.01 |
0.812 |
81.2 |
0.001 |
| 13 × 10−5 |
73.1 ± 0.1453 |
219.6 ± 0.1893 |
0.92 ± 0.01 |
0.856 |
85.6 |
0.004 |
| 17 × 10−5 |
64.9 ± 0.1202 |
330.4 ± 0.1987 |
0.93 ± 0.01 |
0.904 |
90.4 |
0.007 |
| 21 × 10−5 |
57.6 ± 0.1553 |
364.3 ± 0.1453 |
0.95 ± 0.01 |
0.913 |
91.3 |
0.006 |
3.4. EFM studies
The EFM spectral intermodulation for C-steel in 1 M hydrochloric acid solution before and after adding 21 × 10−6 M of the inhibitors (I & II) are displayed in Fig. 5. The bigger peaks were applied to examine icorr, βc, βa, CF-2, and CF-3. The electrochemical factors were concurrently specified and then recorded in Table 5. It can be viewed from this Table 5 that the values of icorr decrease in the presence of various doses of 5-arrylidene barbituric acid derivatives than in the presence of only 1 M HCl in the C-steel. The obtained causality factors for the examined data are in excellent quality with their theoretical (2 & 3) values. The order of %IE for 5-arrylidene barbituric acid derivatives achieved from EFM studies is inhibitor II > inhibitor I.
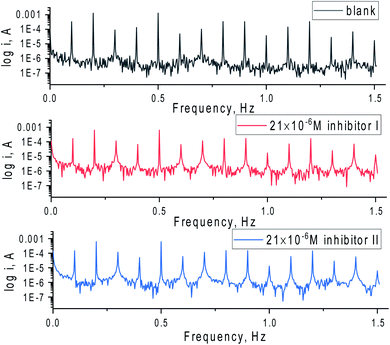 |
| | Fig. 5 EFM spectra for C-steel in 1 M HCl with and without 21 × 10−6 M of the inhibitors (I & II) at 25 °C. | |
Table 5 EFM parameters for C-steel 1 M HCl solution and the presence of altered doses of inhibitors I & II at 25 °C
| Comp. |
Conc., M |
icorr, μA cm−2 |
βa, mV dec−1 |
βc, mV dec−1 |
C.F (2) |
C.F (3) |
C.R., mmy−1 |
θ |
IE% |
| 1 M HCl |
00 |
808.5 ± 0.2028 |
112.9 ± 0.2028 |
163.7 ± 0.1155 |
2.09 |
1.75 |
370.2 |
|
— |
| Inhibitor (I) |
1 × 10⁻⁶ |
434.9 ± 0.2431 |
95.9 ± 0.2134 |
137 ± 0.1245 |
2.03 |
3.3 |
198.7 |
0.462 |
46.2 |
| 5 × 10⁻⁶ |
313 ± 0.1452 |
101.9 ± 0.2354 |
144 ± 0.1158 |
2.02 |
2.36 |
143.1 |
0.613 |
61.3 |
| 9 × 10⁻⁶ |
197.5 ± 0.2431 |
114.4 ± 0.2222 |
120 ± 0.1447 |
2.1 |
3.15 |
90.2 |
0.756 |
75.6 |
| 13 × 10−6 |
141.3 ± 0.2102 |
110.9 ± 0.2145 |
115.7 ± 0.2603 |
1.37 |
2.18 |
64.6 |
0.825 |
82.5 |
| 17 × 10−6 |
120.7 ± 0.2209 |
106.3 ± 0.2055 |
109.1 ± 0.2245 |
1.44 |
3.77 |
55.2 |
0.851 |
85.1 |
| 21 × 10−6 |
99.8 ± 0.2010 |
104.4 ± 0.2218 |
116.1 ± 0.2403 |
1.54 |
1.37 |
45.6 |
0.877 |
87.7 |
| Inhibitor (II) |
1 × 10⁻⁶ |
327.6 ± 0.1753 |
147.7 ± 0.1732 |
149.7 ± 0.2028 |
2.18 |
1.98 |
149.7 |
0.595 |
59.5 |
| 5 × 10⁻⁶ |
168 ± 0.2028 |
94.8 ± 0.2309 |
97.11 ± 0.2245 |
1.70 |
2.87 |
77.1 |
0.792 |
79.2 |
| 9 × 10⁻⁶ |
140 ± 0.1732 |
87.9 ± 0.2333 |
149.5 ± 0.2358 |
1.93 |
3.32 |
64.1 |
0.827 |
82.7 |
| 13 × 10−6 |
94.9 ± 0.1453 |
87.6 ± 0.1202 |
125.1 ± 0.2475 |
2.08 |
3.82 |
43.4 |
0.883 |
88.3 |
| 17 × 10−6 |
85.9 ± 0.2333 |
129.4 ± 0.1732 |
152.1 ± 0.2333 |
1.78 |
1.27 |
34.6 |
0.894 |
89.4 |
| 21 × 10−6 |
75.7 ± 0.1764 |
113.7 ± 0.1453 |
119.4 ± 0.2578 |
1.35 |
3.01 |
39.3 |
0.906 |
90.6 |
3.5 Effectiveness of temperature
The impact of the temperature on the rate of corrosion of C-steel in 1 M HCl including a diverse concentration of the investigated inhibitors can be examined via the WL method in the temperature ranges from 25 to 55 °C (Table 6). The outcomes showed that by raising the temperature the rate of corrosion rises and declines with dose of these compounds rises for the investigated inhibitors.
Table 6 Data of WL measurements for C-steel in 1 M HCl solution with and without altered doses of inhibitors (I & II) at 25–55 °C
| Inh. |
Conc. (M) |
Temp. (°C) |
CR (mg cm−2 min−1) |
θ |
%IE |
| Inhibitor (I) |
Blank (1 M HCl) |
25 |
0.028 |
— |
— |
| 35 |
0.033 |
— |
— |
| 45 |
0.039 |
— |
— |
| 55 |
0.045 |
— |
— |
| 1 × 10⁻⁶ |
25 |
0.015 |
0.489 |
48.9 |
| 35 |
0.021 |
0.737 |
73.7 |
| 45 |
0.027 |
0.301 |
30.1 |
| 55 |
0.033 |
0.265 |
26.5 |
| 5 × 10⁻⁶ |
25 |
0.012 |
0.608 |
60.8 |
| 35 |
0.017 |
0.483 |
48.3 |
| 45 |
0.023 |
0.408 |
40.8 |
| 55 |
0.027 |
0.386 |
38.6 |
| 9 × 10⁻⁶ |
25 |
0.010 |
0.655 |
65.5 |
| 35 |
0.014 |
0.568 |
56.8 |
| 45 |
0.019 |
0.491 |
49.1 |
| 55 |
0.024 |
0.467 |
46.7 |
| 13 × 10−6 |
25 |
0.008 |
0.709 |
70.9 |
| 35 |
0.012 |
0.626 |
62.6 |
| 45 |
0.017 |
0.545 |
54.5 |
| 55 |
0.022 |
0.515 |
51.5 |
| 17 × 10−6 |
25 |
0.007 |
0.742 |
74.2 |
| 35 |
0.010 |
0.689 |
68.9 |
| 45 |
0.015 |
0.621 |
62.1 |
| 55 |
0.018 |
0.592 |
59.2 |
| 21 × 10−6 |
25 |
0.006 |
0.805 |
80.5 |
| 35 |
0.008 |
0.758 |
75.8 |
| 45 |
0.012 |
0.693 |
69.3 |
| 55 |
0.014 |
0.689 |
68.9 |
| Inhibitor (II) |
1 × 10⁻⁶ |
25 |
0.012 |
0.691 |
69.1 |
| 35 |
0.016 |
0.608 |
60.8 |
| 45 |
0.023 |
0.569 |
56.9 |
| 55 |
0.028 |
0.471 |
47.1 |
| 5 × 10⁻⁶ |
25 |
0.009 |
0.739 |
73.9 |
| 35 |
0.014 |
0.655 |
65.5 |
| 45 |
0.020 |
0.638 |
63.8 |
| 55 |
0.024 |
0.558 |
55.8 |
| 9 × 10⁻⁶ |
25 |
0.007 |
0.792 |
79.2 |
| 35 |
0.011 |
0.709 |
70.9 |
| 45 |
0.017 |
0.671 |
67.1 |
| 55 |
0.022 |
0.581 |
58.1 |
| |
13 × 10−6 |
25 |
0.006 |
0.825 |
82.5 |
| 35 |
0.009 |
0.742 |
74.2 |
| 45 |
0.015 |
0.700 |
70.0 |
| 55 |
0.018 |
0.627 |
62.7 |
| 17 × 10−6 |
25 |
0.005 |
0.876 |
87.6 |
| 35 |
0.007 |
0.810 |
81.0 |
| 45 |
0.012 |
0.754 |
75.4 |
| 55 |
0.015 |
0.686 |
68.6 |
| 21 × 10−6 |
25 |
0.003 |
0.928 |
92.8 |
| 35 |
0.005 |
0.866 |
86.6 |
| 45 |
0.009 |
0.799 |
79.9 |
| 55 |
0.011 |
0.747 |
74.7 |
The activation energy  can be examined by applying Arrhenius equation:
| |
 | (10) |
where,
A is the Arrhenius constant and
k is the rate of corrosion. Straight lines are displayed in
Fig. 6 and their linear regression (
R2) is nearer to 1, and
E* can be obtained from the slope.
Table 6 displayed that the value of

for the uninhibited solution is lower than that of the inhibited solution, supposing that the dissolution of C-steel is slow within existence of inhibitor.
61 This is recognized from
eqn (10) to be the higher values of

, which cause a lower corrosion rate owing to the construction of the protecting film on the C-steel surface acting as an energy barrier of the C-steel corrosion.
62–64 Entropy and enthalpy of activation (Δ
S*, Δ
H*) of the corrosion procedure were determined from the transition state theory.
| |
 | (11) |
where,
N is Avogadro's number and
h is Planck's constant. The graphs of log
![[thin space (1/6-em)]](https://www.rsc.org/images/entities/char_2009.gif) k
k/
T versus 1/
T of C-steel with 1 M hydrochloric acid solution at diverse doses from the examined compounds, provides straight lines as displayed in
Fig. 7 for the inhibitors. The thermodynamic parameters are listed in
Table 7 shows that the Δ
H* values are positive, which signals that the steel dissolution process is endothermic process”. High and negative values of Δ
S* show that the activated complex is found in an associated form more than the dissociated form.
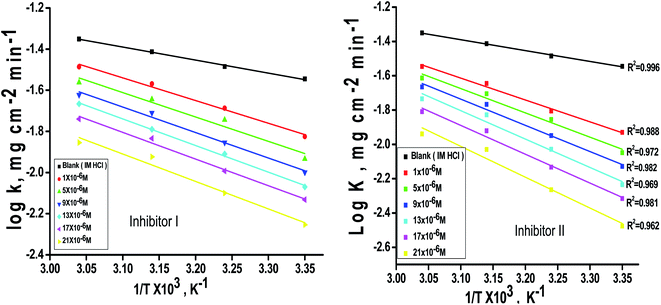 |
| | Fig. 6 log![[thin space (1/6-em)]](https://www.rsc.org/images/entities/char_2009.gif) k − 1/T curves for C-steel dissolution in 1.0 M HCl in the absence and existence of altered doses of inhibitor (I and II). k − 1/T curves for C-steel dissolution in 1.0 M HCl in the absence and existence of altered doses of inhibitor (I and II). | |
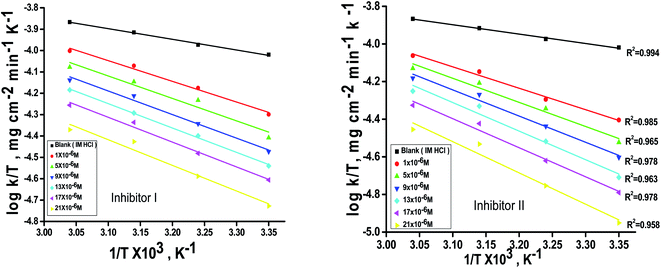 |
| | Fig. 7 log![[thin space (1/6-em)]](https://www.rsc.org/images/entities/char_2009.gif) k/T–1/T curves for C-steel dissolution in 1 M HCl and the presence of altered doses the investigated inhibitors (I & II). k/T–1/T curves for C-steel dissolution in 1 M HCl and the presence of altered doses the investigated inhibitors (I & II). | |
Table 7 Activation parameters for the dissolution of C-steel in the absence and existence of altered doses of inhibitors (I & II) in 1 M HCl
| Inhibitor |
Activation parameters |
| Conc., M |

, kJ mol−1 |
ΔH*, kJ mol−1 |
−ΔS*, J mol−1 K−1 |
(R2) |
| |
Blank |
12.2 ± 0.1453 |
9.6 ± 0.1879 |
108.6 ± 0.2333 |
0.9941 |
| Inhibitor (I) |
1 × 10⁻⁶ |
21.1 ± 0.1678 |
18.6 ± 0.1456 |
83.5 ± 0.2028 |
0.9844 |
| 5 × 10⁻⁶ |
22.7 ± 0.1478 |
20.2 ± 0.1453 |
80.1 ± 0.1453 |
0.9381 |
| 9 × 10⁻⁶ |
23.7 ± 0.1212 |
21.2 ± 0.2333 |
78.2 ± 0.1732 |
0.9834 |
| 1.3 × 10⁻⁵ |
24.8 ± 0.1893 |
21.9 ± 0.2245 |
77.6 ± 0.2128 |
0.9969 |
| 1.7 × 10⁻⁵ |
24.8 ± 0.2253 |
22.3 ± 0.2357 |
77.1 ± 0.1453 |
0.9849 |
| 2.1 × 10⁻⁵ |
25.64 ± 0.1741 |
23.1 ± 0.2783 |
67.9 ± 0.1764 |
0.9563 |
| Inhibitor (II) |
1 × 10⁻⁶ |
24.4 ± 0.2025 |
21.8 ± 0.2473 |
74.8 ± 0.1547 |
0.9859 |
| 5 × 10⁻⁶ |
27.1 ± 0.1732 |
24.5 ± 0.2214 |
67.5 ± 0.2264 |
0.9658 |
| 9 × 10⁻⁶ |
29.2 ± 0.1000 |
26.7 ± 0.2008 |
64.9 ± 0.2041 |
0.9785 |
| 1.3 × 10⁻⁵ |
31.7 ± 0.1453 |
29.1 ± 0.2433 |
62.1 ± 0.1453 |
0.9636 |
| 1.7 × 10⁻⁵ |
32.2 ± 0.1732 |
29.6 ± 0.2245 |
55.9 ± 0.1732 |
0.9787 |
| 2.1 × 10⁻⁵ |
34.4 ± 0.1453 |
31.9 ± 0.2147 |
51.3 ± 0.2028 |
0.9562 |
3.6. Adsorption isotherm
Organic compounds inhibit metal corrosion through adsorption on the surface of the metal. The adsorption procedure is considered as a single replacement process of adsorbed water molecules (x) by a single inhibitor molecule.65,66| | |
I(aq) + xH2O(sur) → I(sur) + xH2O(aq)
| (12) |
Also, adsorption affords data regarding the interaction between the adsorbed molecules and the surface of the metal. The values of θ for diverse doses of the analyzed inhibitors at various temperatures have been applied to describe the most suitable adsorption isotherm to define the adsorption procedure. The outcomes of the studied inhibitors are suitable for the Langmuir adsorption isotherm. Fig. 8 displays the plotting of C/θ versus C at 25 °C to examine the inhibitors, respectively. The schemes provided straight lines with unit slope, which shows that the adsorption of the examined derivatives on the C-steel surface confirmed the Langmuir equation.67
| |
 | (13) |
where
C is the inhibitor concentration and
Kads is the adsorption equilibrium constant” associated with the free energy of adsorption Δ
Gads as follows.
68| |
 | (14) |
where
T is the absolute temperature,
R is the universal gas constant, and 55.5 is the concentration of water on the metal surface in M. The values of
Kads and

for 5-arylidene barbituric acid derivatives are listed in
Table 8. The increase in the negative value of

indicates that these compounds were strongly adsorbed on the C-steel surface in a stable state and that the adsorption process was spontaneous. Furthermore, the values of

are −32.5 and −33.0 kJ mol
−1, which indicates that the adsorption of 5-arylidene barbituric acid derivatives on C-steel is mixed-type,
i.e., physisorption and chemisorption, but mainly physisorption because the

values increase in the presence of inhibitors than in its absence and %inhibition decreases by increasing the temperature. In addition, the
Kads values were established to run analogous to the IE% (
KII >
KI). This result replicates the ability to grow on the metal surfaces due to structural development.
69
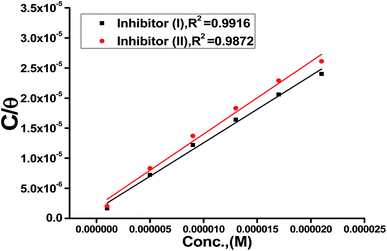 |
| | Fig. 8 Langmuir isotherm plots for C-steel in 1 M HCl containing various doses of inhibitors (I & II) at 25 °C. | |
Table 8 Equilibrium constant and adsorption free energy of the investigated inhibitors (I & II) adsorbed on C-steel surface at 25 °C
| Langmuir isotherm |
| Inhibitor |
K × 10−5, M−1 |

, kJ mol−1 |
Slope |
R2 |
| Inhibitor (I) |
5.07 ± 0.015 |
32.5 ± 0.1454 |
1.206 |
0.9720 |
| Inhibitor (II) |
6.97 ± 0.025 |
33.3 ± 0.2189 |
1.113 |
0.9910 |
3.7. DFT studies
In the aqueous phase, the optimal structure, HOMO, and LUMO distribution of 5-arylidene barbituric acid derivatives molecules are revealed in Fig. 9, and the quantum chemical characteristics are included in Table 9. Fig. 10 represents the energy diagram of the frontier molecular orbitals for the investigated compounds (I, II) and their assessed ΔE. The interaction between the inhibitor molecule and the metal is directed by the HOMO and LUMO energies, according to the frontier orbital theory.70 EHOMO signifies the capability of a molecule to contribute electrons and ELUMO signifies the capacity of a molecule to receive electrons.71 As a result, the corrosion inhibition capability of an inhibitor molecule with high EHOMO and low ELUMO values improves. Similarly, high corrosion protection efficiency was proposed for an inhibitor molecule with a low energy gap between the LUMO and HOMO energy (ΔE) since proffering an electron from EHOMO to ELUMO. As given in Table 9, compound II has a larger EHOMO value of −4.97 eV as related to compound I. As shown in Fig. 9, for the 5-arylidene barbituric acid derivatives molecules, we notice that the HOMO level is pinpointed on the phenyl, methoxy, and pyrimidine moieties, implying that the O and N atoms are the desired location for electrophilic attacks on the surface of C-steel. This would enhance the adsorption capability of 5-arylidene barbituric acid derivatives molecules on the C-steel surface and therefore enhance the protection efficiency, which is in concurs excellently with the empirical results. Moreover, the ELUMO values are −1.48 eV for compound II (Table 9) lower than those of compound I, indicating the great inhibition efficacy for compound II. Similarly, the energy gap (ΔE) is another critical aspect in approving the inhibitor molecule's corrosion prevention capability, which improves as the (ΔE) value decreases.72 Compound II exhibits lower (ΔE) values (1.78 eV) than compound I, as shown in Table 8, indicating a higher propensity for compound II to be adsorbed on the C-steel surface. Furthermore, because of the low electronegativity (χ), the 5-arylidene barbituric acid derivatives molecules have a high potential reactivity to offer electrons to the metal surface.73 Furthermore, the global hardness η and softness σ of a molecule are important qualities that determine its consistency and reactivity. Because electrons are smoothly afforded to the C-steel surface via adsorption, soft molecules are more reactive compared to hard molecules.74 The ΔN values determine the electron contributing capability of the inhibitors, and the higher the ΔN value, the larger the electron providing facility of the inhibitor molecule. According to Lukovits's study,75 when ΔN <3.6, the %IE improves with greater electron donating ability. Based on the calculated values of ΔN as listed in Table 9, the greater the ΔN values for compound II (1.64) than compound I. This means that compound II molecule has greater tendency to offer electrons to the surface of C-steel, as related to compound I. Furthermore, the dipole moment is an important indicator for forecasting the path of corrosion protection.76 The augmentation in the dipole moment leads to an increase in the deformation energy and better molecule adsorption on steel surface, enhancing the inhibitory activity.77 Compound II has a greater dipole moment value (7.95 debye) than compound I, as shown in Table 9, indicating a strong tendency for compound II to be adsorbed on the C-steel surface and enhance the inhibition effectiveness. Furthermore, the molecular size of the 5-arylidene barbituric acid derivatives and their tendency to protect the C-steel surface in corrosive environment have a clear relationship. The inhibition efficiency increases with increasing molecular structure size because of the contact area between the surfactant's molecules and the steel surface raise.78 As mentioned in Table 9, compound II demonstrates a greater area (396.36 Å2); for this purpose, they have greater inhibition proficiency than compound I. MEP mapping is a powerful 3D vision tool for distinguishing the net electrostatic effect established over a molecule from total charge dispersal.79 The red colors in Fig. 10 signify the highest electron density, with MEP being the biggest negative (nucleophilic reaction). The blue colors, on the other hand, signify the most positive region (electrophilic reaction).80 The largest negative (red color) regions in methoxy and pyrimidine moieties are generally over N and O atoms, whereas the lower density (green color) regions in 5-arylidene barbituric acid derivative molecules are mostly over the phenyl moieties. In the keto form, MEP, on the other hand, showed the most positive (blue hue) area over oxygen. The locations in 5-arylidene barbituric acid derivative molecules with the highest electron density may be the most proper for interactions with the C-steel surface. Fig. 11 represents the graphical presentation of MEP for inhibitors (I & II) using DFT calculations in the aqueous phase.
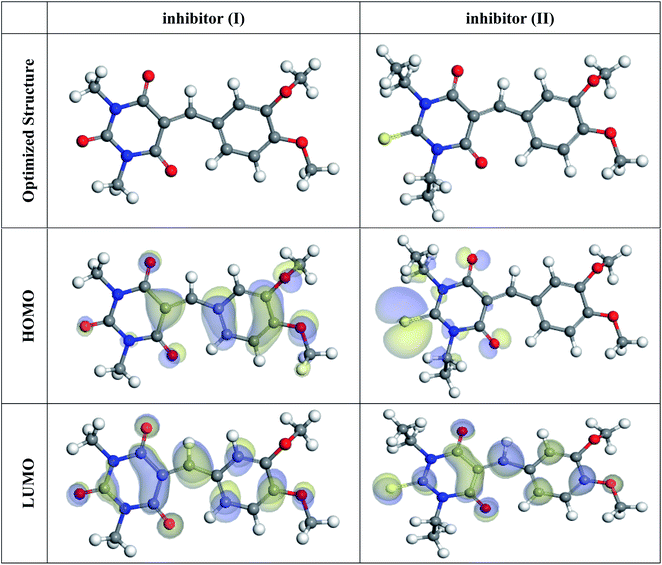 |
| | Fig. 9 The optimized molecular structures, HOMO, and LUMO for the barbituric acid derivatives using DFT calculations in the aqueous phase. | |
Table 9 Calculated quantum chemical parameters for the structure of inhibitors (I & II) in the aqueous phase
| Compound |
Inhibitor (I) |
Inhibitor (II) |
| EHOMO, eV |
−5.24 |
−4.97 |
| ELUMO, eV |
−2.96 |
−3.18 |
| ΔE, eV |
2.28 |
1.78 |
| I, eV |
5.24 |
4.97 |
| A, eV |
2.96 |
3.18 |
| χ, eV |
4.10 |
4.08 |
| η, eV |
1.14 |
0.89 |
| σ, eV |
0.88 |
1.12 |
| ΔN, eV |
1.27 |
1.64 |
| Dipole moment, Debye |
7.77 |
7.95 |
| Molecular surface area, Å2 |
316.86 |
396.36 |
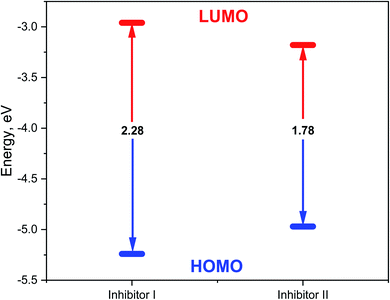 |
| | Fig. 10 Energy diagram of the frontier molecular orbitals for the investigated inhibitors (I, II) and their assessed ΔE. | |
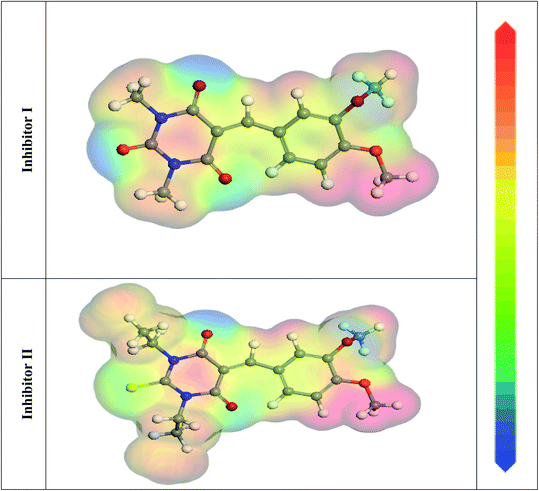 |
| | Fig. 11 Graphical presentation of the MEP for inhibitors (I & II) using DFT calculations in the aqueous phase. | |
3.8. MC simulations
MC simulations are theoretical approaches for comprehending the nature of the interaction between the 5-arylidene barbituric acid derivative molecules and the C-steel surface thru the adsorption procedure by retaining the adsorption locator module. Therefore, Fig. 12 divulges the highest appropriate adsorption configurations for the 5-arylidene barbituric acid derivatives molecules on the C-steel surface, which is located in nearly parallel or flat disposition, showing an increase in the scope of adsorption and greatest surface coverage.81 Table 10 also lists the results of the Monte Carlo simulation, including the adsorption energy for the relaxed adsorbate molecules, the rigid adsorption energy for unrelaxed adsorbate molecules, and the deformation energy for the relaxed adsorbate molecules.82 Table 10 shows that compound II (−3512.49 kcal mol−1) has a higher adsorption energy than compound I (−3490.57 kcal mol−1), implying that compound II has a strong adsorption on the C-steel surface, creating stationary adsorbed layers that protect the C-steel from corrosion, which concurs with the empirical results. Furthermore, the findings in Table 10 divulge that the adsorption energies of compound II (unrelaxed and relaxed) are higher than those of compound I before and after the geometry optimization process, indicating that compound II has a higher inhibitory efficiency than compound I. When one of the adsorbate is abolished, the dEads/dNi values explain the energy of the metal-adsorbate configuration.83 The dEads/dNi value for compound II (−224.14 kcal mol−1) is higher than that of compound I molecules (204.29 kcal mol−1), indicating that compound II molecules have better adsorption than compound I molecules. Furthermore, the dEads/dNi values for water are close to −14.26 kcal mol−1, which is low compared with the values for 5-arylidene barbituric acid derivatives, indicating that 5-arylidene barbituric acid derivatives molecules have a more durable adsorption than water molecules, indicating that water molecules can be replaced by 5-arylidene barbituric acid derivatives molecules. As a result, the 5-arylidene barbituric acid derivative molecules are forcefully adsorbed on the C-steel surface and form a robust adsorbed defensive layer, resulting in a corrosion shield for the C-steel surface in destructive conditions, as demonstrated by both empirical and theoretical research.
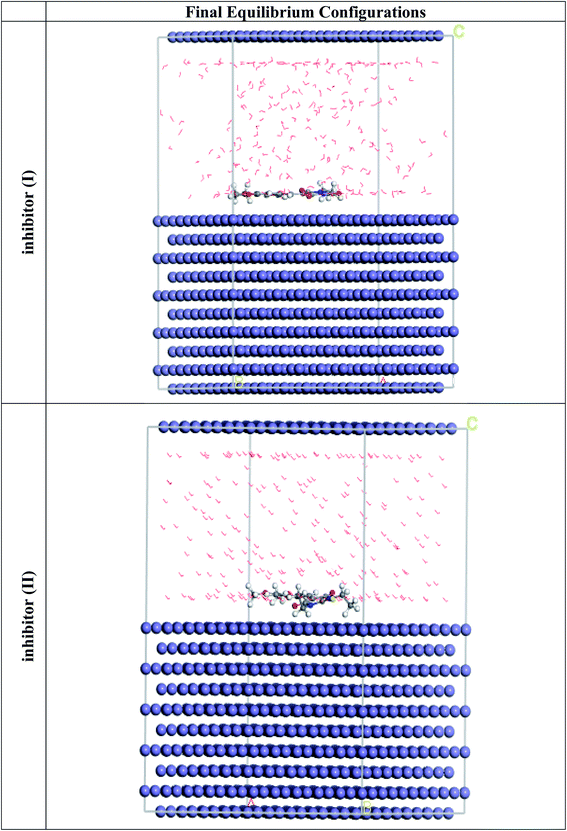 |
| | Fig. 12 The most suitable adsorption configuration for the barbituric acid derivatives on the Fe (110) substrate obtained from the adsorption locator module. | |
Table 10 Data and descriptors calculated by the Monte Carlo simulation (MC) for the adsorption of the barbituric acid derivatives on iron (110)
| Structures |
Adsorption energy/kcal mol−1 |
Rigid adsorption energy/kcal mol−1 |
Deformation energy/kcal mol−1 |
dEads/dNi: inhibitor kcal mol−1 |
dEads/dNi: water kcal mol−1 |
| Fe (110) |
−3490.57 |
−3664.63 |
174.06 |
−204.29 |
−14.39 |
| Inhibitor I |
| Water |
| Fe (110) |
−3512.49 |
−3688.35 |
175.86 |
−224.14 |
−14.18 |
| Inhibitor II |
| Water |
3.9 Surface examination (SEM & EDX analysis)
Fig. 13a–d describes the C-steel samples in 1 M HCl in the absence and presence of 21 × 10−6 M compound I and II. The SEM image of the pristine C-steel (Fig. 13a) exhibits a moderately smooth surface. On the other hand, after the exposure of C-steel to 1 M HCl for 24 h, the C-steel interfaces were severely scratched and destroyed (Fig. 13a). However, after adding an optimum dose of compound I and II, the surface turns smoother and free slightly from the corrosion product; this shows the protective action of the inhibitors through restraining the active centers of the C-steel surface. Fig. 13e–h implies the EDX analysis and the atomic content percentage of uninhibited and inhibited samples, respectively. The strong Fe signal (Fig. 13e) indicated a Fe-rich pristine C-steel surface. However, untreated C-steel surface exposed to 1 M HCl as a corrosive medium exhibited O, Cl, and Fe signals (Fig. 13f). This might be related to strong corrosion and/or formation of iron chloride and/or iron oxide layers on the CS surface (Fig. 13f). As revealed in Fig. 13d and g, the EDX spectrums of compound I and compound II display additional signals owing to the occurrence of N and S. The occurrence of N and S elements in the EDX patterns of the inhibited surface shows that the inhibitor molecule is adsorbed on the C-steel interface and inhibits its corrosion (Table 11).
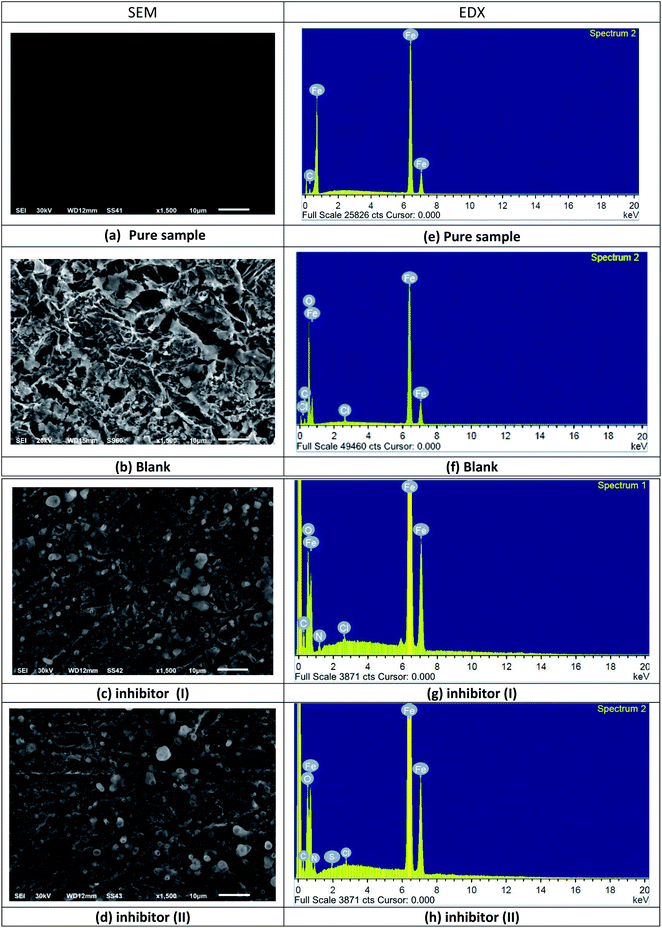 |
| | Fig. 13 SEM images and EDX spectra of the C-steel surface before and after immersion in 1 M HCl in the absence and presence of 21 × 10−6 M compound I and II for 24 h at 25 °C (SEM images: (a) is pure sample, (b) is blank, (c) is inhibitor I, (d) is inhibitor II) and in (EDX images: (e) is pure sample, (f) is blank, (g) is inhibitor I, (h) is inhibitor II). | |
Table 11 Atomic content percentage of the C-steel surface before and after immersion in 1 M HCl in the absence and presence of 21 × 10−6 M compound I and II for 24 h at 25 °C
| Atomic content percentage |
Fe |
C |
Cl |
O |
S |
N |
| Free |
92.16 |
7.84 |
— |
— |
— |
— |
| Blank |
63.05 |
11.69 |
2.35 |
22.91 |
— |
— |
| Inhibitor I |
71.5 |
10.59 |
1.86 |
15.57 |
— |
0.48 |
| Inhibitor II |
72.03 |
11.35 |
1.53 |
14.31 |
0.25 |
0.53 |
3.10 Mechanism of adsorption and inhibition
The adsorption of inhibitor on the steel surface can be used to suggest an inhibitory mechanism. In general, a single adsorption mode between the inhibitor and the metal surface is impractical due to the complicated nature of adsorption and inhibition of a specific inhibitor. Based on the chemical structures of 5-ABAs, they may adsorb on the active site of a C-steel surface in the current system. As a result, the inhibitory phenomenon may be affected by the following adsorption:
(i) Because of the neutral O atoms in 5-ABAs, they may be protonated in an acid solution as: (5-ABAs) + xH+ → [5-ABAsH]x+
As a result, 5-ABAs exists as [5-ABAsH]x+ in acidic solutions because Cl− may adsorb on the metal surfaces,39 they provide an excess negative charge in the solution, favoring cation adsorption”. The negatively charged metal surface may absorb [5-ABAsHx]x+. In other words, there might be a synergistic relationship between the adsorbed Cl− and protonated inhibitor.40
(ii) In addition to physical adsorption, 5-ABAs can be adsorbed on metal surfaces using the chemisorption mechanism, which involves the formation of coordinate bonds between the lone electron pairs of the O and S atoms and the empty orbital of Fe atoms, strengthening the combination in tension between the inhibitor molecule and the electrode surface.
(iii) It is widely believed that the heterocyclic ring is the primary adsorption center of heterocyclic compounds. Because of the heterocyclic ring, 5-ABAs contain a lot of p-electrons, and they may be adsorbed on the metal surface with the donor–acceptor interactions between the p-electrons of the heterocyclic ring and the unoccupied d-orbitals of Fe.
(iv) Derivative II is more efficient than derivative I due to: (a) derivative II has higher molecular size than derivative I as it may cover a larger area from the C-steel surface. (b) Derivative II has S atom instead of O atom in their structures and S atom is more basic than O atom, i.e., it may donate more electron pairs than O atoms and (c) derivative II has ethyl group instead of methyl group in derivative I.
4 Conclusions
(1) 5-Arylidene barbituric acid derivatives establish a very good inhibition for C-steel in HCl solution.
(2) 5-Arylidene barbituric acid derivatives inhibit the C-steel corrosion by adsorption on its surface and make the layer film.
(3) The inhibition efficiency of these derivatives increases by increasing their doses.
(4) The adsorption of these derivatives on C-steel in HCl solution applied by Langmuir isotherm.
(5) The values of Cdl decline and Rct rise compared to the blank solution when the inhibitors are added, confirming the adsorption of inhibitor molecules on the surface of C-steel.
(6) The polarization data indicated that these derivatives behave as mixed type inhibitors.
(7) DFT calculation and MC simulations were achieved to demonstrate the adsorption sites found in the inhibitor's molecules.
(8) Surface analysis was confirmed using the SEM and EDX techniques.
(9) There is a good agreement between the experimental and theoretical studies.
Conflicts of interest
The authors declare that there is no conflict of interest between them and any body else.
References
- H.-B. Fan, C.-Y. Fu, H.-L. Wang, X.-P. Guo and J.-S. Zheng, Br. Corros. J., 2002, 37, 122–125 CrossRef CAS
 .
. - Y. K. Agrawal, J. D. Talati, M. D. Shah, M. N. Desai and N. K. Shah, Corros. Sci., 2004, 46, 633–641 CrossRef CAS
 .
. - G. Trabanelli, Corrosion, 1991, 47, 410–419 CrossRef CAS
 .
. - D. D. N. Singh and A. K. Dey, Corrosion, 1993, 49, 594–600 CrossRef CAS
 .
. - G. Banerjee and S. N. Malhotra, Corrosion, 1992, 48, 10–15 CrossRef CAS
 .
. - S. T. Arab and E. A. Noor, Corrosion, 1993, 49, 122–129 CrossRef CAS
 .
. - F. Zucchi, G. Trabanelli and G. Brunoro, Corros. Sci., 1992, 33, 1135–1139 CrossRef CAS
 .
. - R. F. V Villamil, P. Corio, S. M. L. Agostinho and J. C. Rubim, J. Electroanal. Chem., 1999, 472, 112–119 CrossRef
 .
. - T. Zhao and G. Mu, Corros. Sci., 1999, 41, 1937–1944 CrossRef CAS
 .
. - S. S. Abd El Rehim, H. H. Hassan and M. A. Amin, Mater. Chem. Phys., 2001, 70, 64–72 CrossRef CAS
 .
. - I. A. Raspini, Corrosion, 1993, 49, 821–828 CrossRef CAS
 .
. - N. Hajjaji, I. Rico, A. Srhiri, A. Lattes, M. Soufiaoui and A. Ben Bachir, Corrosion, 1993, 49, 326–334 CrossRef CAS
 .
. - H. S. Awad and S. A. Gawad, Anti-Corrosion Methods Mater, 2005, 52, 328–336 CrossRef CAS
 .
. - S. S. Mahmoud and M. M. Ahmed, Port. Electrochim. Acta, 2006, 24, 37–52 CrossRef CAS
 .
. - G. Y. Elewady, Int. J. Electrochem. Sci., 2008, 3, 1149 CAS
 .
. - A. Espinoza-Vazquez, G. Negrón-Silva, D. Angeles-Beltrán, M. E. Palomar-Pardavé, M. A. Romero-Romo and H. Herrera-Hernández, ECS Trans., 2011, 36, 217 CrossRef CAS
 .
. - H. Jafari and K. Sayin, Trans. Indian Inst. Met., 2016, 69, 805–815 CrossRef CAS
 .
. - A. Samide, J. Environ. Sci. Health, Part A: Toxic/Hazard. Subst. Environ. Eng., 2013, 48, 159–165 CrossRef CAS PubMed
 .
. - H. Ashassi-Sorkhabi, B. Shaabani and D. Seifzadeh, Electrochim. Acta, 2005, 50, 3446–3452 CrossRef CAS
 .
. - M. Elachouri, M. S. Hajji, S. Kertit, E. M. Essassi, M. Salem and R. Coudert, Corros. Sci., 1995, 37, 381–389 CrossRef CAS
 .
. - K. R. Ansari, A. Singh and M. A. Quraishi, J. Dispersion Sci. Technol., 2015, 36, 908–917 CrossRef CAS
 .
. - N. Soltani, M. Behpour, E. E. Oguzie, M. Mahluji and M. A. Ghasemzadeh, RSC Adv., 2015, 5, 11145–11162 RSC
 .
. - N. Caliskan and E. Akbas, Mater. Corros., 2012, 63, 231–237 CrossRef CAS
 .
. - S. Mohajernia, S. Hejazi, M. H. Moayed, M. Rahimizadeh, A. Eslami, M. Momeni and A. Shiri, J. Iran. Chem. Soc., 2013, 10, 831–839 CrossRef CAS
 .
. - K. Aswin, S. S. Mansoor, K. Logaiya and S. P. N. Sudhan, J. King Saud Univ., Sci., 2014, 26, 141–148 CrossRef
 .
. - M. Behpour, S. M. Ghoreishi, F. Vatani, N. Mohammadi and M. A. Ghasemzadeh, Mech. Eng. Tech., 2014, 2, 1–11 Search PubMed
 .
. - M. A. Khaled, M. A. Ismail, A. A. El-Hossiany and A. E.-A. S. Fouda, RSC Adv., 2021, 11, 25314–25333 RSC
 .
. - S. Lahmidi, A. Elyoussfi, A. Dafali, H. Elmsellem, N. K. Sebbar, L. El Ouasif, A. E. Jilalat, B. El Mahi, E. M. Essassi and I. Abdel-Rahman, J. Mater. Environ. Sci., 2017, 8, 225–237 CAS
 .
. - S. Lahmidi, A. Elyoussfi, A. Dafali, H. Elmsellem, N. K. Sebbar, L. El Ouasif, A. E. Jilalat, B. El Mahi, E. M. Essassi and I. Abdel-Rahman, J. Mater. Environ. Sci., 2017, 8, 225–237 CAS
 .
. - Z. D. Stanković and M. Vuković, Electrochim. Acta, 1996, 41, 2529–2535 CrossRef
 .
. - A. E. Stoyanova, E. I. Sokolova and S. N. Raicheva, Corros. Sci., 1997, 39, 1595–1604 CrossRef CAS
 .
. - I. Lukovits, I. Bakó, A. Shaban and E. Kálmán, Electrochim. Acta, 1998, 43, 131–136 CrossRef CAS
 .
. - E. E. Ebenso, U. J. Ekpe, B. I. Ita, O. E. Offiong and U. J. Ibok, Mater. Chem. Phys., 1999, 60, 79–90 CrossRef CAS
 .
. - G. Kardas, Mater. Sci., 2005, 41, 337–343 CrossRef CAS
 .
. - D. J. Brown, The Pyrimidines, John Wiley & Sons, 2009, supplement 2 Search PubMed
 .
. - C. Macilwain, Nature, 1993, 365, 378 CrossRef CAS PubMed
 .
. - M. A. Khaled, M. A. Ismail, A. A. El-Hossiany and A. E.-A. S. Fouda, RSC Adv., 2021, 11, 25314–25333 RSC
 .
. - M. A. Ismail, S. Al-Shihry, R. K. Arafa and U. El-Ayaan, J. Enzyme Inhib. Med. Chem., 2013, 28, 530–538 CrossRef CAS PubMed
 .
. - S. Shettigar, G. Umesh, P. Poornesh, K. B. Manjunatha and A. M. Asiri, Dyes Pigm., 2009, 83, 207–210 CrossRef CAS
 .
. - A. S. Fouda, A. El-Mekabaty, I. E. I. Shaaban and A. El-Hossiany, Prot. Met. Phys. Chem. Surf., 2021, 57, 1060–1075 CrossRef CAS
 .
. - G. N. Mu, T. P Zhao, M. Liu and T. Gu, Corrosion, 1996, 52, 853–856 CrossRef CAS
 .
. - R. G. Parr, R. A. Donnelly, M. Levy and W. E. Palke, J. Chem. Phys., 1978, 68, 3801–3807 CrossRef CAS
 .
. - A. S. Fouda, S. A. Abd El-Maksoud, A. El-Hossiany and A. Ibrahim, Int. J. Electrochem. Sci., 2019, 14, 2187–2207 CrossRef CAS
 .
. - A. M. Eid, S. Shaaban and K. Shalabi, J. Mol. Liq., 2020, 298, 111980 CrossRef CAS
 .
. - A. Singh, K. R. Ansari, J. Haque, P. Dohare, H. Lgaz, R. Salghi and M. A. Quraishi, J. Taiwan Inst. Chem. Eng., 2018, 82, 233–251 CrossRef CAS
 .
. - H. M. Abd El-Lateef, Z. A. Abdallah and M. S. M. Ahmed, J. Mol. Liq., 2019, 296, 111800 CrossRef
 .
. - S. Kaya, L. Guo, C. Kaya, B. Tüzün, I. B. Obot, R. Touir and N. Islam, J. Taiwan Inst. Chem. Eng., 2016, 65, 522–529 CrossRef CAS
 .
. - G. Gao and C. Liang, Electrochim. Acta, 2007, 52, 4554–4559 CrossRef CAS
 .
. - H. M. Abd El-Lateef, K. Shalabi and A. H. Tantawy, New J. Chem., 2020, 44, 17791–17814 RSC
 .
. - K. Aramaki, M. Hagiwara and H. Nishihara, Corros. Sci., 1987, 27, 487–497 CrossRef CAS
 .
. - A. S. Fouda, E. Abdel-Latif, H. M. Helal and A. El-Hossiany, Russ. J. Electrochem., 2021, 57, 159–171 CrossRef CAS
 .
. - B. Zerga, A. Attayibat, M. Sfaira, M. Taleb, B. Hammouti, M. E. Touhami, S. Radi and Z. Rais, J. Appl. Electrochem., 2010, 40, 1575–1582 CrossRef CAS
 .
. - J. Aljourani, K. Raeissi and M. A. Golozar, Corros. Sci., 2009, 51, 1836–1843 CrossRef CAS
 .
. - A. S. Fouda, R. E. Ahmed and A. El-Hossiany, Prot. Met. Phys. Chem. Surf., 2021, 57, 398–411 CrossRef CAS
 .
. - M. A. Migahed, E. M. S. Azzam and S. M. I. Morsy, Corros. Sci., 2009, 51, 1636–1644 CrossRef CAS
 .
. - M. N. H. Moussa, A. A. El-Far and A. A. El-Shafei, Mater. Chem. Phys., 2007, 105, 105–113 CrossRef CAS
 .
. - A. S. Fouda, H. Ibrahim, S. Rashwaan, A. El-Hossiany and R. M. Ahmed, Int. J. Electrochem. Sci., 2018, 13, 6327–6346 CrossRef CAS
 .
. - E. Bayol, K. Kayakırılmaz and M. Erbil, Mater. Chem. Phys., 2007, 104, 74–82 CrossRef CAS
 .
. - O. Benali, L. Larabi, M. Traisnel, L. Gengembre and Y. Harek, Appl. Surf. Sci., 2007, 253, 6130–6139 CrossRef CAS
 .
. - I. Epelboin, M. Keddam and H. Takenouti, J. Appl. Electrochem., 1972, 2, 71–79 CrossRef CAS
 .
. - B. B. Damaskin, O. A. Petrii, V. V. Batrakov, E. B. Uvarov and R. Parsons, Adsorption of organic compounds on electrodes, Springer, 1971 Search PubMed
 .
. - A. S. Fouda, M. Eissa and A. El-Hossiany, Int. J. Electrochem. Sci., 2018, 13, 11096–11112 CrossRef CAS
 .
. - S. Da Costa and S. M. L. Agostinho, Corrosion, 1989, 45, 472–477 CrossRef CAS
 .
. - A. Fouda, S. E. Badr, A. M. Ahmed and A. El-Hossiany, Int. J. Corros. Scale Inhib., 2021, 10, 1011–1029 CAS
 .
. - A. S. Fouda, M. A. Abd El-Ghaffar, M. H. Sherif, A. T. El-Habab and A. El-Hossiany, Prot. Met. Phys. Chem. Surf., 2020, 56, 189–201 CrossRef CAS
 .
. - R. W. Bosch, J. Hubrecht, W. F. Bogaerts and B. C. Syrett, Corrosion, 2001, 57, 60–70 CrossRef CAS
 .
. - A. S. Fouda, K. Shalabi and A. E-Hossiany, J. Bio-and Tribo-Corrosion, 2016, 2, 1–13 CrossRef
 .
. - K. F. Khaled and N. Hackerman, Electrochim. Acta, 2003, 48, 2715–2723 CrossRef CAS
 .
. - Y. Feng, S. Chen, W. Guo, Y. Zhang and G. Liu, J. Electroanal. Chem., 2007, 602, 115–122 CrossRef CAS
 .
. - Y. M. Abdallah, K. Shalabi and N. M. Bayoumy, J. Mol. Struct., 2018, 1171, 658–671 CrossRef CAS
 .
. - G. Gece and S. Bilgiç, Corros. Sci., 2009, 51, 1876–1878 CrossRef CAS
 .
. - N. Palaniappan, I. S. Cole and A. E. Kuznetsov, Rsc Adv, 2020, 10, 11426–11434 RSC
 .
. - I. B. Obot, D. D. Macdonald and Z. M. Gasem, Corros. Sci., 2015, 99, 1–30 CrossRef CAS
 .
. - D. Romani and S. A. Brandan, Biointerface Res. Appl. Chem., 2020, 10, 4876–4892 CAS
 .
. - I. Lukovits, E. Kalman and F. Zucchi, Corrosion, 2001, 57, 3–8 CrossRef CAS
 .
. - I. B. Obot, S. Kaya, C. Kaya and B. Tüzün, Phys. E Low-dimensional Syst. Nanostructures, 2016, 80, 82–90 CrossRef CAS
 .
. - K. Shalabi and A. A. Nazeer, J. Mol. Struct., 2019, 1195, 863–876 CrossRef CAS
 .
. - K. Shalabi, O. A. El-Gammal and Y. M. Abdallah, Colloids Surf., A, 2021, 609, 125653 CrossRef CAS
 .
. - Y. S. Mary, C. Y. Panicker, M. Sapnakumari, B. Narayana, B. K. Sarojini, A. A. Al-Saadi, C. Van Alsenoy and J. A. War, Spectrochim. Acta, Part A, 2015, 136, 483–493 CrossRef CAS PubMed
 .
. - S. Ramalingam, P. D. S. Babu, S. Periandy and E. Fereyduni, Spectrochim. Acta, Part A, 2011, 84, 210–220 CrossRef CAS PubMed
 .
. - L. H. Madkour, S. Kaya and I. B. Obot, J. Mol. Liq., 2018, 260, 351–374 CrossRef CAS
 .
. - K. Shalabi, A. M. Helmy, A. H. El-Askalany and M. M. Shahba, J. Mol. Liq., 2019, 293, 111480 CrossRef CAS
 .
. - M. Özcan, İ. Dehri and M. Erbil, Appl. Surf. Sci., 2004, 236, 155–164 CrossRef
 .
.
|
| This journal is © The Royal Society of Chemistry 2022 |
Click here to see how this site uses Cookies. View our privacy policy here.  Open Access Article
 *
*
![[double bond, length as m-dash]](https://www.rsc.org/images/entities/char_e001.gif) C stretch). 1H-NMR (CDCl3); δ 3.39, 3.40 (2 s, 6H; 2× N–CH3), 3.97, 3.98 (2s, 6H; 2× OCH3), 6.94 (d, J = 8.7 Hz, 1H), 7.78 (dd, J = 8.7 Hz, 2.1 Hz, 1H), 8.38 (d, J = 2.1 Hz, 1H), 8.48 (s, 1H, methine H). Inhibitor II (3b) was prepared by the treatment of 1,3-diethylthiobarbituric acid (1b, 5 mmol) with 3,4-dimethoxybenzaldehyde (2, 5 mmol) in 30 mL methanol at reflux in the presence of triethylamine as the catalyst to afford inhibitor II (3b) in 84% yield, mp 186–187 °C (DMF/EtOH), lit39 mp 185–187 °C; IR (KBr) ν′/cm−1: 3115 (sp2 C–H stretch), 2976, 2928, (sp3 C–H stretch), 1689 (CO stretch), 1660, 1541, 1502 (C
C stretch). 1H-NMR (CDCl3); δ 3.39, 3.40 (2 s, 6H; 2× N–CH3), 3.97, 3.98 (2s, 6H; 2× OCH3), 6.94 (d, J = 8.7 Hz, 1H), 7.78 (dd, J = 8.7 Hz, 2.1 Hz, 1H), 8.38 (d, J = 2.1 Hz, 1H), 8.48 (s, 1H, methine H). Inhibitor II (3b) was prepared by the treatment of 1,3-diethylthiobarbituric acid (1b, 5 mmol) with 3,4-dimethoxybenzaldehyde (2, 5 mmol) in 30 mL methanol at reflux in the presence of triethylamine as the catalyst to afford inhibitor II (3b) in 84% yield, mp 186–187 °C (DMF/EtOH), lit39 mp 185–187 °C; IR (KBr) ν′/cm−1: 3115 (sp2 C–H stretch), 2976, 2928, (sp3 C–H stretch), 1689 (CO stretch), 1660, 1541, 1502 (C![[double bond, length as m-dash]](https://www.rsc.org/images/entities/char_e001.gif) C stretch), 1381 (C
C stretch), 1381 (C![[double bond, length as m-dash]](https://www.rsc.org/images/entities/char_e001.gif) S stretch) cm−1. 1H-NMR (DMSO-d6); δ 1.15–1.21 (m, 6H; 2× CH3 of ethyl group), 3.81 (s, 3H; OCH3), 3.89 (s, 3H; OCH3), 4.39–4.44 (m, 4H; 2× CH2 of ethyl group), 7.13 (d, J = 8.5 Hz, 1H), 7.99 (dd, J = 8.5 Hz, 2.0 Hz, 1H), 8.23 (d, J = 2.0 Hz, 1H), 8.36 (s, 1H, methine proton). MS (EI) m/z (rel. int.); 348 (M+, 100).
S stretch) cm−1. 1H-NMR (DMSO-d6); δ 1.15–1.21 (m, 6H; 2× CH3 of ethyl group), 3.81 (s, 3H; OCH3), 3.89 (s, 3H; OCH3), 4.39–4.44 (m, 4H; 2× CH2 of ethyl group), 7.13 (d, J = 8.5 Hz, 1H), 7.99 (dd, J = 8.5 Hz, 2.0 Hz, 1H), 8.23 (d, J = 2.0 Hz, 1H), 8.36 (s, 1H, methine proton). MS (EI) m/z (rel. int.); 348 (M+, 100).

![[thin space (1/6-em)]](https://www.rsc.org/images/entities/char_2009.gif) icorr and the resulting Ecorr for inhibitor-free acid and to any concentration of the inhibitor. Thereafter, icorr can be applied to examine of θ and IE% as:
icorr and the resulting Ecorr for inhibitor-free acid and to any concentration of the inhibitor. Thereafter, icorr can be applied to examine of θ and IE% as:

 and Rct are the resistance of charge transfer in the absence and existence of the inhibitor, respectively.


 can be examined by applying Arrhenius equation:
 for the uninhibited solution is lower than that of the inhibited solution, supposing that the dissolution of C-steel is slow within existence of inhibitor.61 This is recognized from eqn (10) to be the higher values of
  , which cause a lower corrosion rate owing to the construction of the protecting film on the C-steel surface acting as an energy barrier of the C-steel corrosion.62–64 Entropy and enthalpy of activation (ΔS*, ΔH*) of the corrosion procedure were determined from the transition state theory.
![[thin space (1/6-em)]](https://www.rsc.org/images/entities/char_2009.gif) k/T versus 1/T of C-steel with 1 M hydrochloric acid solution at diverse doses from the examined compounds, provides straight lines as displayed in Fig. 7 for the inhibitors. The thermodynamic parameters are listed in Table 7 shows that the ΔH* values are positive, which signals that the steel dissolution process is endothermic process”. High and negative values of ΔS* show that the activated complex is found in an associated form more than the dissociated form.
k/T versus 1/T of C-steel with 1 M hydrochloric acid solution at diverse doses from the examined compounds, provides straight lines as displayed in Fig. 7 for the inhibitors. The thermodynamic parameters are listed in Table 7 shows that the ΔH* values are positive, which signals that the steel dissolution process is endothermic process”. High and negative values of ΔS* show that the activated complex is found in an associated form more than the dissociated form.

![[thin space (1/6-em)]](https://www.rsc.org/images/entities/char_2009.gif) k − 1/T curves for C-steel dissolution in 1.0 M HCl in the absence and existence of altered doses of inhibitor (I and II).
k − 1/T curves for C-steel dissolution in 1.0 M HCl in the absence and existence of altered doses of inhibitor (I and II).
![[thin space (1/6-em)]](https://www.rsc.org/images/entities/char_2009.gif) k/T–1/T curves for C-steel dissolution in 1 M HCl and the presence of altered doses the investigated inhibitors (I & II).
k/T–1/T curves for C-steel dissolution in 1 M HCl and the presence of altered doses the investigated inhibitors (I & II).

 for 5-arylidene barbituric acid derivatives are listed in Table 8. The increase in the negative value of
  indicates that these compounds were strongly adsorbed on the C-steel surface in a stable state and that the adsorption process was spontaneous. Furthermore, the values of
  are −32.5 and −33.0 kJ mol−1, which indicates that the adsorption of 5-arylidene barbituric acid derivatives on C-steel is mixed-type, i.e., physisorption and chemisorption, but mainly physisorption because the
  values increase in the presence of inhibitors than in its absence and %inhibition decreases by increasing the temperature. In addition, the Kads values were established to run analogous to the IE% (KII > KI). This result replicates the ability to grow on the metal surfaces due to structural development.69


.
.
.
.
.
.
.
.
.
.
.
.
.
.
.
.
.
.
.
.
.
.
.
.
.
.
.
.
.
.
.
.
.
.
.
.
.
.
.
.
.
.
.
.
.
.
.
.
.
.
.
.
.
.
.
.
.
.
.
.
.
.
.
.
.
.
.
.
.
.
.
.
.
.
.
.
.
.
.
.
.
.
.


