
 Open Access Article
 This Open Access Article is licensed under a
 Creative Commons Attribution 3.0 Unported Licence
In situ fluorescence yield soft X-ray absorption spectroscopy of electrochemical nickel deposition processes with and without ethylene glycol†
Akinobu Yamaguchi *ab,
Naoya Akamatsuab,
Shunya Saegusaab,
Ryo Nakamuraab,
Yuichi Utsumia,
Masaru Kato*bc,
Ichizo Yagibc,
Tomoko Ishihara‡
b and
Masaki Ourab
*ab,
Naoya Akamatsuab,
Shunya Saegusaab,
Ryo Nakamuraab,
Yuichi Utsumia,
Masaru Kato*bc,
Ichizo Yagibc,
Tomoko Ishihara‡
b and
Masaki Ourab
aLaboratory of Advanced Science and Technology for Industry, University of Hyogo, 3-1-2 Kouto, Kamigori, Hyogo 678-1205, Japan. E-mail: yamaguti@lasti.u-hyogo.ac.jp
bRIKEN SPring-8 Center, 1-1-1, Kouto, Sayo, Hyogo 679-5148, Japan
cFaculty of Environmental Earth Science, Graduate School of Environmental Science, Hokkaido University, N10W5, Kita-ku, Sapporo, Hokkaido 060-0810, Japan. E-mail: masaru.kato@ees.hokudai.ac.jp
First published on 5th April 2022
Abstract
The electrochemical Ni deposition at a platinum electrode was investigated in a plating nickel bath in the presence and absence of ethylene glycol (EG) using fluorescence yield soft X-ray absorption spectroscopy (FY-XAS) in the Ni L2,3-edge and O K-edge regions under potential control. At ≤+0.35 V vs. the reversible hydrogen electrode (RHE), the electrochemical Ni deposition was detected by the Ni L2,3-edge FY-XAS in the presence of EG whereas almost no such event was observed in the absence of EG. A drastic decrease of FY-XAS intensities in the O K-edge region was also observed in the presence of EG at >+0.35 V vs. RHE, suggesting that the nano-/micro-structured Ni deposition initiated by the removal of water molecules occurs on the Pt electrode. The complex formation of Ni2+ with EG and the adsorption of EG on the Ni surface could play an important role in the Ni deposition. This study demonstrates that the in situ FY-XAS is a powerful and surface-sensitive technique to understand (electro)chemical reactions including polyol synthesis and electrocatalysis at solid–liquid interfaces.
Introduction
Electrochemical reactions including electroplating, electrodeposition, and electrocatalysis proceed at electrode–solution interfaces ranging up to several micrometers, where electric double layers are formed and modulate the interfacial reaction dynamics. Such interfacial reactions can also occur at solid–liquid interfaces in various research fields such as fuel cells, catalysis, and crystal growth and have been investigated using surface-sensitive techniques. For electrochemical reactions, many surface-sensitive techniques including an electrochemical quartz crystal microbalance (EQCM),1,2 surface-enhanced Raman scattering (SERS),3,4 surface-enhanced infrared absorption spectroscopy (SEIRAS),5–8 and surface X-ray scattering (SXS)9 have been used. For example, EQCM provides information on the amount of metal nanoparticles during electrochemical metal deposition but not on the electronic state of the metal deposited. Vibrational techniques of SERS and SEIRAS allow us to track bond formation and cleavage of metal oxides and organic molecules but not metal deposition.In situ X-ray absorption spectroscopy (XAS) using soft X-rays is an emerging surface-sensitive technique particularly to understanding the electronic state of target elements including not only metals but light elements such as C, N, and O during electrochemical reactions at the solid–liquid interface. In situ XAS using soft X-rays enables us to track metal deposition and dissolution processes at the electrode interface and understand the electronic states of either metal or oxygen species on the electrode under potential control, where carefully designed spectro-electrochemical flow cells should be used depending on the XAS data acquisition method.10–16
Ni-based electrocatalysts have been used for sustainable energy production and storage including hydrogen evolution/oxidation and oxygen reduction/evolution reactions.6,17–23 Nickel can also be used to enhance the catalytic activity of noble metals including Pt by alloying6,19,21,24 or surface deposition,25–27 where the morphology, electronic structure, and/or interfacial charges of Pt modulated by Ni enable the catalytic activity enhancement. The electrochemical deposition of Ni on Pt would provide an excellent platform to understand the role of the Ni/Pt interface for electrocatalytic enhancements observed for Pt–Ni alloy electrocatalysts and the formation process of the Ni/Pt interface because the nucleation and growth process of Ni on metal substrates can be precisely controlled by potentials.25 In situ XAS spectroscopy using soft X-rays would be suitable for tracking electrochemical events for the electrochemical deposition of Ni on Pt to form the Ni/Pt interface involving the change of chemical states on Ni and oxygen that can be found in solvents such as water.
In this work, we tracked the electrochemical deposition of Ni on a Pt electrode in plating solutions containing nickel sulfamate in the presence and absence of an organic additive of ethylene glycol (EG) by in situ photon-in/photon-out fluorescence yield XAS (FY-XAS) under electrochemical conditions. Nickel sulfamate solutions have been widely used for Ni electroplating because of low stress in the Ni deposit, high current densities suitable for the increase in production potential, and high ductility of the Ni deposit.28,29 Tracking the electrochemical Ni deposition process on the Pt electrode by in situ FY-XAS in the O K-edge and Ni L2,3-edge regions allows us to understand the formation mechanism of the Ni/Pt interface for Pt–Ni alloy electrocatalysts as well as the effect of EG in Ni electroplating on the crystallographic texture, grain size, mechanical properties and corrosion resistance of electrodeposited Ni.25,29–32
Experimental methods
Materials
Nickel sulfamate Ni(SO3NH2)2 (>98%), sodium sulfamate NaSO3NH2 (>98%) and ethylene glycol (EG, >99.5%) were purchased from FUJIFILM Wako Pure Chemical Corporation and then used without further purification.FY-XAS measurements using a spectro-electrochemical flow cell
FY-XAS experiments were performed at BL17SU beamline in SPring-8.33,34 The photon-in/photon-out FY-XAS spectra were recorded using a 100 mm2 Si photodiode (IRD AXUV-100G, Opto Diode Corp., USA) placed in the vacuum chamber.35 The energy resolution is E/ΔE ∼ 2800 at 540 eV (∼2000 at 850 eV). A custom-made spectro-electrochemical flow cell with the three-electrode configuration was used for FY-XAS measurements (Fig. 1a–c).11 A Pt-coated SiC membrane with a Ti adhesive layer was used as the working electrode. The window on the Pt side faces the electrolyte solution and separates the solution and vacuum (Fig. 1d). Electrochemical reactions occur at the surface of the 15 nm-thick Pt deposited on the 150 nm-thick SiC membrane via the 3 nm-thick Ti adhesive layer (purchased from NTT-AT). A Pt wire electroplated with Pt black was used as the counter electrode. An Ag|AgCl (3 M KCl, Thermo Scientific 66EE009) electrode was used as the reference electrode.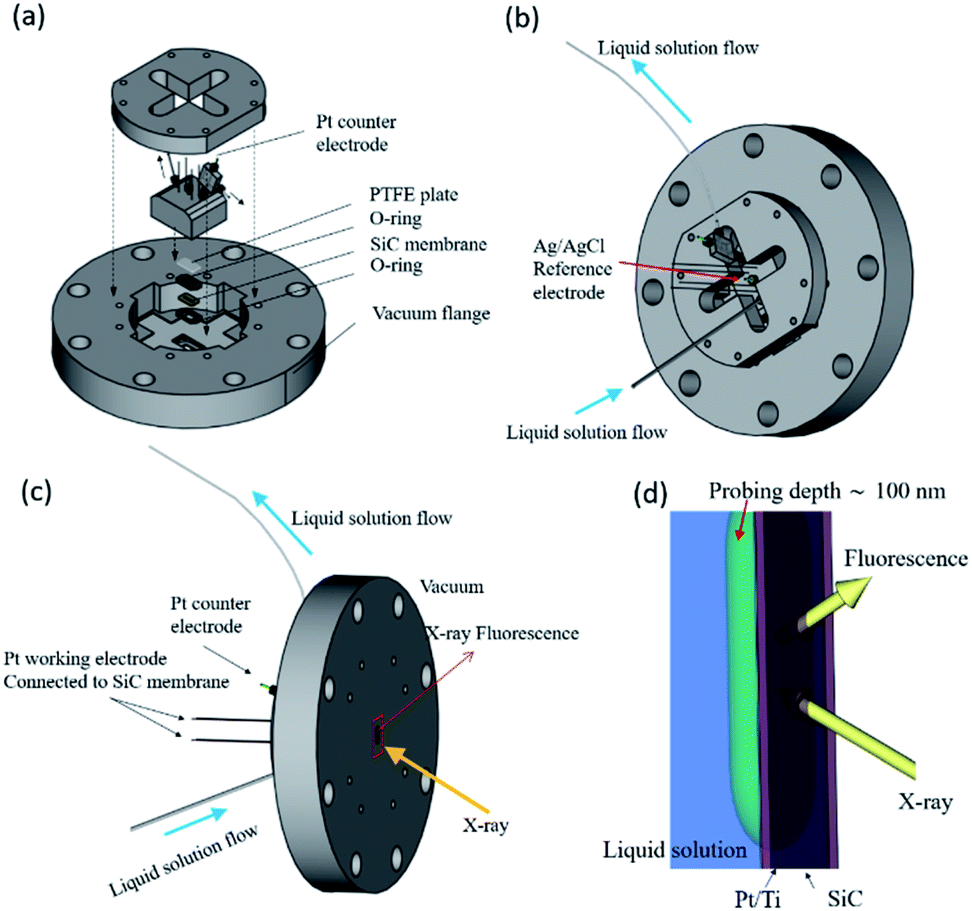 | ||
| Fig. 1 (a) Schematic representation of the spectro-electrochemical flow cell for photon-in/photon-out soft X-ray spectroscopy.11 The cell consists of a working electrode (a Pt thin film deposited on a SiC window), a Pt counter electrode, and a Ag|AgCl reference electrode in a 3 M KCl aqueous solution. Views of the cell are shown from (b) the atmospheric side and (c) the vacuum side. (d) Enlarged schematic representation of the interface between the solution and the Pt/SiC window, which can be found in the rectangle in red shown in (c). | ||
In our experimental setup, soft X-rays come from the vacuum side and reach the Pt–electrolyte (solid–electrolyte) interface with penetration depths, allowing us to track electrochemical events at the electrode interface even under potential control. X-ray penetration depths in our experimental setup can be estimated to be approximately 300 nm at 550 eV in the O K-edge region and approximately 100 nm at ∼860 eV in the Ni L2,3-edge region, where the penetration depths are defined as the attenuation length at which the incident X-ray intensity decays to the (1/e)th (Napier's constant) of the initial value, assuming the attenuation of the window materials of the SiC membrane, Ti adhesion layer and Pt layer (see Fig. S1 and S2 in the ESI† for details.) A X-ray probing depth in Fig. 1d can also be estimated in the same way to be approximately 100 nm: the probing depth is defined as the attenuation length at which the signal intensity decays to the (1/e)th of the initial intensity from the outermost surface.
Electrochemical measurements
A potentiostat (ECstat-101, EC-Frontier Co., Ltd., Japan) was used for in situ FY-XAS measurements. A potentiostat (Interface 1000T, Gamry Instruments, USA) was used for cyclic voltammetry measurements. Electrolyte solutions were degassed by N2 bubbling and introduced into the flow cell using an external liquid pump. Cyclic voltammograms (CVs) were recorded at a sweep rate of 0.05 V s−1. The potentials vs. Ag|AgCl (3 M KCl aq.), EAg|AgCl, were converted to the potentials vs. the reversible hydrogen electrode (RHE), ERHE, using the following equation: ERHE = EAg|AgCl + 0.205 + pH × 0.059.35 For recording CVs, electrolyte solutions of Ni(SO3NH2)2 (300 g L−1, 1.2 M) and NaSO3NH2 (142 g L−1, 1.2 M) were used. To investigate the polyol reaction characteristics, 1% v/v (1.6 × 10⁻⁶ M) EG was added to the solutions. The pHs of the Ni(SO3NH2)2 and NaSO3NH2 solutions were determined to be 5.83 and 9.03, respectively.Results and discussion
CVs of the Pt/SiC electrode were recorded in aqueous solutions containing Ni(SO3NH2)2 (Fig. 2a) or NaSO3NH2 (Fig. 2b) in the absence of EG. NaSO3NH2 was used as a redox-inactive counterpart for control experiments to understand the redox behavior of Ni2+ in solution. In the potential range between about +0.1 and +0.30 V vs. RHE, characteristic cathodic and anodic currents were observed in the NaSO3NH2 solution. These currents are associated with absorption and desorption of the underpotential deposition (upd) of hydrogen on platinum.11,36–38 A reduction wave at about +0.7 V vs. RHE was also observed and assigned to the re-reduction of Pt oxide. These results indicate that the surface of Pt was electrochemically active in the NaSO3NH2 solution. Even in the Ni(SO3NH2)2 solution, the characteristic cathodic and anodic currents of Pt were also observed. No obvious redox wave that originates from Ni2+ was observed in the absence of EG. This result is in good agreement with reported results that the Ni upd is known to be overlapped with the hydrogen upd on polycrystalline Pt.39–42 | ||
| Fig. 2 CVs of Pt/SiC electrodes in aqueous solutions containing (a) Ni(SO3NH2)2 and (b) NaSO3NH2 in the presence and absence of EG. | ||
In the presence of EG in the Ni(SO3NH2)2 solution, a reduction wave was observed at about +0.35 V vs. RHE (Fig. 2a), indicating that the Ni upd clearly occurs on the Pt surface in the presence of EG. EG can be coordinated to transition metal cations including Ni2+ in solution.43–45 It is also known that the electrochemical deposition of NiO or Ni(OH)2 is enhanced by the complex formation of Ni2+, where bidentate ligands such as glycine and ethylenediamine are more effective than monodentate ligands of NH3 or OH2.46–48 Since EG is a bidentate ligand, the complex formation of Ni2+ with EG could enhance the electrochemical deposition of NiO or Ni(OH)2 on the Pt/SiC surface. Note that the reduction wave for the re-reduction of Pt oxide was shifted to more positive potentials in the presence of EG (Fig. 2b). This result indicates that EG could also be helpful for not only Ni upd but also the electrochemical reduction of the surface Pt oxide.
To understand the electrochemical events at the liquid–electrode interface, potential-dependent FY-XAS data of the Pt/SiC electrode were collected in the Ni(SO3NH2)2 solution in the absence or presence of EG in the O K-edge (Fig. 3a and b) and Ni L2,3-edge regions (Fig. 3c and d). The applied potentials were stepped in the positive or negative direction. In both cases, the same spectra were obtained, (Fig. S3†), indicating that the spectral changes are reversible and reproduced by potential control.
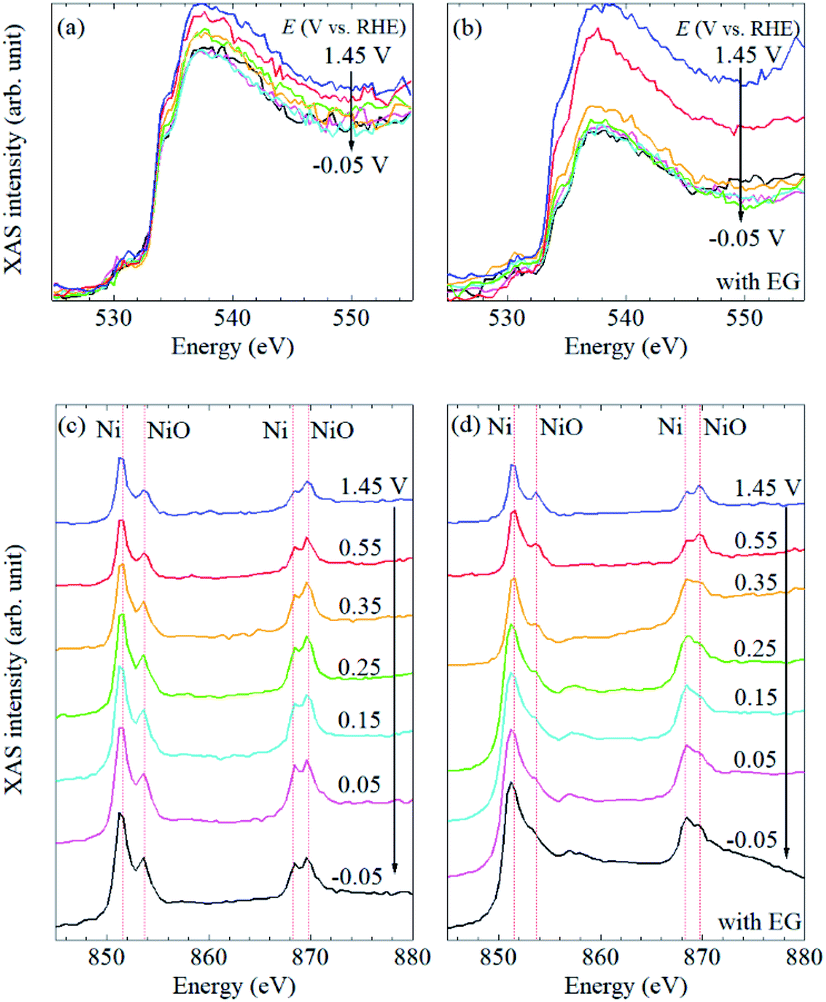 | ||
| Fig. 3 Potential-dependent FY-XAS data of Pt/SiC in the Ni(SO3NH2)2 solution in the O K-edge in the absence (a) and presence (b) of EG and in the Ni L2,3-edge region in the absence (c) and the presence (d) of EG. The arrows indicate the direction of the potential changes. | ||
In the Ni L2,3-edge region, mainly four peaks were observed at about 851 and 853 eV for the Ni 2p3/2 → 3d transition and approximately 869 and 870 eV for the Ni 2p3/2 → 3d transition. For further assignments of these transitions to the exact 3d orbital, careful experiments in the magnetic field and theoretical calculations are needed. The peaks around 851 and 869 eV, which are found at lower energies in each transition, can be associated with metallic Ni35,49 whereas the peaks around 853 and 870 eV, which are found at higher energies in each transition, can be assigned to NiO.16,50,51 Thus, in situ FY-XAS using our spectro-electrochemical flow cell allows us to detect the deposition of Ni and NiO on the Pt electrode.
In the O K-edge region, two peaks were observed in the vicinity of 535 and 537 eV (Fig. 3a and b). There is no clear difference between the spectra in the presence and absence of EG, and the spectral shape is quite similar to that of pure water.11 No obvious peak was observed at 532 eV (Fig. S4†), at which a peak is observed for NiO or β-Ni(OH)2,12 even though the presence of NiO was confirmed by Ni L2,3-edge XAS data, as mentioned above. It seems that signal-to-noise ratios in the O K-edge XAS are not high enough to observe the peak at 532 eV. Thus, the spectral changes in the O K-edge region mainly originate from changes involving H2O molecules at the liquid–electrode interface. Since the spectral changes were completed at +0.35 V vs. RHE even in the presence of EG (Fig. 3b), it seems that the Pt electrode surface was not fully covered with the Ni or NiO deposit and exposed to the electrolyte solution at >+0.35 V vs. RHE.
The potential dependence of the peak intensities in the Ni L2,3-edge region was observed in the presence of EG (Fig. 3d) whereas there is no obvious spectral change in the absence of EG (Fig. 3c). In the presence of EG, peak intensity ratios at 851/853 eV and 869/870 eV increased at more negative potentials (Fig. S5†). Since these peak ratios can be correlated with the Ni/NiO ratio based on our peak assignments, the amount of metallic Ni increased at negative potentials. A broad peak was also observed around 857 eV at ≤0.35 V vs. RHE (Fig. 3d). Although β-Ni(OH)2 is reported to show a peak around 859 eV,16 the broad peak observed at about 857 eV could be assigned to the satellite peak of metallic Ni.36 It is highly likely that the peak was pronounced at ≤0.35 V vs. RHE by the deposition and/or nucleation of metallic Ni nano-/micro-structured particles on the Pt electrode. The increase of this broad peak is coupled with the drastic decrease of O K-edge FY-XAS intensities at >533 eV in the presence of EG (Fig. 3b). Thus, the removal of water molecules from the Pt surface mainly happens at >0.35 V vs. RHE and the Ni deposition starts at the Pt surface at ≤ 0.35 V vs. RHE.
Note that the drastic increase of the baseline intensities was also observed in the Ni L2,3-edge spectra in the presence of EG (Fig. 3d). Such similar spectral changes were reported in depth-resolved Ni L2,3-edge XAS spectra of O/Ni/Cu(100), where the inner Ni layers showed a broad peak at about 857 eV and higher baseline than the surface Ni.35 Since the photon-in and photon-out angle was kept during our all measurements, the increase of the baseline intensity observed in the Ni L2,3-edge spectra at ≤0.35 V vs. RHE in the presence of EG can be interpreted as the increase of the film thickness of deposited metallic Ni nano/micro-particles on the Pt/SiC electrode. In our experimental setup, the X-ray probing depth can be estimated to be about 100 nm (Fig. 1d) and O K-edge FY-XAS signals of water molecules were detected (Fig. 3b). Thus, the film thickness of the nickel deposited onto the Pt electrode can be estimated to be <100 nm.
Based on our FY-XAS experimental results, electrochemical events at the liquid–electrode interface in the presence and absence of EG are summarized in Fig. 4. In the absence of EG, almost no spectral difference was observed in the Ni L2,3-edge region, indicating that no obvious structural change was detected in our setup. In the presence of EG, the removal of water molecules from the electrode surface occurs at >+0.35 V vs. RHE in the negative-going potential steps, revealed by O K-edge FY-XAS results. The electrochemical deposition and/or nucleation of metallic Ni nano-/micro-structured particles on the Pt electrode occurred at ≤+0.35 V vs. RHE. This Ni deposition process can be facilitated by ligand exchange reactions of NiII–EG complexes and/or stabilization of the Ni particles adsorbed by EG on the surface.52,53 Since the potential dependence of the Ni L2,3-edge spectra is reversible, the electrochemical re-oxidation and dissolution of Ni particles occurred at >+0.35 V vs. RHE.
 | ||
| Fig. 4 Schematic representation of proposed nano-/micro-structured Ni deposition and dissolution at the liquid–electrode interface (a) in the absence and (b) presence of EG. Spheres in green, red, gray, white, yellow, blue indicate nickel, oxygen, carbon, hydrogen, sulfur and nitrogen atoms, respectively. | ||
Conclusions
The electrochemical Ni deposition on the Pt/SiC electrode in the electrolyte solutions containing nickel sulfamate in the presence and absence of EG was tracked by in situ Ni L2,3-edge and O K-edge FY-XAS. In the presence of EG, water molecules are removed from the electrode surface at >+0.35 V vs. RHE and nano-/micro-structured Ni is electrochemically deposited at ≤+0.35 V vs. RHE. The NiII complex formation and surface adsorption of EG likely play a crucial role in the electrochemical Ni deposition. Our study demonstrates that in situ FY-XAS can be widely used to understand the formation process of nano-/micro-structured Ni at the solid–liquid interface in polyol reactions52 and electroplating, and the redox behavior of Ni involving (electro)catalytic reactions.For widespread applications of in situ FY-XAS techniques for electrochemical systems, further in situ FY-XAS studies are needed: for example, effects of X-ray radiolysis-induced photochemical reactions on the metal deposition. Metals and/or metal oxides are deposited by X-ray radiolysis-induced photochemical reactions and are known to highly depend on the electrode materials rather than the electrolyte.54–56 Currently, in situ FY-XAS studies using different metal electrode substrates under different experimental conditions are underway in our group.
Author contributions
AY proposed and directed this study. MK and IY designed the electrochemical cell. TI and MO prepared the synchrotron radiation experimental setup. AY, NA, SS, RN, YU, TI and MO performed synchrotron radiation and electrochemical experiments. AY and MK wrote the manuscript.Conflicts of interest
There are no conflicts to declare.Acknowledgements
We thank Shingo Mukai and Yusuke Kawamura (Technical Division, Institute for Catalysis, Hokkaido University) for their technical support with fabricating the spectro-electrochemical flow cell. This work was supported in part by a JSPS Grant-in-Aid for Scientific Research (KAKENHI) (No. 17H02755) and the Japan Keirin Autorace Foundation. The synchrotron radiation experiments were performed at beamline BL17SU of SPring-8 with the approval of the RIKEN SPring-8 Center (Proposal No. 20190055, 20190089, 20190090, and 20200082). We thank the engineering team at the RIKEN SPring-8 Center for their technical assistance and Edanz (https://jp.edanz.com/ac) for editing a draft of this manuscript.Notes and references
- D. A. Buttry and M. D. Ward, Chem. Rev., 1992, 92, 1355–1379 CrossRef CAS.
- N. Shpigel, M. D. Levi, S. Sigalov, L. Daikhin and D. Aurbach, Acc. Chem. Res., 2018, 51, 69–79 CrossRef CAS PubMed.
- J. F. Li, Y. F. Huang, Y. Ding, Z. L. Yang, S. B. Li, X. S. Zhou, F. R. Fan, W. Zhang, Z. Y. Zhou, D. Y. Wu, B. Ren, Z. L. Wang and Z. Q. Tian, Nature, 2010, 464, 392–395 CrossRef CAS PubMed.
- K. Ikeda, K. Takahashi, T. Masuda, H. Kobori, M. Kanehara, T. Teranishi and K. Uosaki, J. Phys. Chem. C, 2012, 116, 20806–20811 CrossRef CAS.
- M. Kato, S. Nakagawa, T. Tosha, Y. Shiro, Y. Masuda, K. Nakata and I. Yagi, J. Phys. Chem. Lett., 2018, 9, 5196–5200 CrossRef CAS PubMed.
- M. Kato, K. Ogura, S. Nakagawa, S. Tokuda, K. Takahashi, T. Nakamura and I. Yagi, ACS Omega, 2018, 3, 9052–9059 CrossRef CAS PubMed.
- M. Kato, Y. Masuda, N. Yoshida, T. Tosha, Y. Shiro and I. Yagi, Electrochim. Acta, 2021, 373, 137888 CrossRef CAS.
- X. Yang, Z. Sun, T. Low, H. Hu, X. Guo, F. J. García de Abajo, P. Avouris and Q. Dai, Adv. Mater., 2018, 30, 1704896 CrossRef PubMed.
- S. Yasuda, K. Tamura, M. Kato, H. Asaoka and I. Yagi, J. Phys. Chem. C, 2021, 125, 22154–22162 CrossRef CAS.
- J.-J. Velasco-Velez, C. H. Wu, T. A. Pascal, L. F. Wan, J. Guo, D. Prendergast and M. Salmeron, Science, 2014, 346, 831–834 CrossRef CAS PubMed.
- T. Ishihara, T. Tokushima, Y. Horikawa, M. Kato and I. Yagi, Rev. Sci. Instrum., 2017, 88, 104101 CrossRef PubMed.
- M. Yoshida, Y. Mitsutomi, T. Mineo, M. Nagasaka, H. Yuzawa, N. Kosugi and H. Kondoh, J. Phys. Chem. C, 2015, 119, 19279–19286 CrossRef CAS.
- M. Nagasaka, H. Yuzawa, T. Horigome, A. P. Hitchcock and N. Kosugi, J. Phys. Chem. C, 2013, 117, 16343–16348 CrossRef CAS.
- S. Bordiga, E. Groppo, G. Agostini, J. A. van Bokhoven and C. Lamberti, Chem. Rev., 2013, 113, 1736–1850 CrossRef CAS PubMed.
- J. Timoshenko and B. Roldan Cuenya, Chem. Rev., 2021, 121, 882–961 CrossRef CAS PubMed.
- M. Al Samarai, A. W. Hahn, A. Beheshti Askari, Y.-T. Cui, K. Yamazoe, J. Miyawaki, Y. Harada, O. Rüdiger and S. DeBeer, ACS Appl. Mater. Interfaces, 2019, 11, 38595–38605 CrossRef CAS PubMed.
- A. G. Oshchepkov, G. Braesch, A. Bonnefont, E. R. Savinova and M. Chatenet, ACS Catal., 2020, 10, 7043–7068 CrossRef CAS.
- V. Vij, S. Sultan, A. M. Harzandi, A. Meena, J. N. Tiwari, W.-G. Lee, T. Yoon and K. S. Kim, ACS Catal., 2017, 7, 7196–7225 CrossRef CAS.
- M. Kato, R. Nakahoshiba, K. Ogura, S. Tokuda, S. Yasuda, K. Higashi, T. Uruga, Y. Uemura and I. Yagi, ACS Appl. Energy Mater., 2020, 3, 6768–6774 CrossRef CAS.
- F. Luo, S. Wagner, I. Onishi, S. Selve, S. Li, W. Ju, H. Wang, J. Steinberg, A. Thomas, U. I. Kramm and P. Strasser, Chem. Sci., 2021, 12, 384–396 RSC.
- C. Chen, Y. J. Kang, Z. Y. Huo, Z. W. Zhu, W. Y. Huang, H. L. L. Xin, J. D. Snyder, D. G. Li, J. A. Herron, M. Mavrikakis, M. F. Chi, K. L. More, Y. D. Li, N. M. Markovic, G. A. Somorjai, P. D. Yang and V. R. Stamenkovic, Science, 2014, 343, 1339–1343 CrossRef CAS PubMed.
- B. Reuillard, M. Blanco, L. Calvillo, N. Coutard, A. Ghedjatti, P. Chenevier, S. Agnoli, M. Otyepka, G. Granozzi and V. Artero, ACS Appl. Mater. Interfaces, 2020, 12, 5805–5811 CrossRef CAS PubMed.
- H. Zeng, S. Chen, Y. Q. Jin, J. Li, J. Song, Z. Le, G. Liang, H. Zhang, F. Xie, J. Chen, Y. Jin, X. Chen and H. Meng, ACS Energy Lett., 2020, 5, 1908–1915 CrossRef CAS.
- V. R. Stamenkovic, B. Fowler, B. S. Mun, G. Wang, P. N. Ross, C. A. Lucas and N. M. Marković, Science, 2007, 315, 493–497 CrossRef CAS PubMed.
- C. Xu, P. Chen, B. Hu, Q. Xiang, Y. Cen, B. Hu, L. Liu, Y. Liu, D. Yu and C. Chen, CrystEngComm, 2020, 22, 4228–4237 RSC.
- N. Danilovic, R. Subbaraman, D. Strmcnik, K.-C. Chang, A. P. Paulikas, V. R. Stamenkovic and N. M. Markovic, Angew. Chem., Int. Ed., 2012, 51, 12495–12498 CrossRef CAS PubMed.
- R. Subbaraman, D. Tripkovic, K.-C. Chang, D. Strmcnik, A. P. Paulikas, P. Hirunsit, M. Chan, J. Greeley, V. Stamenkovic and N. M. Markovic, Nat. Mater., 2012, 11, 550–557 CrossRef CAS PubMed.
- D. Baudrand, Met. Finish., 1996, 94, 15–18 CrossRef CAS.
- U. S. Mohanty, B. C. Tripathy, P. Singh, A. Keshavarz and S. Iglauer, J. Appl. Electrochem., 2019, 49, 847–870 CrossRef CAS.
- X.-L. Wu and E. Ma, Appl. Phys. Lett., 2006, 88, 231911 CrossRef.
- S. Pathak, M. Guinard, M. G. C. Vernooij, B. Cousin, Z. Wang, J. Michler and L. Philippe, Surf. Coat. Technol., 2011, 205, 3651–3657 CrossRef CAS.
- A. Godon, J. Creus, X. Feaugas, E. Conforto, L. Pichon, C. Armand and C. Savall, Mater. Charact., 2011, 62, 164–173 CrossRef CAS.
- H. Ohashi, Y. Senba, H. Kishimoto, T. Miura, E. Ishiguro, T. Takeuchi, M. Oura, K. Shirasawa, T. Tanaka, M. Takeuchi, K. Takeshita, S. Goto, S. Takahashi, H. Aoyagi, M. Sano, Y. Furukawa, T. Ohata, T. Matsushita, Y. Ishizawa, S. Taniguchi, Y. Asano, Y. Harada, T. Tokushima, K. Horiba, H. Kitamura, T. Ishikawa and S. Shin, AIP Conf. Proc., 2007, 879, 523–526 CrossRef CAS.
- Y. Senba, H. Ohashi, H. Kishimoto, T. Miura, S. Goto, S. Shin, T. Shintake and T. Ishikawa, AIP Conf. Proc., 2007, 879, 718–721 CrossRef CAS.
- K. Amemiya, Phys. Chem. Chem. Phys., 2012, 14, 10477–10484 RSC.
- J. Clavilier, R. Faure, G. Guinet and R. Durand, J. Electroanal. Chem. Interfacial Electrochem., 1980, 107, 205–209 CrossRef CAS.
- M. Kato, M. Okui, S. Taguchi and I. Yagi, J. Electroanal. Chem., 2017, 800, 46–53 CrossRef CAS.
- E. Herrero, L. J. Buller and H. D. Abruña, Chem. Rev., 2001, 101, 1897–1930 CrossRef CAS PubMed.
- K. Franaszczuk and J. Sobkowski, Surf. Sci., 1988, 204, 530–536 CrossRef CAS.
- A. A. El-Shafei, J. Electroanal. Chem., 1998, 447, 81–89 CrossRef CAS.
- F. J. Sarabia, V. Climent and J. M. Feliu, J. Electroanal. Chem., 2018, 819, 391–400 CrossRef CAS.
- M. Chatenet, R. Faure and Y. Soldo-Olivier, J. Electroanal. Chem., 2005, 580, 275–283 CrossRef CAS.
- J. Teichert and M. Ruck, Eur. J. Inorg. Chem., 2019, 2019, 2267–2276 CrossRef CAS.
- L. R. Nylander and S. F. Pavkovic, Inorg. Chem., 1970, 9, 1959–1960 CrossRef CAS.
- B. M. Antti, Acta Chem. Scand., Ser. A, 1975, A29, 76–88 CrossRef CAS.
- A. Singh, S. L. Y. Chang, R. K. Hocking, U. Bach and L. Spiccia, Energy Environ. Sci., 2013, 6, 579–586 RSC.
- M. Yoshida, S. Onishi, Y. Mitsutomi, F. Yamamoto, M. Nagasaka, H. Yuzawa, N. Kosugi and H. Kondoh, J. Phys. Chem. C, 2017, 121, 255–260 CrossRef CAS.
- D. Wang, G. Ghirlanda and J. P. Allen, J. Am. Chem. Soc., 2014, 136, 10198–10201 CrossRef CAS PubMed.
- R. Nakamura, S. Saegusa, N. Akamatsu, K. Yamada, T. Ogasawara, M. Oura, T. Ohkochi and A. Yamaguchi, Jpn. J. Appl. Phys., 2021, 60, SBBC01 CrossRef CAS.
- J. Stöhr, A. Scholl, T. J. Regan, S. Anders, J. Lüning, M. R. Scheinfein, H. A. Padmore and R. L. White, Phys. Rev. Lett., 1999, 83, 1862–1865 CrossRef.
- H. Ishii, Y. Ishiwata, R. Eguchi, Y. Harada, M. Watanabe, A. Chainani and S. Shin, J. Phys. Soc. Jpn., 2001, 70, 1813–1816 CrossRef CAS.
- H. Dong, Y. C. Chen and C. Feldmann, Green Chem., 2015, 17, 4107–4132 RSC.
- K. J. Carroll, J. U. Reveles, M. D. Shultz, S. N. Khanna and E. E. Carpenter, J. Phys. Chem. C, 2011, 115, 2656–2664 CrossRef CAS.
- A. Yamaguchi, I. Sakurai, I. Okada, H. Izumi, M. Ishihara, T. Fukuoka, S. Suzuki and Y. Utsumi, J. Synchrotron Radiat., 2020, 27, 1008–1014 CrossRef CAS PubMed.
- S. Saegusa, I. Sakurai, I. Okada, T. Fukuoka, S. Suzuki, Y. Utsumi and A. Yamaguchi, Trans. Jpn. Inst. Electron. Packag., 2019, 12, E19-003 Search PubMed.
- A. Yamaguchi, I. Okada, I. Sakurai, H. Izumi, M. Ishihara, T. Fukuoka, S. Suzuki, K. Elphick, E. Jackson, A. Hirohata and Y. Utsumi, J. Synchrotron Radiat., 2019, 26, 1986–1995 CrossRef CAS PubMed.
Footnotes |
| † Electronic supplementary information (ESI) available. See DOI: 10.1039/d2ra01050j |
| ‡ Present address: Protein Crystal Analysis Division, Japan Synchrotron Radiation Research Institute (JASRI), 1-1-1 Kouto, Sayo, Hyogo 679-5198, Japan. |
| This journal is © The Royal Society of Chemistry 2022 |