 Open Access Article
A mitochondria targetable near-infrared fluorescence probe for glutathione visual biological detection†
Mingxuan Jiaa,
Liangnian Weib,
Yuxun Lua,
Ruqiu Zhangcd,
Qiuling Chena,
Wenjiang Xiacd,
Ye Liub,
Fan Lid and
Ying Zhou *a
*a
aCollege of Chemical Science and Technology, Yunnan University, Kunming 650091, P. R. China
bInstitute of Medical Biology, Chinese Academy of Medical Sciences, Peking Union Medical College, Kunming, Yunnan 650000, P. R. China
cSchool of Basic Medical Sciences, Kunming Medical University, Kunming 650500, P. R. China
dDepartment of Pathology and Pathophysiology, Medical College, Yunnan University, Kunming 650091, P. R. China
First published on 20th January 2022
Abstract
Glutathione (GSH), an abundant non-protein thiol, plays a crucial role in numerous biotic processes. Herein, a mitochondria-targeted near-infrared GSH probe (JGP) was synthesized, which displayed desired properties with high specificity and sensitivity, appreciable water solubility, and rapid response time. In the presence of GSH, nearly a 13-fold fluorescence emission growth appeared at 730 nm and the solvent color changed from blue to cyan. The sensing mechanism of JGP and GSH was confirmed by a high-resolution mass spectroscopy analysis. Moreover, good cell penetration enabled JGP to be successfully used for imaging biological samples such as HeLa cells, C. elegans, and especially rat brain slices. Imaging experiments showed that JGP could monitor the GSH concentration changes with a dose-dependent direct ratio in all the tested samples. The successful application of JGP in brain imaging indicates that JGP is a suitable GSH optical probe, which may have wide application value in fields of brain imaging. It also lays a theoretical and practical foundation for the further application of fluorescent probes in brain sciences.
1. Introduction
Glutathione (GSH) as a ubiquitous endogenous bio-thiol, is indispensable for keeping a suitable redox balance in living cells.1 Besides being involved in signal transduction, xenobiotic metabolism, and gene regulation, it has also been considered a biomarker of the tumor microenvironment and acute liver injury. GSH levels are also closely related to various serious diseases including Alzheimer's and Parkinson's diseases and liver diseases.2–5 Therefore, developing an effective detection tool for qualitative and quantitative analysis of GSH in vitro and in vivo is significant and urgently needed in clinical diagnosis.6,7Selectively detecting GSH from several coexisting bio-thiols (cysteine, homocysteine, selenocysteine, etc.) is difficult because of their analogous molecular structures and similar reactivities.8–11 Compared with the traditional detection methods, fluorescent probes afford a variety of testing advantages such as real-time spatial and in situ imaging, high sensitivity, non-invasiveness, and low damage for bio-samples.12,13 In recent years, some mediocre designs of fluorescent probes for testing GSH mostly imitate the antiquated mechanism such as Michael addition,14–17 nucleophilic substitution,18–23 and disulfide or Se–Se bond break,24–29 etc.30,31 However, most of them have the disadvantages of slow response time or poor selectivity, and these problems remain a challenge.
Brain science has always been a compelling research field, and has become more and more popular in recent years. The content and distribution of some substances in the brain are closely related to common brain diseases.32,33 In particular, GSH, as a reductive substance, can effectively fight against reactive oxygen species in the brain. In previous reports, hippocampal GSH levels in human postmortem brain samples have been reported to decrease with age.34 Besides, the previous study using the MPTP mouse model of Parkinson's disease (PD) showed GSH depletion with increased oxidative stress and EAAC1 dysfunction in the midbrain.35 All these observations indicated that the content of GSH in the brain had a potential relationship with neurodegenerative diseases such as Alzheimer's disease (AD) and PD. However, research focusing on brain GSH imaging is very limited due to the problem of poor anti-interference or unspecific selectivity.36,37 Therefore, we believe that developing a near-infrared, highly selective GSH probe for brain imaging is of great significance.
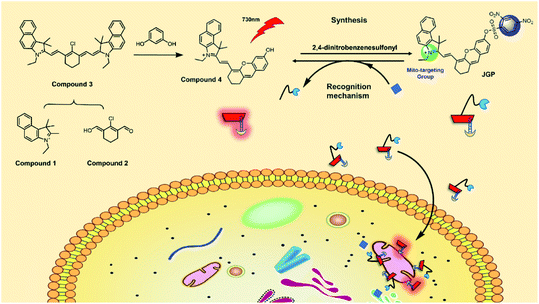
Fluorescence imaging is a common method of biological analysing,38,39 based on the previous works,40 we chose the typical fluorescence mechanism of intramolecular charge transfer (ICT) to regulate the fluorescence switch. Meanwhile, a positive nitrogen ion was introduced into the probe to ensure the mitochondrial localization ability.41–44 Thus, an ICT-based, 2,4-dinitrobenzenesulfonyl group modified near-infrared fluorescent probe JGP for the detection and bio-imaging of GSH was synthesized. As anticipated, the probe showed high specificity and sensitivity, an excellent linear relationship with the analyte, and good mitochondria colocalization ability. Moreover, stable optical properties and good penetration provided JGP with biological imaging capability in complex biological samples such as C. elegans and rat brain slices.
2. Results and discussion
2.1. Spectral responses of JGP toward GSH
First, the optical response of JGP toward GSH was investigated in phosphate buffer (0.02 mM, pH 7.4, PBS![[thin space (1/6-em)]](https://www.rsc.org/images/entities/char_2009.gif) :
:![[thin space (1/6-em)]](https://www.rsc.org/images/entities/char_2009.gif) EtOH = 3
EtOH = 3![[thin space (1/6-em)]](https://www.rsc.org/images/entities/char_2009.gif) :
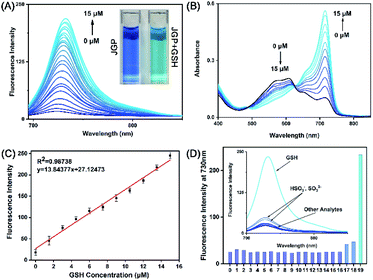
:![[thin space (1/6-em)]](https://www.rsc.org/images/entities/char_2009.gif) 7). As shown in Fig. 1A, JGP alone displayed extremely weak fluorescence. A fluorescence emission growth appeared at 730 nm after incubating JGP with the increasing concentration of GSH, and the solvent colour changed from blue to cyan. Free JGP exhibit two absorption maxima around 555 nm and 610 nm. The absorption band at 555 nm disappeared with the addition of GSH, whereas a new absorption band appeared at 715 nm (Fig. 1B), suggesting JGP responds to GSH.
7). As shown in Fig. 1A, JGP alone displayed extremely weak fluorescence. A fluorescence emission growth appeared at 730 nm after incubating JGP with the increasing concentration of GSH, and the solvent colour changed from blue to cyan. Free JGP exhibit two absorption maxima around 555 nm and 610 nm. The absorption band at 555 nm disappeared with the addition of GSH, whereas a new absorption band appeared at 715 nm (Fig. 1B), suggesting JGP responds to GSH.
The fluorescence intensity at 730 nm was linearly proportional to the GSH concentration in the range of 0–15 μM with a limit of detection (LOD) of 6 × 10⁻⁷ M (Fig. 1C). Intracellular concentrations45,46 of Cys (30 μM), Hcy (12.5 μM), GSH (1 mM), thiol-lacking amino acids (200 μM) and other analytes (10 μM) were selected as interference potential materials to test the selectivity of probe JGP (Fig. 1D). The probe had little response to all compounds other than GSH. Considering that sulfites are toxic to organisms and are present in very small quantities in vivo,46 it can be recognized that JGP had an excellent selectivity towards GSH. As shown in Fig. S5,† probe JGP was stable between pH 2.0 to 11.0 and worked well between pH 6.6 to 10.0 in response to GSH. Therefore, JGP can be used in physiological conditions such as in living cells.
2.2. Study of mechanism
ESI-MS was carried out to verify the reaction mechanism, as demonstrated in Fig. S3.† After the reaction of JGP with GSH, a new peak at m/z 448.2303 was assigned to the product of compound 4 ([M]+ calcd 448.2271) formed after the bond breaking reaction between JGP and GSH. It indicates that the response mechanism of JGP to GSH is based on the removal of 2,4-nitrobenzene sulfonate and JGP could be used for GSH detection as a fluorescent probe.2.3. Cell labeling and intracellular colocalization studies
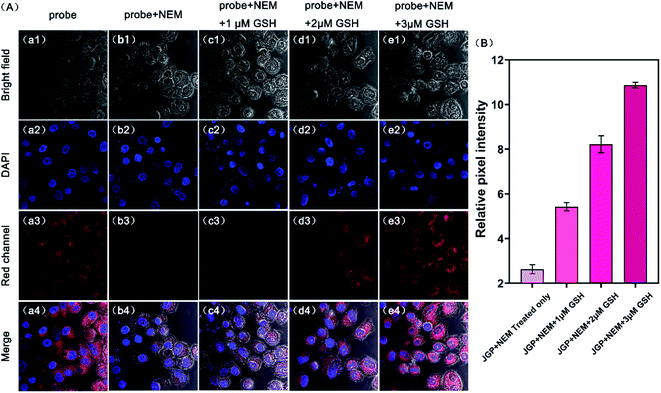
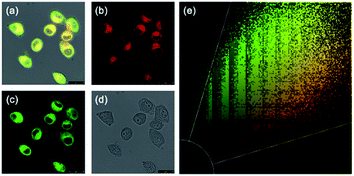
According to the cytotoxicity study (Fig. S6†), the inhibitory rate of the probe JGP on normal cells was much lower than that on tumor cells at the same concentration. In order to further verify the detection capability of JGP for GSH in cells, fluorescence imaging studies were carried out using HeLa cells, in the presence of NEM (N-ethylmaleimide) to get rid of GSH in some bio-samples. The acquired fluorescence images revealed that the fluorescence intensity in the untreated HeLa cells (Fig. 2Aa3) was greater than that in NEM-treated cells (Fig. 2Ab3). The fluorescence imaging results showed in Fig. 2B demonstrated that JGP could monitor the GSH concentration changes in a dose-dependent manner.Further, we explored the intracellular localization ability of JGP in HeLa cells using commercial mitochondria-specific tracker-Mito Tracker Green. The extent of fluorescence overlap for JGP with mitochondria was codified in the form of the Pearson's overlap coefficient (PC) of 0.94, an average over at least 3 independent experiments (Fig. 3). As anticipated, the presence of the positive ion on nitrogen in the probe JGP afforded an excellent ability for staining mitochondria. Therefore, probe JGP can be potentially applied to analyse exogenous/endogenous GSH content in vivo qualitatively.
2.4. Confocal imaging of C. elegans and rats brain slices
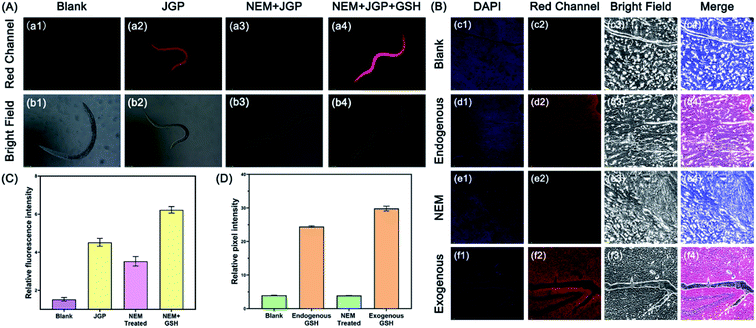
In order to further validate the imaging ability of JGP in more sophisticated biological samples, the in vivo imaging of glutathione was evaluated in C. elegans and rat brain slices. C. elegans were randomly divided into four groups: the first group was blank; the second group was only treated with probe JGP (20 μM); the third group was first treated with NEM (20 μM) to get rid of the endogenous GSH and then incubated with probe JGP (20 μM); the last group was incubated with NEM, JGP, and GSH in turn. As evident from Fig. 4A and C, there was almost no fluorescence response from the blank group. In group 2 and group 4, significant fluorescence could be observed, indicating the presence of GSH in nematodes. The fluorescent intensity in group 4 was higher than that in group 2, which indicated that the concentration of GSH in nematodes increased after exogenous treatment (Fig. 4C). In third group, fluorescence intensity was significantly lower as compared to group 2 and group 4, which confirmed that NEM removed endogenous GSH in C. elegans. We further investigated the imaging ability of JGP in rat brain slices. In previous studies,47–50 it was found that the content of GSH in the brain environment contributed to the balance of the content of reactive oxygen species (ROS) partly.The insufficient content of GSH can interrupt the brain REDOX balance and result in the risk of stroke diseases. If the probe JGP can successfully image GSH in rat brain slices, it will have the possibility to monitor the changes of GSH in the brain, which is of great significance for the detection of various diseases caused by the decrease of GSH content. Frozen brain slices were chosen for confocal imaging and divided into four groups: blank group, endogenous GSH group, NEM-preincubated group (since NEM is a GSH scavenger, the lower fluorescence intensity of NEM group than that of the exogenous group would indicate that the probe JGP can detect exogenous GSH), and exogenous GSH group. As exhibited in Fig. 4B and D, we found that the fluorescence intensity values of the endogenous GSH group and exogenous GSH group were much higher than that of the other two groups, which directly demonstrated that the ability of probe JGP to image GSH in the brain environment and its potential for imaging GSH in other complex biological models. Due to the advantage of near-infrared fluorescence emission of the probe JGP, even the rat brain slices showed strong green autofluorescence in the confocal experiments, the bio-imaging by JGP can still clearly chase the GSH concentrate changes in the biological samples without any interference. Thus, JGP was proved to be a unique probe that can be used for monitoring and visualizing the GSH fluctuation in the internal environment of complex biological samples.
3. Experimental
3.1. Materials and instruments
All solvents and reagents were purchased commercially and used without further purification. Flash column chromatography was performed using silica gel (200–300 mesh). Mass spectra were recorded on cation SpecHiResESI mass spectrometer. NMR spectra were recorded on a 400 MHz spectrometer (Bruker, Germany).3.2. Design and synthesis of probe JGP
Cyanine derivative was selected as the fluorophore due to its excellent photophysical properties, and the positively charged moiety of indole ammonium cation was chosen for mitochondria targeting. 2,4-Dinitrobenzenesulfonyl group was introduced at the hydroxyl site of the fluorophore as both a GSH responsive group and a quencher. Synthesis methods of compounds 1, 2, 3, and 4 are according to the previous literature.51 The synthetic route of JGP is illustrated in Scheme 1, and it was characterized and confirmed by 1H NMR and 13C NMR spectroscopy (Fig. S1†). To synthesize JGP, compound 4 (287.75 mg, 0.5 mmol) was dissolved in anhydrous dichloromethane. To this, triethylamine (0.10 mL, 0.75 mmol) and 2,4-dinitrobenzenesulfonyl chloride (265.94 mg, 1 mmol) were added, and the mixture was reacted at room temperature for 3 hours. After completion of the reaction, the resulting solution was extracted with deionized water three times (3 × 20 mL). The organic layer was dried over Na2SO4, and then the solvent was evaporated. The crude solid was purified by silica gel column chromatography with methanol/dichloromethane (1![[thin space (1/6-em)]](https://www.rsc.org/images/entities/char_2009.gif) :
:![[thin space (1/6-em)]](https://www.rsc.org/images/entities/char_2009.gif) 100, v/v) to afford a cyan powder of JGP. Yield: 42% (169.07 mg). 1H NMR (400 MHz, CDCl3) δ (ppm) 8.886 (d, J = 2.8 Hz, 1H), 8.537 (m, 1H), 8.198 (d, J = 8.4 Hz, 1H), 8.049 (m, 2H), 7.677 (t, J = 7 Hz, 2H), 7.654 (m, 1H), 7.511 (t, 1H), 7.370 (m, 1H), 6.968 (m, 1H), 6.791 (m, 1H), 6.766 (m, 1H), 4.819 (q, J = 6.4 Hz, 2H), 2.8885 (m, 2H), 2.762 (m, 2H), 2.076 (s, 6H), 1.972 (m, 2H), 1.639 (t, J = 1.2 Hz, 3H). 13C NMR (100 MHz, CDCl3) δ (ppm) 197.80, 158.18, 152.98, 151.12, 149.47, 148.83, 148.23, 147.43, 145.42, 138.23, 137.08, 134.36, 133.12, 131.83, 131.56, 130.21, 128.76, 128.45, 127.39, 126.86, 125.19, 122.65, 121.69, 120.46, 118.18, 115.52, 111.65, 110.09, 106.44, 53.05, 42.01, 29.51, 27.54, 27.43, 24.12, 20.11, 13.39. HEMS (ESI): calcd for C37H32N3O8S+ [M]+ = 678.1905, found m/z 678.1902.
100, v/v) to afford a cyan powder of JGP. Yield: 42% (169.07 mg). 1H NMR (400 MHz, CDCl3) δ (ppm) 8.886 (d, J = 2.8 Hz, 1H), 8.537 (m, 1H), 8.198 (d, J = 8.4 Hz, 1H), 8.049 (m, 2H), 7.677 (t, J = 7 Hz, 2H), 7.654 (m, 1H), 7.511 (t, 1H), 7.370 (m, 1H), 6.968 (m, 1H), 6.791 (m, 1H), 6.766 (m, 1H), 4.819 (q, J = 6.4 Hz, 2H), 2.8885 (m, 2H), 2.762 (m, 2H), 2.076 (s, 6H), 1.972 (m, 2H), 1.639 (t, J = 1.2 Hz, 3H). 13C NMR (100 MHz, CDCl3) δ (ppm) 197.80, 158.18, 152.98, 151.12, 149.47, 148.83, 148.23, 147.43, 145.42, 138.23, 137.08, 134.36, 133.12, 131.83, 131.56, 130.21, 128.76, 128.45, 127.39, 126.86, 125.19, 122.65, 121.69, 120.46, 118.18, 115.52, 111.65, 110.09, 106.44, 53.05, 42.01, 29.51, 27.54, 27.43, 24.12, 20.11, 13.39. HEMS (ESI): calcd for C37H32N3O8S+ [M]+ = 678.1905, found m/z 678.1902.
3.3. UV-Vis and fluorescence spectroscopy
UV-240IPC spectrophotometer (Shimadzu) and F97XP spectrofluorometer were used for acquiring the absorption spectra and fluorescence spectra, respectively, using 1 cm standard quartz cell. The emission spectrum was recorded at the excitation wavelength of 680 nm, and the excitation spectrum as monitored at the wavelength of 730 nm. The stock solution of probe JGP (5 mM) was prepared in ethanol.3.4. Determination of the detection limit
The lowest detection limit was estimated by following regression equation as adopted in previous report.523.5. Cell imaging experiment and colocalization study
The HeLa cells were provided by the Kunming Institute of Zoology, Chinese Academy of Sciences. First, the cells were washed three times with PBS buffer (0.01 M, pH 7.4). After washing the cell culture dish twice with PBS buffer, HeLa cells were transferred, and 1 mL of PBS buffer was added. Next, the HeLa cells were incubated with probe JGP (5 μM) for 1 h, treated with a large amount of NEM (glutathione scavenger, 500 μM), followed by the addition of GSH. The Olympus laser confocal microscope (FV10i) was used to test the red channel. In the cell colocalization study, after incubation with probe JGP (5 μM) for 30 min, group 1 were washed twice with PBS buffer and then incubated with DAPI for 15–30 min. Then cells were then washed twice with PBS buffer and incubated with mitochondrial dye (Mito Tracker Green (10 nM)) for 30 min. The red channel (670–760 nm) fluorescence was again detected using Olympus laser confocal microscope (FV10i). Channel selection: DAPI (λem = 461 nm); green (λem = 500–580 nm); red (λem = 670–760 nm).3.6. C. elegans fluorescence imaging
C. elegans were divided into four groups for CLSM. The first group was the blank group. The second group was incubated with 4% formaldehyde for 30 min and then treated with JGP for 2 h after washing with de-aerated M9 buffer three times. The third group was incubated in de-aerated M9 buffer with NEM (1.0 mM) at 20 °C for 1 h, and then treated with GSH (200 μM) for 2 h. After fixing with 4% formaldehyde for 30 min, C. elegans were finally stained with 20 μM of JGP for 2 h. Analogously, the last group was incubated in de-aerated M9 buffer with NEM (1.0 mM) for 30 min but without GSH treatment. After the same process, the nematodes were stained with 20 μM of JGP for 2 h. C. elegans were washed with de-aerated M9 buffer three times before each step. Finally, fluorescence imaging was performed by the Olympus BX51 fluorescence microscopy.3.7. Rat brain slices confocal imaging
All animal studies were approved by the Committee on Animal Research and Ethics of Yunnan University (yuncare20200353). We chose 9–11 day old C57BL/6J mice after birth. Rats were deeply anesthetized by intraperitoneal injection of 10% chloral hydrate (0.3 mL/100 g, IP). Brain tissues of the rat were taken out and then immersed in 2% paraformaldehyde solution for fixation overnight at 4 °C. After fixation, the brain tissues were transferred into 15% and 30% sucrose solution for dehydration. The mice brain tissues were frozen in liquid nitrogen with an embedding agent and then stored in a refrigerator at −20 °C. Frozen rat brain sections were prepared by the frozen section mechanism with a thickness of 20 μm. These slices were divided into 4 groups, which were incubated successively with 4,6-diamidino-2-phenylindole (DAPI) (all groups) for 30 min, 1 mM N-ethylmaleimide (NEM) (group 3, in PBS buffer) for 30 min, 20 μM JGP (group 2, 3 and 4, in PBS buffer) for 1 h, and 20 μM GSH (group 4, in PBS buffer) for 1 h. All incubation processes were carried out at 37 °C, and samples were washed thrice with red channel PBS buffer at the end of each treatment. After mounting with glycerol gelatin aqueous slide mounting medium, brain slices were transferred to Olympus laser confocal microscope (FV10i) for observation. Channel selection: DAPI (λem = 461 nm); red (λem = 670–760 nm).4. Conclusions
We have designed and synthesized a near-infrared probe JGP for detecting GSH in biologic samples. The optical properties of the probe showed that it had obvious colorimetric change, fast response, excellent selectivity, good linearity with the analyte, and a low detection limit (600 nM). The probe JGP showed excellent cell penetration and successfully detected exogenous and endogenous GSH in HeLa cells, C. elegans, and the rat brain slices, with noticeable fluorescence changes. Therefore, we believe that this newly developed probe JGP may have potential in a wide range of applications in monitoring GSH content changes in brain science-related research and clinical medicine.Ethical statement
All animal procedures were performed in accordance with the Guidelines for Care and Use of Laboratory Animals of Yunnan University and approved by the Committee on Animal Research and Ethics of Yunnan University (yuncare20200353).Author contributions
Mingxuan Jia: investigation, probe synthesis, spectral testing and biological imaging, data curation, writing – original draft. Liangnian Wei: cell imaging test. Yuxun Lu: optical studies, brain slices imaging test. Ruqiu Zhang: brain slices imaging test. Qiuling Chen: conceptualization, optical studies. Wenjing Xia: brain slices imaging test. Ye Liu: supervision of cell imaging test. Fan Li: funding acquisition, supervision of brain slices imaging test. Ying Zhou: funding acquisition, supervision, writing and revising manuscript.Conflicts of interest
There are no conflicts to declare.Acknowledgements
This work is supported by the National Natural Science Foundation of China (22067019, 82171430) and the Scientific Research Foundation Project of Yunnan Provincial Department of Education (2021Y031). Authors thank Advanced Analysis and Measurement Center of Yunnan University for the sample testing service.References
- C. Wang, X. Xia, J. Luo and Y. Qian, Dyes Pigm., 2018, 152, 85–92 CrossRef CAS.
- K. Umezawa, M. Yoshida, M. Kamiya, T. Yamasoba and Y. Urano, Nat. Chem., 2017, 9, 279–286 CrossRef CAS PubMed.
- J. Huang, Y. Chen, J. Qi, X. Zhou, L. Niu, Z. Yan, J. Wang and G. Zhao, Spectrochim. Acta, Part A, 2018, 201, 105–111 CrossRef CAS PubMed.
- X. Yang, W. Liu, J. Tang, P. Li, H. Weng, Y. Ye, M. Xian, B. Tang and Y. Zhao, Sci. Rev. Chem. Commun., 2018, 54, 11387–11390 RSC.
- N. Zhou, F. Huo, Y. Yue, K. Ma and C. Yin, Chin. Chem. Lett., 2020, 31, 2970–2974 CrossRef CAS.
- E. Camera and M. Picardo, J. Chromatogr. B: Anal. Technol. Biomed. Life Sci., 2002, 781, 181–206 CrossRef CAS.
- D. Spector, J. Labarre and M. B. Toledano, J. Biol. Chem., 2001, 276, 7011–7016 CrossRef CAS PubMed.
- D. Yue, M. Wang, F. Deng, W. Yin, H. Zhao, X. Zhao and Z. Xu, Chin. Chem. Lett., 2018, 29, 648–656 CrossRef CAS.
- W. Liu, J. Chen and Z. Xu, Coord. Chem. Rev., 2021, 429, 213638 CrossRef CAS.
- S. Lee, J. Li, X. Zhou, J. Yin and J. Yoon, Coord. Chem. Rev., 2018, 366, 29–68 CrossRef CAS.
- K. Yin, F. Yu, W. Zhang and L. Chen, Biosens. Bioelectron., 2015, 74, 156–164 CrossRef CAS PubMed.
- F. Deng and Z. Xu, Chin. Chem. Lett., 2019, 30, 1667–1681 CrossRef CAS.
- Z. Zhang, F. Wang and X. Chen, Chin. Chem. Lett., 2019, 30, 1745–1757 CrossRef CAS.
- J. Liu, Y. Sun, Y. Huo and H. Zhang, J. Am. Chem. Soc., 2014, 136, 574–577 CrossRef CAS PubMed.
- J. Chen, X. Jiang, C. Zhang, K. R. MacKenzie, F. Stossi, T. Palzkill, M. C. Wang and J. Wang, ACS Sens., 2017, 2, 1257–1261 CrossRef CAS PubMed.
- Z. Liu, X. Zhou, Y. Miao, Y. Hu, N. Kwon, X. Wu and J. Yoon, Angew. Chem., Int. Ed., 2017, 56, 5812–5816 CrossRef CAS PubMed.
- X. Zhang, L. Zhang, X. Wang, X. Han, Y. Huang, B. Li and L. Chen, J. Hazard. Mater., 2021, 419, 126476 CrossRef CAS PubMed.
- X. Xia, Y. Qian and B. Shen, J. Mater. Chem. B, 2018, 6, 3023–3029 RSC.
- J. Liu, M. Liu, H. Zhang, X. Wei, J. Wang, M. Xian and W. Guo, Chem. Sci., 2019, 10, 10065–10071 RSC.
- J. Gao, Y. Tao, N. Wang, J. He, J. Zhang and W. Zhao, Spectrochim. Acta, Part A, 2018, 203, 77–84 CrossRef CAS PubMed.
- J. Liu, Y. Sun, H. Zhang, Y. Huo, Y. Shi and W. Guo, Chem. Sci., 2014, 5, 3183–3188 RSC.
- J. Xu, J. Pan, Y. Zhang, J. Liu, L. Zeng and X. Liu, Sens. Actuators, B, 2017, 238, 58–65 CrossRef CAS.
- Z. Xu, M. Zhang, Y. Xu, S. H. Liu, L. Zeng, H. Chen and J. Yin, Sens. Actuators, B, 2019, 290, 676–683 CrossRef CAS.
- F. Wang, L. Zhou, C. Zhao, R. Wang, Q. Fei, S. Luo, Z. Guo, H. Tian and W. Zhu, Chem. Sci., 2015, 6, 2584–2589 RSC.
- F. Kong, Z. Liang, D. Luan, X. Liu, K. Xu and B. Tang, Anal. Chem., 2016, 88, 6450–6456 CrossRef CAS PubMed.
- M. Gangopadhyay, R. Mengji, A. Paul, Y. Venkatesh, V. Vangala, A. Jana and N. D. P. Singh, Chem. Commun., 2017, 53, 9109–9112 RSC.
- Y. Liu, S. Zhu, K. Gu, Z. Guo, X. Huang, M. Wang, H. M. Amin, W. Zhu and P. Shi, ACS Appl. Mater. Interfaces, 2017, 9, 29496–29504 CrossRef CAS PubMed.
- X. Zhang, Y. Huang, X. Han, Y. Wang, L. Zhang and L. Chen, Anal. Chem., 2019, 91, 14728–14736 CrossRef CAS PubMed.
- Y. Huang, Q. Liu, Y. Wang, N. He, R. Zhao, J. Choo and L. Chen, Nanoscale, 2019, 11, 12220–12229 RSC.
- X. Li, Y. Hou, X. Meng, C. Ge, H. Ma, J. Li and J. Fang, Angew. Chem., Int. Ed., 2018, 57, 6141–6145 CrossRef CAS PubMed.
- F. Wu, H. Wang, J. Xu, H. Yuan, L. Zeng and G. Bao, Sens. Actuators, B, 2018, 254, 21–29 CrossRef CAS.
- J. N. Cobley, M. L. Fiorello and D. M. Bailey, Redox Biol., 2018, 15, 490–503 CrossRef CAS PubMed.
- W. Chen, Y. Guo, W. Yang, P. Zheng, J. Zeng and W. Tong, Restor. Neurol. Neurosci., 2017, 35, 217–224 CAS.
- C. Venkateshappa, G. Harish, A. Mahadevan, M. M. S. Bharath and S. K. Shankar, Neurochem. Res., 2012, 37, 1601–1614 CrossRef CAS PubMed.
- K. Aoyama, N. Matsumura, M. Watabe and T. Nakaki, Eur. J. Neurosci., 2008, 27, 20–30 CrossRef PubMed.
- D. Zhang, W. Du, B. Peng, Y. Ni, H. Fang, X. Qiu, G. Zhang, Q. Wu, C. Yu, L. Lin and W. Huang, Sens. Actuators, B, 2020, 323, 128673 CrossRef CAS.
- G. Yin, Y. Gan, H. Jiang, T. Yu, M. Liu, Y. Zhang, H. Li, P. Yin and S. Yao, Anal. Chem., 2021, 93, 9878–9886 CrossRef CAS PubMed.
- H. Han, H. Tian Jr, Y. Zang, A. C. Sedgwick, J. Li, J. Sessler, X. He and T. D. James, Chem. Soc. Rev., 2021, 50, 9391–9429 RSC.
- S. K. Pramanik and A. Das, Chem. Commun., 2021, 57, 12058–12073 RSC.
- C.-S. Jiang, Z.-Q. Cheng, Y.-X. Ge, J.-L. Song, J. Zhang and H. Zhang, Anal. Methods, 2019, 11, 3736–3740 RSC.
- H. Xiao, Y. Dong, J. Zhou, Z. Zhou, X. Wu, R. Wang, Z. Miao, Y. Liu and S. Zhuo, Analyst, 2019, 10, 653–660 Search PubMed.
- Z. Xu, X. Huang, X. Han, D. Wu, B. Zhang, Y. Tan, M. Cao, S. H. Liu, J. Yin and J. Yoon, Chem, 2018, 4, 1609–1628 CAS.
- X. Zhang, N. He, Y. Huang, F. Yu, B. Li, C. Lv and L. Chen, Sens. Actuators, B, 2019, 282, 69–77 CrossRef CAS.
- M. Gao, F. Yu, H. Chen and L. Chen, Anal. Chem., 2015, 87, 3631–3638 CrossRef CAS PubMed.
- C. Huang and Y. Qian, Spectrochim. Acta, Part A, 2019, 217, 68–76 CrossRef CAS PubMed.
- D. Shukla, P. K. Mandal, L. Ersland, E. R. Grüner, M. Tripathi, P. Raghunathan, A. Sharma, G. R. Chithya, K. Punjabi and C. Splaine, J. Alzheimer's Dis., 2018, 66, 517–532 CAS.
- C. D. Rae and S. R. Williams, Anal. Biochem., 2017, 529, 127–143 CrossRef CAS PubMed.
- S.-J. Li, D.-Y. Zhou, Y.-F. Li, B. Yang, J. Ou-Yang, J. Jie, J. Liu and C.-Y. Li, Talanta, 2018, 188, 691–700 CrossRef CAS PubMed.
- J. Xu, Y. Zhang, H. Yu, X. Gao and S. Shao, Anal. Chem., 2016, 88, 1455–1461 CrossRef CAS PubMed.
- L.-J. Zhang, Z.-Y. Wang, X.-J. Cao, J.-T. Liu and B.-X. Zhao, Sens. Actuators, B, 2016, 236, 741–748 CrossRef CAS.
- A. Slivka, M. B. Spina and G. Cohen, Neurosci. Lett., 1987, 74, 112–118 CrossRef CAS PubMed.
- C. Venkateshappa, G. Harish, A. Mahadevan, M. M. S. Bharath and S. K. Shankar, Neurochem. Res., 2012, 37, 1601–1614 CrossRef CAS PubMed.
Footnote |
| † Electronic supplementary information (ESI) available. See DOI: 10.1039/d1ra08917j |
| This journal is © The Royal Society of Chemistry 2022 |

