
 Open Access Article
 This Open Access Article is licensed under a Creative Commons Attribution-Non Commercial 3.0 Unported Licence
Selective catalytic reduction of NOx by low-temperature NH3 over MnxZr1 mixed-oxide catalysts
Shuaibo Zhang,
Haixia Li *,
Anchao Zhang*,
Zhijun Sun,
Xinmin Zhang,
Changze Yang,
Leying Jin and
Zhiheng Song
*,
Anchao Zhang*,
Zhijun Sun,
Xinmin Zhang,
Changze Yang,
Leying Jin and
Zhiheng Song
School of Mechanical and Power Engineering, Henan Polytechnic University, Jiaozuo 454000, China. E-mail: lihx@hpu.edu.cn
First published on 6th January 2022
Abstract
MnxZr1 series catalysts were prepared by a coprecipitation method. The effect of zirconium doping on the NH3-SCR performance of the MnOx catalyst was studied, and the influence of the calcination temperature on the catalyst activity was explored. The results showed that the Mn6Zr1 catalyst exhibited good NH3-SCR activity when calcined at 400 °C. When the reaction temperature was 125–250 °C, the NOx conversion rate of Mn6Zr1 catalyst reached more than 90%, and the optimal conversion efficiency reached 97%. In addition, the Mn6Zr1 catalyst showed excellent SO2 and H2O resistance at the optimum reaction temperature. Meanwhile, the catalysts were characterized. The results showed that the morphology of the MnOx catalyst was significantly changed, whereby as the proportion of Mn4+ and Oα species increased, the physical properties of the catalyst were improved. In addition, both Lewis acid sites and Brønsted acid sites existed in the Mn6Zr1 catalyst, which reduced the reduction temperature of the catalyst. In summary, zirconium doping successfully improved the NH3-SCR performance of MnOx.
1. Introduction
With the exploitation of fossil fuels, severe pollution has been caused to the atmosphere, with nitrogen oxide (NOx) being one of the most important pollutants. Therefore, NOx removal is critical. At present, the most effective way to remove NOx is through NH3 selective catalytic reduction (NH3-SCR).1,2 However, the commercial V2O5/TiO2 catalysts used in this technique have excellent deoxidation activity only at high temperatures and have a narrow operating temperature window (350–450 °C). The activity of the V2O5/TiO2 catalyst is poor at low temperatures and can cause V poisoning and other shortcomings.3,4 In addition, the presence of abundant SO2 gas in the flue gas will cause deactivation of the V2O5/TiO2 catalyst.4,5 To solve this problem, SCR equipment should be installed downstream of the SO2 removal unit. However, the downstream temperature is about 200 °C, which is unable to achieve the optimal reaction temperature of the V2O5/TiO2 catalyst.6 Therefore, the development of low-temperature, high-activity catalysts is significant.The most widely studied catalysts are transition metal catalysts, rare earth metal catalysts, and zeolite catalysts. For transition metal catalysts, manganese oxide (MnOx) has attracted much attention because of its excellent SCR performance. Jiang et al.7 prepared the Mn-MOF-74 metal–organic framework by a hydrothermal method and formed spherical mesoporous manganese oxide nanoparticles by thermal decomposition. The catalyst has the characteristics of a large specific surface area and efficient denitration performance. However, when MnOx meets water and sulfur, the MnOx catalyst is easily deactivated, which seriously affects the denitrification activity. Casapu et al.8 reported that SO2 poisoning would lead to the irreversible redox capacity of the catalyst. Therefore, it is necessary to enhance the water resistance and sulfur resistance of MnOx. Gao et al.9 added Co to MnOx by a complexation esterification, and the catalyst showed excellent activity and an enhanced corrosion resistance of MnOx to SO2. Wang et al.10 showed that the Fe–Mn/Al2O3 catalyst at 150 °C had a NO conversion rate of more than 99%, N2 selectivity of more than 98%, and strong SO2 and H2O corrosion resistance. Thus, the addition of one or more transition metals to MnOx can make the catalyst have better sulfur resistance and water resistance.
Zirconium has received much attention due to its excellent thermal stability and surface acidity. Gao et al.11 prepared a superacid catalyst by loading cerium oxide on zirconia sulfate, which significantly improved the SCR performance of the catalyst. The zirconium additive can increase the dispersion and activity of the catalyst, and enhance the sulfur resistance of the catalyst.12 Shi et al.5 improved the high-temperature activity and N2 selectivity of the catalysts by introducing zirconium into V2O5/WO3–TiO2.
Therefore, zirconium was doped in MnOx catalyst in this study to prepare a highly efficient SCR catalyst. In addition, the calcination temperature has a significant effect on the activity of the catalyst. Chen et al.13 found that different calcination temperatures have many effects on MnAlOx catalysts, with the most excellent activity at 400 °C, while the activity of the catalysts calcined at 600 °C decreased sharply. Fang et al.14 also found that the calcination of Fe–Mn–Zr catalysts at different calcination temperatures not only affected the activity of the catalyst, but also changed the surface structure of the catalyst. Furthermore, when the calcination temperature was 800 °C, the catalyst had very poor tolerance to SO2, and the NO conversion efficiency was only 20%. Therefore, study of the calcination temperature is critical.
In the present study, a series of new MnxZr1 catalysts was prepared by a coprecipitation method, and the effects of the Mn/Zr ratio and calcination temperature on the activity and SO2 and H2O resistance of the catalysts were studied. In addition, the denitration activity was tested in a simulated gas in a fixed-bed reactor. Moreover, the physicochemical properties of the catalysts were studied by a temperature-programmed technique, SEM, FTIR, XRD, BET, XPS, H2-TPR, NH3-TPD, and other related experiments and characterization.
2. Experimental
2.1 Materials and reagents
Mn(NO3)2·4H2O (≥99.0%, MACKLIN, Shanghai), Zr(NO3)4·5H2O (≥99.0%, MACKLIN, Shanghai) and related metal nitrates were used as the precursor for the catalyst preparation. NaOH (≥96.0%, MACKLIN, Shanghai) was used to regulate the pH, while (NH4)2CO3 (≥40.0%, Hongyan, Tianjin) was used as the precipitator. In this study, none of the reagents used needed to be further purified.2.2 Catalyst preparation
A series of MnxZr1 catalysts was prepared by a coprecipitation method. Taking the Mn6Zr1 catalyst as an example, the preparation method of the catalyst is described in detail. Specifically, a certain amount of Mn(NO3)2·4H2O and Zr(NO3)4·5H2O were added to a 300 mL beaker at room temperature, and then 100 mL distilled water was added, and for the sample where Mn![[thin space (1/6-em)]](https://www.rsc.org/images/entities/char_2009.gif) :Zr = 6:1 (molar ratio), the prepared catalyst was named Mn6Zr1 according to the molar ratio of elements. The solution beaker was then put into a constant temperature magnetic stirring pot for rapid stirring and dissolution. After 30 min, a certain amount of 0.5 mol L−1 (NH4)2CO3 solution was gradually added, and then 0.5 mol L−1 NaOH solution was gradually dropped in to make pH 9, and the solution was stirred for another 2 h. Then, the solution was aged at room temperature for 24 h, and afterward the supernatant was poured out, the sediment in the cup was collected, and the sediment was washed to neutral with deionized water. The cleaned samples were dried in a vacuum drying oven at 105 °C, and the calcination temperature was set at 400 °C in a muffle furnace, and the calcination temperature was set at the set temperature for 3 h (the heating rate was 5 °C min−1). Ultimately, a solid was obtained and collected and sieved using a 40–60 mesh to the obtain Mn6Zr1 catalyst.
:Zr = 6:1 (molar ratio), the prepared catalyst was named Mn6Zr1 according to the molar ratio of elements. The solution beaker was then put into a constant temperature magnetic stirring pot for rapid stirring and dissolution. After 30 min, a certain amount of 0.5 mol L−1 (NH4)2CO3 solution was gradually added, and then 0.5 mol L−1 NaOH solution was gradually dropped in to make pH 9, and the solution was stirred for another 2 h. Then, the solution was aged at room temperature for 24 h, and afterward the supernatant was poured out, the sediment in the cup was collected, and the sediment was washed to neutral with deionized water. The cleaned samples were dried in a vacuum drying oven at 105 °C, and the calcination temperature was set at 400 °C in a muffle furnace, and the calcination temperature was set at the set temperature for 3 h (the heating rate was 5 °C min−1). Ultimately, a solid was obtained and collected and sieved using a 40–60 mesh to the obtain Mn6Zr1 catalyst.
Mn2Zr1, Mn4Zr1, and Mn8Zr1 were prepared in the same way as Mn6Zr1, except that the molar ratio of elements was different when the material precursor was added. The preparation methods for Mn6Zr1-300 °C, Mn6Zr1-500 °C, Mn6Zr1-600 °C, and Mn6Zr1-700 °C were the same as for Mn6Zr1, but the final calcination temperature was changed.
2.3 Catalytic performance test
The activity of the catalyst was evaluated and detected by using temperature-programmed technology, as shown in Fig. 1. Each test catalyst (0.2 g, 40–60 mesh) was placed in a fixed-bed quartz reactor (diameter = 9 mm, length = 60 cm) for the NH3-SCR activity evaluation test. The reaction conditions for traditional NH3-SCR denitration are as follows: 500 ppm NO, 500 ppm NH3, 5 vol% O2, 100–200 ppm SO2 (when used), 5 vol% H2O (when used), and N2 as the balance gas. The total flow rate of the gas was 500 mL min−1 controlled by mass flow controllers (Beijing Sevenstar Flow Co., Ltd, China). The gas hourly space velocity was set as 30000 h−1. The reaction temperature was 100–300 °C when the catalyst activity was tested. The concentration of NOx and NH3 before and after the reaction was directly measured online by a flue gas analyzer. The remaining unconverted gas was filtered by NaOH solution. Each temperature point was kept for 30 min, and the data were recorded in a stable numerical state. The NOx conversion rate formula is as follows:
 | (1) |
 | (2) |
 | ||
| Fig. 1 Catalytic activity evaluation device. | ||
The reaction rate of NH3-SCR can be truly reflected by the turnover frequency (TOF), and the calculation formula for this is as follows:15,16
 | (3) |
The SCR activity of the catalyst can also be quantitatively expressed by a first-order rate constant (k), which can be calculated by the formula for NO conversion (x) as follows:16,17
 | (4) |
 | (5) |
2.4 Catalyst characterization
Fourier transform infrared spectroscopy (FTIR) was used to determine the species on the catalyst surface in the range of 400–4000 cm−1 by infrared spectrometry (Nicolet iS5). Scanning electron microscope (SEM; Hitachi Company Japan) was used to analyze the morphology of the catalysts. Before the test, the sample was evenly smeared on the surface of the conductive adhesive, and then sprayed with gold. The N2 adsorption–desorption isotherms of the catalysts were determined on a Quantachrome Instrument (Quadrasorb EVO) with high-purity N2 as the adsorbent. Before each analysis, the catalysts were degassed in a vacuum at 300 °C for 3 h and the isotherms were measured in a liquid nitrogen N2 state (−196 °C). The X-ray diffraction (XRD) test was carried out with Cu Kα radiation (λ = 0.15418 nm) at 40 kV and 40 mA in an X-ray tube by using a Brook D8 Advance system (Germany). The scanning range was 10–80°. The speed was 6° min−1. The XPS tester used the Escalab 250XI spectrometer (Semer, Inc), operating under monochrome Al Kα radiation (1486.6 eV), 12 kV, and 15 mA ultra-high vacuum, and all the binding energies were calibrated by the C 1s peak at 284.4 eV. Temperature-programmed reduction of H2 (H2-TPR) and temperature-programmed desorption of NH3 (NH3-TPD) were performed on a Mac AutoChem II 2920 instrument (USA). The former was pretreated in 300 °C argon at a flow rate of 20 mL min−1 for 1 h and cooled to room temperature. The gas was converted into a mixture of 5 vol% H2–N2 at a flow rate of 30 mL min−1. After a straight baseline, the catalyst was heated from room temperature to 800 °C at a rate of 10 °C min−1. The latter was pretreated in 300 °C argon at a flow rate of 20 mL min−1 for 1 h and then cooled to room temperature. The samples were then exposed to a mixture of 5 vol% NH3–N2 for 1 h, and then purified with high-purity He at a flow rate of 20 mL min−1 to remove the physically adsorbed NH3. After the baseline was stabilized, the sample was heated from room temperature to 800 °C at a rate of 10 °C min−1.3 Results and discussion
3.1 Catalytic activity of MnxZr1 catalysts
The NOx conversion efficiency of the MnxZr1 series catalyst is shown in Fig. 2a and Table 1. It could be found that with the increase in the manganese element ratio, the catalyst activity increased first and then decreased. First, the Mn6Zr1 catalyst showed the best activity. The conversion efficiency reached more than 90% at 125–250 °C, while the highest conversion efficiency reached 97%. It had a good temperature window and excellent activity. Second, it is worth noting that the Mn8Zr1 catalyst showed the best activity at 100 °C, with the conversion efficiency reaching 95%, although the overall conversion efficiency decreased. A reasonable explanation for this is that while an appropriate ratio of manganese to zirconium can significantly improve the activity of the MnOx catalyst, too much manganese will mask the active sites on the surface of the catalyst, thus reducing the activity of the catalyst. | ||
| Fig. 2 (a) NOx conversion at different ratios of Mn/Zr, (b) N2 selectivity at different ratios of Mn/Zr, and (c) conversion rate of Mn6Zr1 at different calcination temperatures. | ||
| Temperature (°C) | NOx conversion (%) | ||||
|---|---|---|---|---|---|
| MnOx | Mn2Zr1 | Mn4Zr1 | Mn6Zr1 | Mn8Zr1 | |
| 100 | 40 | 67 | 78 | 87 | 94 |
| 125 | 68 | 86 | 88 | 96 | 94 |
| 150 | 82 | 94 | 96 | 97 | 94 |
| 175 | 86 | 94 | 96 | 97 | 94 |
| 200 | 89 | 94 | 96 | 97 | 94 |
| 225 | 87 | 91 | 92 | 94 | 90 |
| 250 | 80 | 83 | 85 | 91 | 81 |
| 275 | 73 | 75 | 78 | 83 | 72 |
| 300 | 67 | 65 | 70 | 75 | 62 |
The N2 selectivity of the MnxZr1 series catalyst is shown in Fig. 2b. The N2 selectivity of the catalysts decreased with increasing temperature. The main reason for this is that the by-products NOx and N2O were produced by NH3 oxidation.18 Mn2Zr1 had the lowest N2 selectivity and Mn6Zr1 had the best N2 selectivity. Such results are similar to the NOx conversion efficiency, and also indicated that Mn6Zr1 has a strong redox performance.19 The selectivity of N2 in MnOx was second only to Mn6Zr1, but the conversion efficiency of NOx was the lowest, which may be due to the weak redox capacity of MnOx, which produced less N2O.20
As is well known, the calcination temperature of a catalyst directly affects its SCR activity. Fig. 2c shows the NOx conversion of the Mn6Zr1 catalyst at different calcination temperatures (300–700 °C). The Mn6Zr1-300 °C catalyst only showed the best activity at 100–150 °C, which may be because of the calcination temperature and not being able to expose more active sites. When the calcination temperature was 400–700 °C, the NOx conversion decreased gradually. In conclusion, the Mn6Zr1 catalyst showed the best catalytic activity when the calcination temperature was 400 °C.
The tolerance of the Mn6Zr1 catalyst to SO2 and H2O in a flue gas atmosphere was simulated at 200 °C. The tolerance test results for 100 ppm and 200 ppm SO2 on the catalyst are shown in Fig. 3. When 100 ppm SO2 was introduced, the catalyst conversion rate gradually decreased, and finally stabilizes at 90% after 4 h. When introducing 200 ppm SO2, the NOx conversion rate of Mn6Zr1 decreased from 90% at 100 ppm to 82% at 200 ppm. This may be due to the formation of sulfate on the catalyst's surface by SO2, thus covering its active site. When SO2 was turned off, the NOx conversion rate recovered to 95%, indicating that the catalyst was reversible. However, the Mn6Zr1 catalyst did not fully recover to its previous levels, probably because the sulfate formed by the reaction of SO2 with NH3 or metal oxides was challenging to decompose at low temperatures, thus blocking some of the active or acidic sites of the catalyst, leading to a decrease in catalytic activity.21 When 5% H2O was added, the catalyst conversion efficiency of the catalyst decreased and stabilized at 92% after 8 h. Compared with the optimal conversion efficiency of 97%, it decreased by 5%. When the water vapor was turned off, the NOx conversion rate recovered to 96%, indicating that the catalyst was reversible, basically going back to the original conversion efficiency. In summary, the Mn6Zr1 catalyst showed good resistance to sulfur and water.
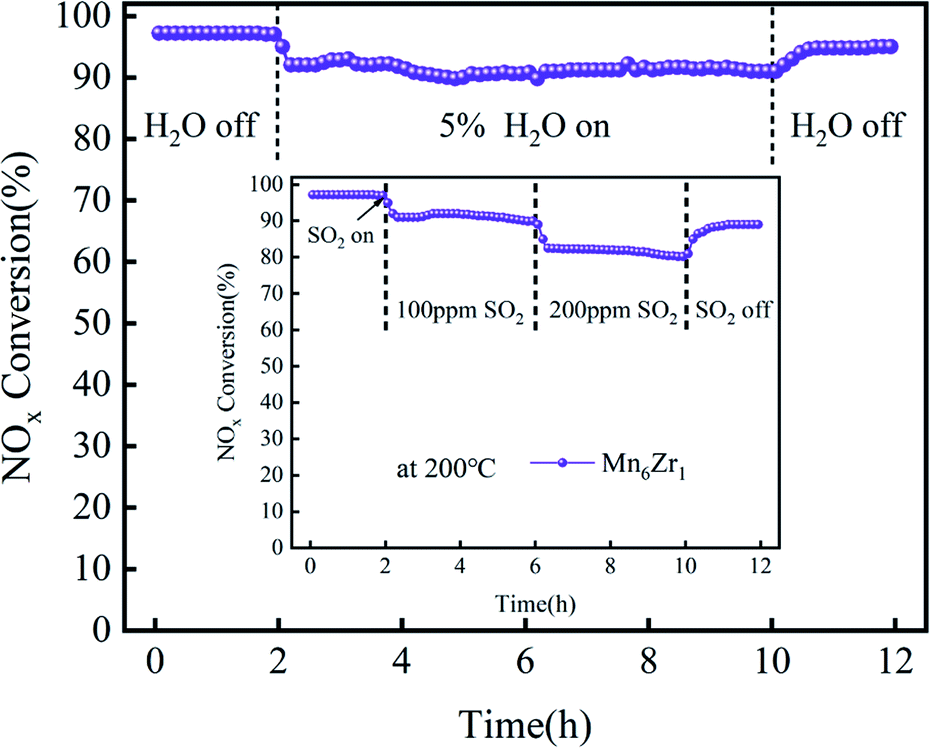 | ||
| Fig. 3 Resistance of the Mn6Zr1 catalyst to H2O and SO2 at 200 °C. | ||
As can be seen from Fig. 8 and Fig. 3 that Mn6Zr1 had good NOx removal ability, and excellent sulfur resistance and water resistance. Therefore, the anti-SO2 and anti-H2O properties of the Mn6Zr1 catalyst were further tested. As shown in Fig. 4, when 100 ppm SO2 (stage I) was introduced into the Mn6Zr1 catalyst, the conversion efficiency reached 92%. Further additions of 5% H2O (stage II) reduced the conversion efficiency to 85%, indicating that H2O inhibited the adsorption activity of NH3. When 200 ppm SO2 and 5% H2O (stage III) were introduced, the conversion efficiency of NOx reached 71% after 2 h of stability, which may be due to the formation of (NH3)2SO4 and (NH3)2SO3 by-products on the catalyst's surface, resulting in a decrease in catalytic activity.14 When SO2 was turned off (stage IV), the conversion efficiency increased gradually and then remained at 82%. This may be because the H2O washed away the by-products on the catalyst's surface, releasing some of the active sites. The NOx conversion efficiency reached about 90% when H2O was turned off (stage V). These results show that the adsorption of SO2, H2O, and reaction gas on the surface is competitive and the deactivation is reversible.
 | ||
| Fig. 4 NH3-SCR activity of Mn6Zr1-400 °C in the presence of SO2 and H2O at 200 °C. | ||
3.2 Characterization of the MnxZr1 catalysts
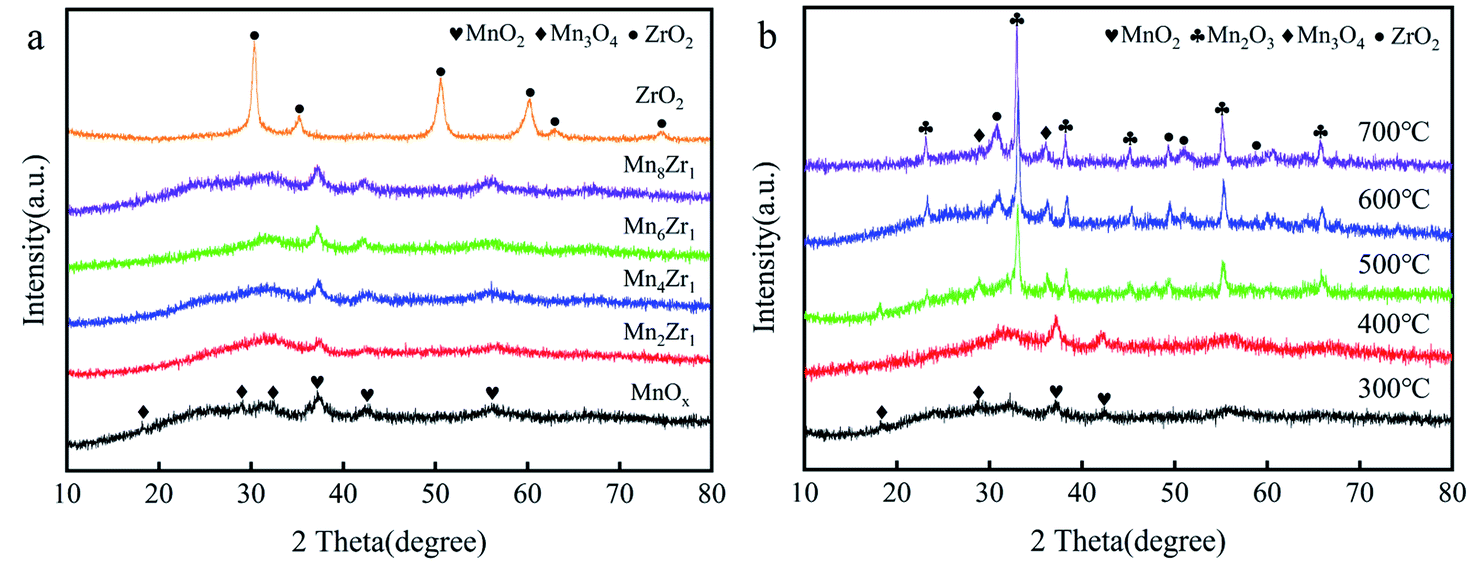 | ||
| Fig. 5 (a) XRD patterns of MnxZr1 catalysts and (b) XRD patterns of Mn6Zr1 catalysts calcined at different temperatures. | ||
Fig. 5b shows the diffraction spectrum of the Mn6Zr1 catalyst at 300–700 °C. When the calcination temperature of the catalyst increased, the diffraction peak of the catalyst became more apparent, and the diffraction peak of ZrO2 (PDF#50-1089) appeared. The crystal structure of the catalyst will be formed at a higher calcination temperature, which will inhibit the activity of the catalyst. This is also why the catalyst activity was poor when the calcination temperature was 500 °C or above. When the calcination temperature was 300 °C and 400 °C, the crystallinity of the Mn6Zr1 catalyst was poor, which is conducive to enhancing the activity of the catalyst. Besides, when the calcination temperature was 400 °C, the diffraction peak of the Mn6Zr1 catalyst was wide and weak in the 2θ range of 25–35°, and seemed to be a mixed oxide of Mn2O3 and Mn3O4. Moreover, the vast peak structure contributed to the adsorption/desorption of the catalyst surface and the redox reaction.23
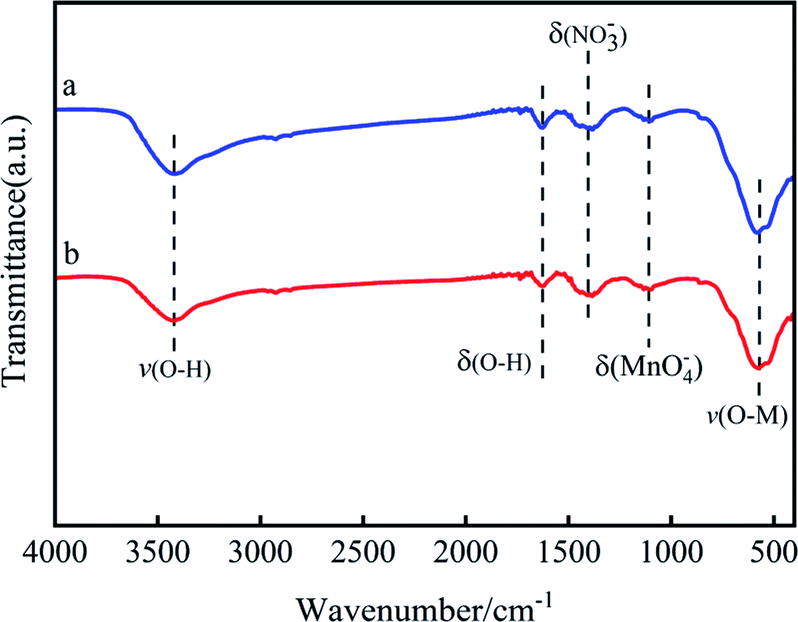 | ||
| Fig. 6 FTIR spectra of (a) MnOx, (b) Mn6Zr1. | ||
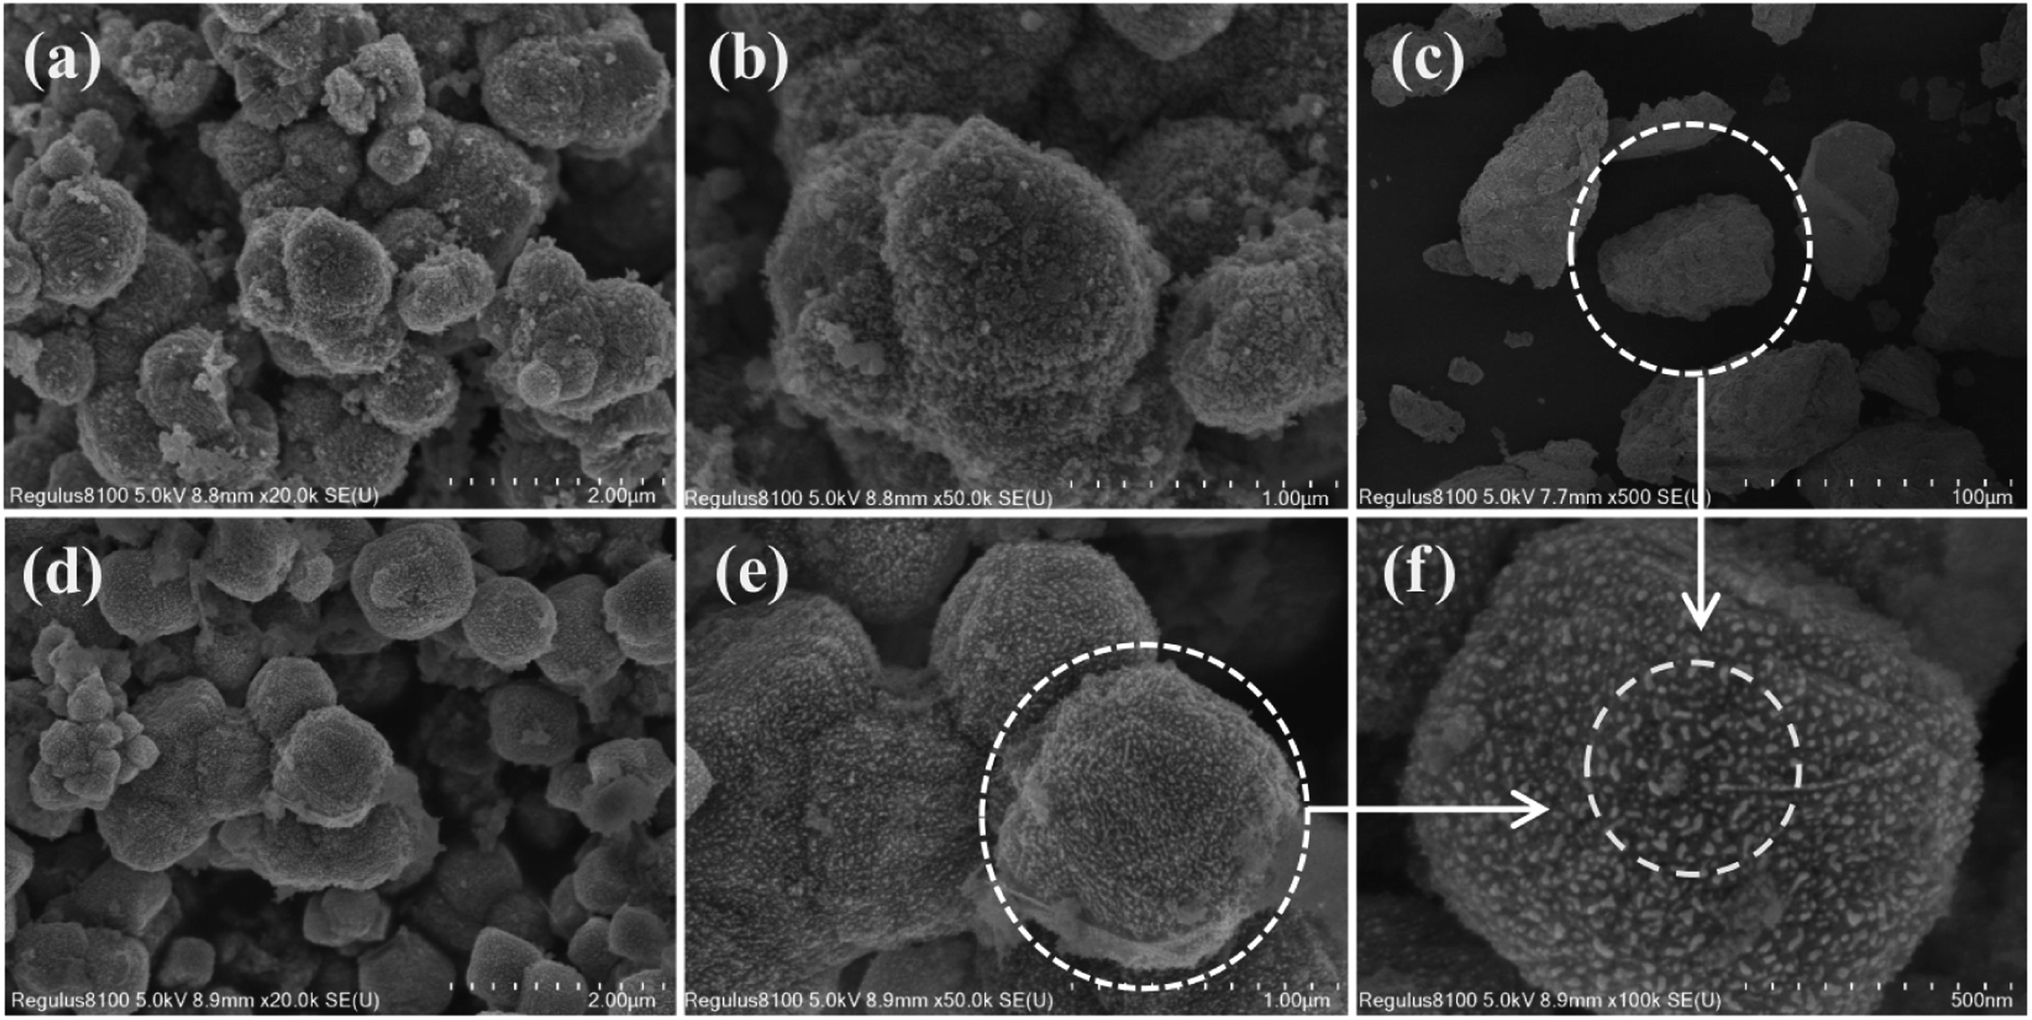 | ||
| Fig. 7 SEM images of (a and b) MnOx, (c) ZrO2, and (d–f) Mn6Zr1. | ||
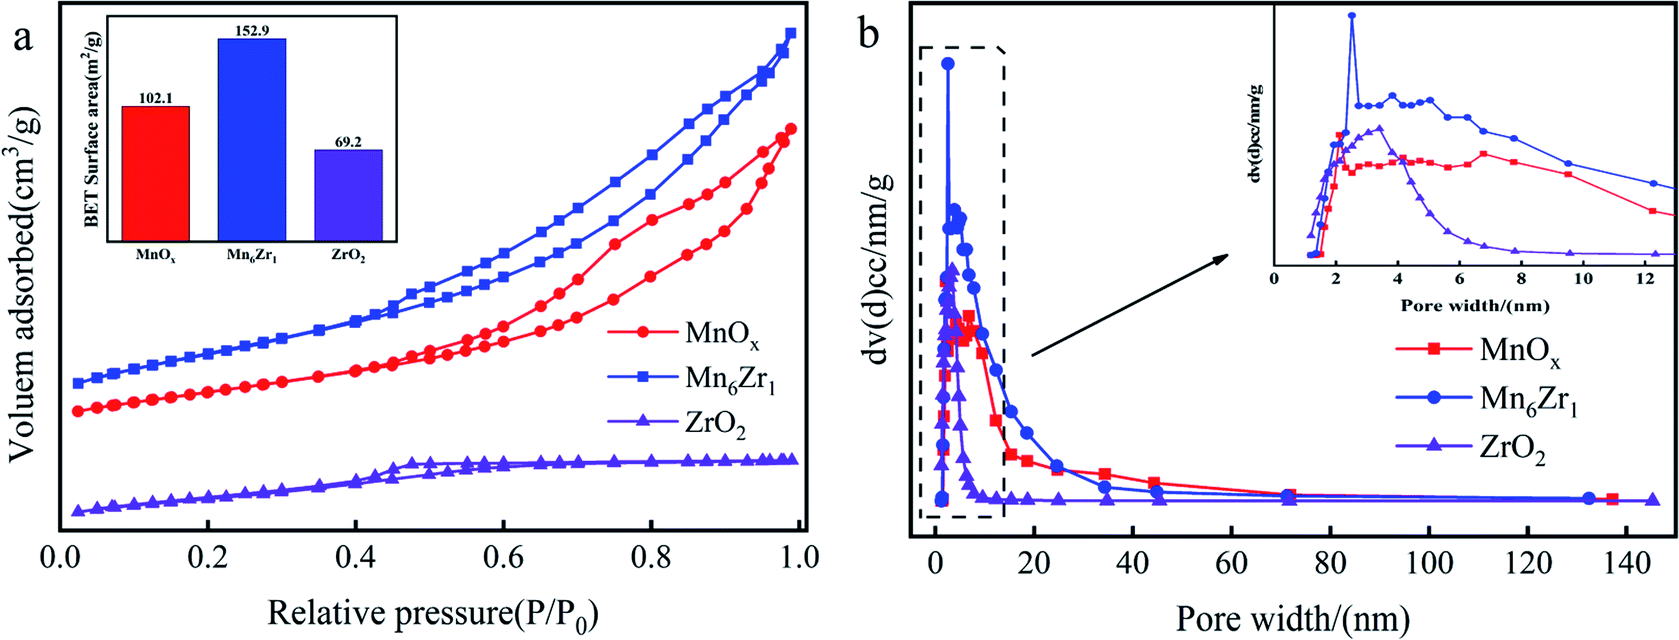 | ||
| Fig. 8 N2 adsorption isotherms (a) and pore-size distributions (b) of MnOx, ZrO2, and Mn6Zr1. | ||
| Samples | Surface area (m2 g−1) | Pore volume (cm3 g−1) | Average pore diameter (nm) |
|---|---|---|---|
| MnOx | 102 | 0.22 | 2.1 |
| ZrO2 | 69 | 0.05 | 3.4 |
| Mn6Zr1 | 153 | 0.28 | 2.5 |
Fig. 8b shows the pore-size distribution of the catalysts. The results showed a peak at about 2 nm for MnOx and Mn6Zr1 catalysts, and a broad peak at 3–7 nm for all three catalysts, indicating that the samples were dominated by intermediate pores and supplemented by micropores. There were many intermediate pores in the catalyst, which are conducive to NOx removal and thus show good catalytic activity.30 From Table 1, the specific surface area and pore volume of the manganese-based catalyst were significantly improved by adding zirconium. The specific surface area and pore volume of the Mn6Zr1 catalyst were increased to 153 m2 g−1 and 0.28 cm3 g−1, respectively. The higher specific surface area can better adsorb reactants, hence promoting the activity of the catalyst. Furthermore, the pore size of the Mn6Zr1 catalyst was increased to 2.5 nm, making it easier for the reaction gas to pass through the catalyst.
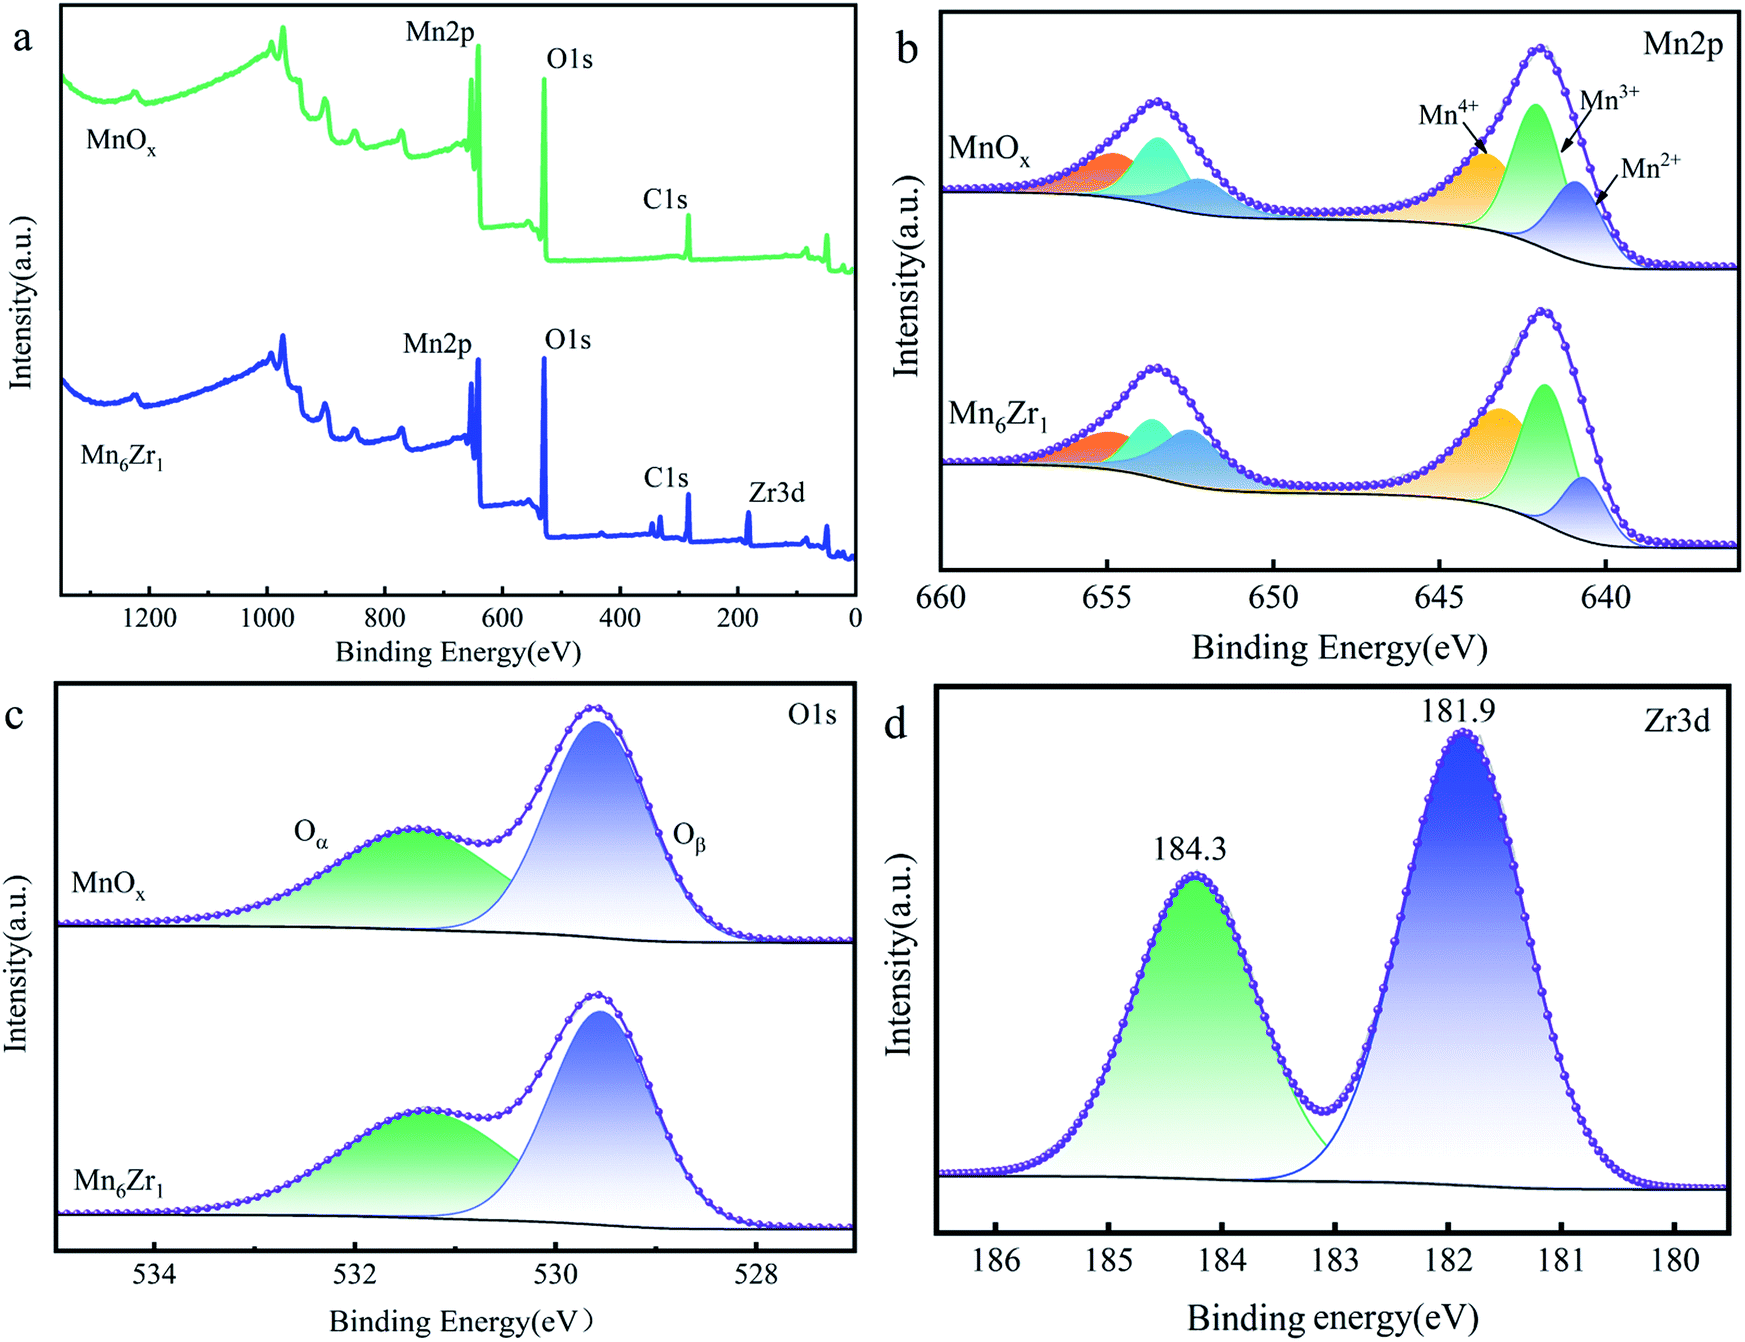 | ||
| Fig. 9 XPS spectra of (a) the survey, (b) Mn 2p, (c) O 1s, and (d) Zr 3d of the MnOx and Mn6Zr1. | ||
| Samples | Atomic concentration (%) | Atomic radio (%) | Ea (kJ mol−1) | lnA |
|||||
|---|---|---|---|---|---|---|---|---|---|
| C | Mn | O | Zr | Mn3+/Mn | Mn4+/Mn | Oα/(Oα + Oβ) | |||
| MnOx | 27.96 | 22.37 | 49.67 | — | 36.89 | 42.41 | 46.92 | 38.96 | 11.78 |
| Mn6Zr1 | 29.95 | 18.07 | 49 | 2.98 | 34.32 | 46.54 | 47.94 | 19.59 | 6.92 |
The spectrum of O 1s is shown in Fig. 9c. The two fitting peaks of O 1s were at 529.8 and 531.5 eV, respectively. The former was for lattice oxygen Oβ; while the latter was denoted as adsorbed oxygen Oα.34 Table 2 shows that the Oα/(Oα + Oβ) value of the Mn6Zr1 catalyst was 47.94%, which was significantly higher than that of the MnOx catalyst. It is well known that Oα can promote the oxidation of NO to NO2 due to its high mobility and better oxidation capacity, hence speeding up the reaction rate of NH3-SCR.35
Fig. 9d presents the XPS spectrum of Zr3d. The binding energy of the Mn6Zr1 catalyst at Zr 3d5/2 was 181.9 eV. However, the binding energy of Zr 3d5/2 for pure ZrO2 was 182.1 eV 14. The binding energy here is higher than that of the catalyst Mn6Zr1, indicating an interaction between manganese and zirconium in the Mn6Zr1 catalyst. With the increase in the Zr–O coordination bond length, not only is the surface acidity of the catalyst changed, but also the adsorption property of the catalyst surface is affected 30.
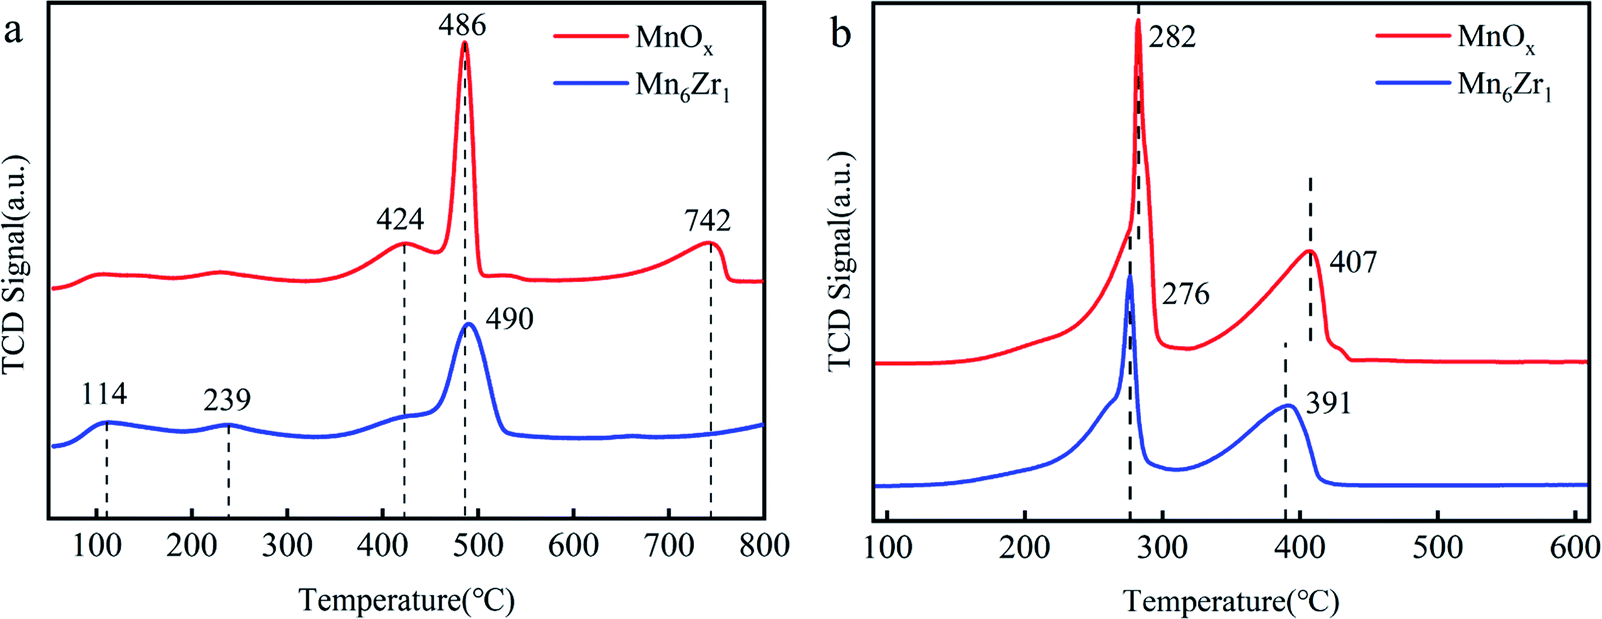 | ||
| Fig. 10 NH3-TPD (a) and H2-TPR (b) of MnOx and Mn6Zr1 catalysts. | ||
H2-TPR was used to evaluate the redox performance of each catalyst, as shown in Fig. 10b. Both MnOx and Mn6Zr1 catalysts displayed two reduction peaks. The reduction process of manganese-based catalysts usually follows three steps: Mn4+ → Mn3+ → Mn8/3+ → Mn2+.42,43 At 270–300 °C and 390–410 °C, both catalysts showed reduction peaks, attributed to the reduction of MnO2 to Mn2O3 and Mn2O3 to Mn3O4,42,44 respectively. It was found that the addition of zirconium reduced the reduction peak of the Mn6Zr1 catalyst. This indicated that the Mn6Zr1 catalyst had more vital redox capacity.45 This also explains the reason why the Mn6Zr1 catalyst had an excellent low-temperature denitration activity.
3.3 NH3-SCR kinetic studies
The turnover frequency (TOF) and the Arrhenius plots of the MnOx and Mn6Zr1 catalysts are shown in Fig. 11. As can be seen, the TOF value of the Mn6Zr1 catalyst was much larger than that of the MnOx catalyst at various temperature points, especially at 100–120 °C. The TOF value of the Mn6Zr1 catalyst was 2–3 times that of MnOx. This result intuitively shows that the Mn6Zr1 catalyst has excellent SCR performance, and is consistent with the excellent N2 selectivity. In addition, it can be seen from the Arrhenius figure that the MnOx catalyst had a high activation energy (38.96 kJ mol−1). The activation energy (19.59 kJ mol−1) of the Mn6Zr1 catalyst decreased significantly when zirconium was doped in the catalyst, which increased the reaction rate of the catalyst. According to the existing literature, the lower the activation energy of a catalyst, the higher the catalytic SCR activity.46 | ||
| Fig. 11 (a) TOF and (b) Arrhenius plots of MnOx and Mn6Zr1 catalysts at different temperatures. | ||
3.4 Discussion
The catalyst structure, surface acid–base properties, oxygen mobility, and the interactions between the active components all affect the activity of a catalyst. Zirconium doping into the MnOx catalyst can improve the activity of the catalyst, as well as the sulfur resistance and water resistance of the catalyst. In addition, the molar ratio of Mn/Zr also has a great influence on the catalyst. An excessive mole ratio may lead to surface blockage of the catalyst, while too small a molar ratio may lead to too few active sites, which will directly affect the activity of the catalyst. The calcination temperature also has a significant influence on the activity of the Mn6Zr1 catalyst: too high a calcination temperature tends to shrink the pore size and affect the gas entering the catalyst, thus inhibiting the absorption of the catalyst's active site.14 Therefore, the catalyst cannot perform SCR reaction better. The Mn6Zr1 catalyst exhibited a sizable specific surface area, pore volume, and pore size at 400 °C. These factors all affect the conversion efficiency of the catalyst. The larger specific surface area will increase the adsorption sites on the catalyst surface, such as Brønsted and Lewis acid sites. The wider aperture provides convenience for gas diffusion, abundant mesopores can provide the main channel for gas to enter the catalyst, and improve the contact between gas and the inner surface, and thus promote the denitrification activity of the catalyst. From the crystal image, the diffraction peak of the Mn6Zr1 catalyst was weak, indicating that MnOx and ZrO2 formed an amorphous structure or were well dispersed on the catalyst surface. This is also one of the essential reasons for the excellent denitration performance of the Mn6Zr1 catalyst. The interaction between ZrO2 and the active carrier will accelerate the oxidation rate of the catalyst and make the high-valence Mn easier to be reduced.30 This is also a reasonable explanation for why catalyst reduction shifts to the low-temperature region.The addition of zirconium increased the proportion of Mn4+ and decreased the proportion of Mn3+ in the Mn6Zr1 catalyst. The former mainly adsorbs NH3, while the latter tends to adsorb NO.47 When the sulfur resistance of the catalyst is measured at the optimal temperature, SO2 will be oxidized by MnOx to form sulfate, and Mn4+ will lose oxygen and convert to Mn3+.21 At this point, the relative content of Mn4+ will gradually decrease, and the adsorption of NH3 will also gradually decrease. This will inhibit the formation of NH4NO3 and hinder the cyclic reaction of low-temperature SCR. On the contrary, the unadsorbed NH3 will react with SO2 to form (NH4)2SO4, and the sulfate will precipitate on the surface of the catalyst, blocking the pores of the catalyst or covering the active sites on the catalyst surface, resulting in a decrease in the activity of the catalyst. More Mn4+ species will adsorb large amounts of NH3, which will inhibit sulfate formation. This also explains the excellent sulfur resistance of the Mn6Zr1 catalyst with a high proportion of Mn4+ species. In addition, the surface of the Mn6Zr1 catalyst contained a large amount of adsorbed oxygen Oα. The adsorbed oxygen Oα has better mobility and activity in the NH3-SCR denitration reaction.
Mn4+, Mn3+, and Mn2+ species exist simultaneously in the Mn6Zr1 catalyst. Lattice oxygen Oβ is first used in the process of NO removal by NH3-SCR. At this time, Mn4+ species in the Mn6Zr1 catalyst will lose oxygen and generate low-price Mn3+ and Mn2+. The Mn2+ species, on the other hand, tend to adsorb oxygen and convert it to lattice oxygen, thus forming an oxygen cycle: O2(g) ↔ O2(a) ↔ O2−(a) ↔ 2O−(a) ↔ 2O2−(lattice). The oxidation of NO is further promoted by the reversible adsorption/desorption cycle of lattice oxygen. Furthermore, the elimination of NO consists of two steps: (1) NO + O2 = NxOy, (2) NxOy + NH3 = N2 + H2O. NO is mainly bound to active oxides, including adsorbed oxygen Oα and lattice oxygen Oβ. The intermediate NxOy is cleaved to the N–H bond in adsorbed NH3, and H or NH3 is bound to the hydroxyl group on the surface to form NH4+. The number of acid centers on the catalyst surface and the types of Lewis and Brønsted acid centers also affect the adsorption of NH3. The zirconium-doped MnOx catalyst has an increased Brønsted acid level on its surface, thus enhancing the adsorption capacity for NH3 and promoting the activity of low-temperature SCR. For the Mn6Zr1 catalyst, amorphous ZrO2 and MnO2 are formed when the calcination temperature is 400 °C. Both oxides can promote the formation of nitrate and nitrite, and then react with adsorbed NH3 to generate NH4NO2 and NH4NO3, which can finally decompose into N2 and H2O (L–H mechanism).37,48 When one of the H atoms in NH3 is used, the resulting intermediate NH2 reacts with NO to form NH2NO, decomposing to form N2 and H2O (E-R mechanism).49,50 Based on the above analysis, a possible reaction mechanism of the Mn6Zr1 catalyst is summarized in Fig. 12. Mn6Zr1 had the highest desorption capacity for NH3, and its surface had the most vital adsorption capacity for NH3. This contributes to the dehydrogenation and activation of NH3, promotes the process of E–R and L–H, and improves its catalytic performance.
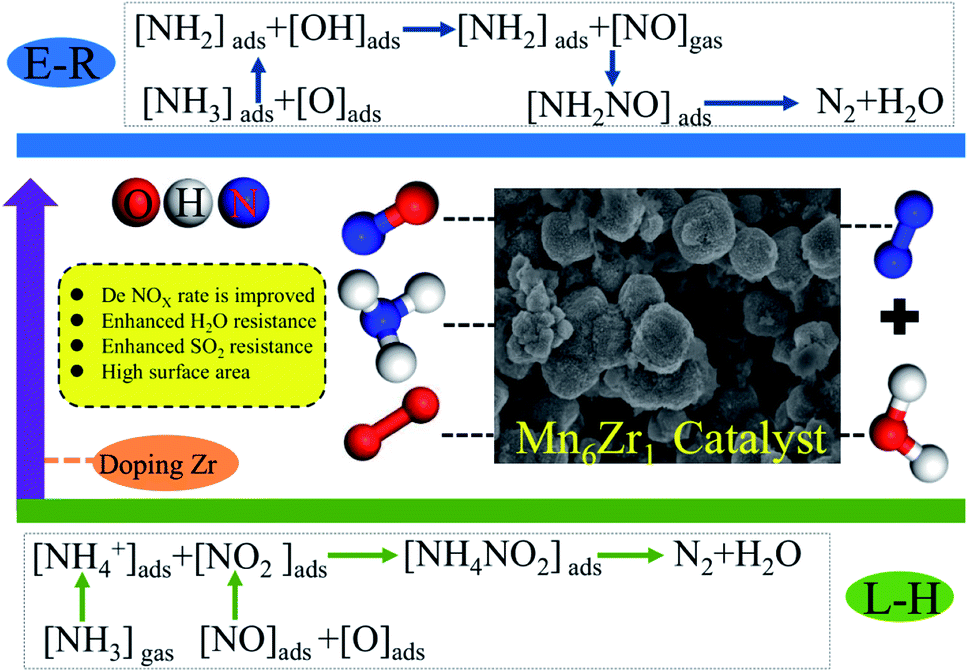 | ||
| Fig. 12 NH3-SCR reaction mechanism of the Mn6Zr1 catalyst. | ||
4. Conclusions
In this work, MnxZr1 series catalysts were prepared by a coprecipitation method, and the influence of zirconium-doped MnOx catalysts on their SCR activity was studied. The results show that the Mn6Zr1 catalyst had the best catalytic activity when the molar ratio of Mn/Zr was 6:1, and the calcination temperature was 400 °C. Under the condition of 125–250 °C, the NOx conversion rate could reach more than 90%, and the optimal conversion efficiency could reach 97%. Its resistance to SO2 and H2O was measured at optimum temperature, and it showed good resistance to sulfur and water. Meanwhile, the doping of zirconium into the MnOx catalyst enhanced its physical properties, such as increasing the specific surface area, pore size, and pore volume of the catalyst. Moreover, the contents of MnO2 species and Oα on the catalyst surface increased. The results of NH3-TPD and H2-TPR showed that zirconium doping also changed the acid properties of the catalyst and enhanced the redox performance of the catalyst, which is the main reason for the excellent activity of the catalyst. In summary, zirconium was successfully doped into the MnOx catalyst, and the catalytic performance of the catalyst was significantly improved.
Conflicts of interest
All authors declare they have no conflict of interest to disclose in the context of this study.Acknowledgements
This work was supported by the National Natural Science Foundation of China (U1504217, 51676064, 51306046) and the Innovative Research Team of Henan Polytechnic University (T2020-3).References
- X. Hu, Q. Shi, H. Zhang, P. Wang, S. Zhan and Y. Li, Catal. Today, 2017, 297, 17–26 CrossRef CAS.
- Y. Zhang, Y. Zheng, X. Wang and X. Lu, Catal. Commun., 2015, 62, 57–61 CrossRef CAS.
- D. W. Kwon, K. H. Park and S. C. Hong, Chem. Eng. J., 2016, 284, 315–324 CrossRef CAS.
- G. Hu, J. Yang, Y. Tian, B. Kong, Q. Liu, S. Ren, J. Li and M. Kong, Mater. Res. Bull., 2018, 104, 112–118 CrossRef CAS.
- A. Shi, X. Wang, T. Yu and M. Shen, Appl. Catal., B, 2011, 106, 359–369 CrossRef CAS.
- Q. Jin, Y. Shen, C. Mei, Y. Zhang and Y. Zeng, Catal. Today, 2020, 5, 1–11 Search PubMed.
- H. Jiang, C. Wang, H. Wang and M. Zhang, Mater. Lett., 2016, 168, 17–19 CrossRef CAS.
- M. Casapu, O. Kröcher and M. Elsener, Appl. Catal., B, 2009, 88, 413–419 CrossRef CAS.
- F. Gao, X. Tang, H. Yi, S. Zhao, J. Wang, Y. Shi and X. Meng, Appl. Surf. Sci., 2018, 443, 103–113 CrossRef CAS.
- X. Wang, S. Wu, W. Zou, S. Yu, K. Gui and L. Dong, Chin. J. Catal., 2016, 37, 1314–1323 CrossRef CAS.
- S. Gao, X. Chen, H. Wang, J. Mo, Z. Wu, Y. Liu and X. Weng, J. Colloid Interface Sci., 2013, 394, 515–521 CrossRef CAS PubMed.
- M. Kantcheva, I. Cayirtepe, A. Naydenov and G. Ivanov, Catal. Today, 2011, 176, 437–440 CrossRef CAS.
- S. Chen, Q. Yan, C. Zhang and Q. Wang, Catal. Today, 2019, 327, 81–89 CrossRef CAS.
- N. Fang, J. Guo, S. Shu, H. Luo, J. Li and Y. Chu, J. Taiwan Inst. Chem. Eng., 2018, 93, 277–288 CrossRef CAS.
- J. Ji, M. Jing, X. Wang, W. Tan, K. Guo, L. Li, X. Wang, W. Song, L. Cheng, J. Sun, W. Song, C. Tang, J. Liu and L. Dong, J. Catal., 2021, 399, 212–223 CrossRef CAS.
- H. Jiang, B. Guan, X. Peng, R. Zhan, H. Lin and Z. Huang, Chem. Eng. J., 2020, 379, 1–15 CrossRef.
- F. Gao, E. D. Walter, M. Kollar, Y. Wang, J. Szanyi and C. H. F. Peden, J. Catal., 2014, 319, 1–14 CrossRef CAS.
- L. Ma, C. Y. Seo, M. Nahata, X. Chen, J. Li and J. W. Schwank, Appl. Catal., B, 2018, 232, 246–259 CrossRef CAS.
- X. Wu, Y. Feng, X. Liu, L. Liu, Y. Du and Z. Li, Appl. Surf. Sci., 2019, 495, 1–13 Search PubMed.
- X. Tang, C. Wang, F. Gao, Y. Ma, H. Yi, S. Zhao and Y. Zhou, J. Environ. Chem. Eng., 2020, 8, 1–10 Search PubMed.
- B. Jia, J. Guo, H. Luo, S. Shu, N. Fang and J. Li, Appl. Catal., A, 2018, 553, 82–90 CrossRef CAS.
- P. Gong, J. Xie, D. Fang, F. He, F. Li and K. Qi, Appl. Surf. Sci., 2020, 505, 1–9 CrossRef.
- X. Tang, J. Hao, W. Xu and J. Li, Catal. Commun., 2007, 8, 329–334 CrossRef CAS.
- Q. H. Yan, S. N. Chen, L. Qiu, Y. S. Gao, D. O'Hare and Q. Wang, Dalton Trans., 2018, 47, 2992–3004 RSC.
- H. Li, G. Zhu, Z. Yang, Z. Wang and Z. H. Liu, J. Colloid Interface Sci., 2010, 345, 228–233 CrossRef CAS PubMed.
- C. Yang, L. Liao, G. Lv, L. Wu, L. Mei and Z. Li, J. Colloid Interface Sci., 2016, 479, 115–120 CrossRef CAS PubMed.
- P. Zhang, G. R. Qian, H. F. Cheng, J. Yang, H. S. Shi and R. L. Frost, Spectrochim Acta A, 2011, 79, 548–553 CrossRef CAS PubMed.
- Y. S. Shen, Y. F. Ma and S. M. Zhu, Catal. Sci. Technol., 2012, 2, 589–599 RSC.
- Q. Liu, J. J. Gao, F. N. Gu, X. P. Lu, Y. J. Liu, H. F. Li, Z. Y. Zhong, B. Liu, G. W. Xu and F. B. Su, J. Catal., 2015, 326, 127–138 CrossRef CAS.
- N. J. Fang, J. X. Guo, S. Shu, H. D. Luo, Y. H. Chu and J. J. Li, Chem. Eng. J., 2017, 325, 114–123 CrossRef CAS.
- X. Y. Du, C. T. Li, L. K. Zhao, J. Zhang, L. Gao, J. J. Sheng, Y. Y. Yi, J. Q. Chen and G. M. Zeng, Appl. Catal., B, 2018, 232, 37–48 CrossRef CAS.
- B. X. Shen, F. M. Wang and T. Liu, Powder Technol., 2014, 253, 152–157 CrossRef CAS.
- R. Wang, Z. Hao, Y. Li, G. Liu, H. Zhang, H. Wang, Y. Xia and S. Zhan, Appl. Catal., B, 2019, 258, 1–9 Search PubMed.
- S. Chen, M. A. Vasiliades, Q. Yan, G. Yang, X. Du, C. Zhang, Y. Li, T. Zhu, Q. Wang and A. M. Efstathiou, Appl. Catal., B, 2020, 277, 1–19 Search PubMed.
- J. Liu, X. Li, Q. Zhao, J. Ke, H. Xiao, X. Lv, S. Liu, M. Tadé and S. Wang, Appl. Catal., B, 2017, 200, 297–308 CrossRef CAS.
- H. Xu, Y. Wang, Y. Cao, Z. Fang, T. Lin, M. Gong and Y. Chen, Chem. Eng. J., 2014, 240, 62–73 CrossRef CAS.
- J. Li, J. Guo, X. Shi, X. Wen, Y. Chu and S. Yuan, Appl. Surf. Sci., 2020, 534, 1–13 Search PubMed.
- Z. Yan, J. Yang, X. Ge, J. Yu, L. Wei, T. Yang, B. He, X. Wang and L. Liu, Appl. Surf. Sci., 2019, 491, 579–589 CrossRef CAS.
- T. Zhang, J. Liu, D. Wang, Z. Zhao, Y. Wei, K. Cheng, G. Jiang and A. Duan, Appl. Catal., B, 2014, 148–149, 520–531 CrossRef CAS.
- P. Wang, D. Yu, L. Zhang, Y. Ren, M. Jin and L. Lei, Appl. Catal., A, 2020, 607, 117806 CrossRef CAS.
- X. Wu, Y. Feng, Y. Du, X. Liu, C. Zou and Z. Li, Appl. Surf. Sci., 2019, 467–468, 802–810 CrossRef CAS.
- D. Fang, J. Xie, H. Hu, H. Yang, F. He and Z. Fu, Chem. Eng. J., 2015, 271, 23–30 CrossRef CAS.
- Q. Yan, S. Chen, C. Zhang, Q. Wang and B. Louis, Appl. Catal., B, 2018, 238, 236–247 CrossRef CAS.
- E. Gao, G. Sun, W. Zhang, M. T. Bernards, Y. He, H. Pan and Y. Shi, Chem. Eng. J., 2020, 380, 1–12 Search PubMed.
- J. Gao, Y. Han, J. Mu, S. Wu, F. Tan, Y. Shi and X. Li, J. Colloid Interface Sci., 2018, 516, 254–262 CrossRef CAS PubMed.
- X. Wu, H. Meng, Y. Du, J. Liu, B. Hou and X. Xie, J. Catal., 2020, 384, 72–87 CrossRef CAS.
- B. Jia, J. Guo, S. Shu, N. Fang, J. Li and Y. Chu, Mol. Catal., 2017, 443, 25–37 CrossRef CAS.
- S. Xie, L. Li, L. Jin, Y. Wu, H. Liu, Q. Qin, X. Wei, J. Liu, L. Dong and B. Li, Appl. Surf. Sci., 2020, 515, 1–12 CrossRef.
- F. Gao, C. Yang, X. Tang, H. Yi and C. Wang, J. Environ. Sci., 2022, 113, 204–218 CrossRef PubMed.
- M. Guo, Q. Liu, C. Liu, X. Wang, Y. Bi, B. Fan, D. Ma, X. Liang and Z. Li, Chem. Eng. J., 2021, 413, 1–10 Search PubMed.
| This journal is © The Royal Society of Chemistry 2022 |