
 Open Access Article
 This Open Access Article is licensed under a Creative Commons Attribution-Non Commercial 3.0 Unported Licence
Laser-sintering fabrication of integrated Al/Ni anodes for lithium-ion batteries
Xue Zhang a,
Cunshan Wang*a,
Wenfei Yanga,
Dongdong Gaob,
Zhongyuan Zhanga and
Xinglong Donga
a,
Cunshan Wang*a,
Wenfei Yanga,
Dongdong Gaob,
Zhongyuan Zhanga and
Xinglong Donga
aKey Laboratory of Materials Modification by Laser, Ion and Electron Beams, Dalian University of Technology, Dalian 116023, P. R. China. E-mail: laser@dlut.edu.cn
bKey Laboratory of Ocean Energy Utilization, Dalian University of Technology, Dalian 116023, P. R. China
First published on 3rd May 2022
Abstract
Integrated Al/Ni electrodes of lithium-ion batteries (LIBs) with variant atomic ratios were successfully fabricated by a one-step laser-sintering process. The microstructure, phase composition, and pore structure were controlled by the raw material composition and laser parameters. The electrodes showed working merits without any conductive agent and binder, or even the collector used in a traditional battery. It was shown that the electrode consisted of multi-phases, i.e., Al, Al3Ni2, Al3Ni, and Ni, when the Al/Ni atomic ratio was higher than 5![[thin space (1/6-em)]](https://www.rsc.org/images/entities/char_2009.gif) :5. A lower Al/Ni atomic ratio less than 5:5 favored the formation of a dual-phase electrode consisting of Al3Ni2 and Ni. As the Al content increased, the specific surface area of the as-sintered electrodes increased in the initial stage and then decreased. The formation of pores was closely related to the content of the residual Al phase after the laser sintering. The residual Al phase filled the pores when the Al content was high, leading to a lower pore size. In contrast, the liquid Al phase completely reacted with the Ni component, leaving a large number of pores at its original sites. The linked pores can serve as transport channels for Li+ ions, provide mass sites for electrochemical reactions, and also buffer huge volume changes of the active material. Among the electrodes, the one with an Al/Ni ratio of 3:7 showed the best cycling/rate performance, i.e., a capacity of 522.8 mA h g−1 by a current of 0.1 A g−1 after 200 cycles, even holding to 338.4 mA h g−1 by a big current impact at 2 A g−1. It formed a metallurgical combination between the conductive network and the active material with multiple porous structures, which is helpful for the electrodes to provide high capacity and maintain structural stability during cycling. In addition, the average laser-sintering time of a single electrode was within 10 s, which is suitable for industrial mass production.
:5. A lower Al/Ni atomic ratio less than 5:5 favored the formation of a dual-phase electrode consisting of Al3Ni2 and Ni. As the Al content increased, the specific surface area of the as-sintered electrodes increased in the initial stage and then decreased. The formation of pores was closely related to the content of the residual Al phase after the laser sintering. The residual Al phase filled the pores when the Al content was high, leading to a lower pore size. In contrast, the liquid Al phase completely reacted with the Ni component, leaving a large number of pores at its original sites. The linked pores can serve as transport channels for Li+ ions, provide mass sites for electrochemical reactions, and also buffer huge volume changes of the active material. Among the electrodes, the one with an Al/Ni ratio of 3:7 showed the best cycling/rate performance, i.e., a capacity of 522.8 mA h g−1 by a current of 0.1 A g−1 after 200 cycles, even holding to 338.4 mA h g−1 by a big current impact at 2 A g−1. It formed a metallurgical combination between the conductive network and the active material with multiple porous structures, which is helpful for the electrodes to provide high capacity and maintain structural stability during cycling. In addition, the average laser-sintering time of a single electrode was within 10 s, which is suitable for industrial mass production.
1 Introduction
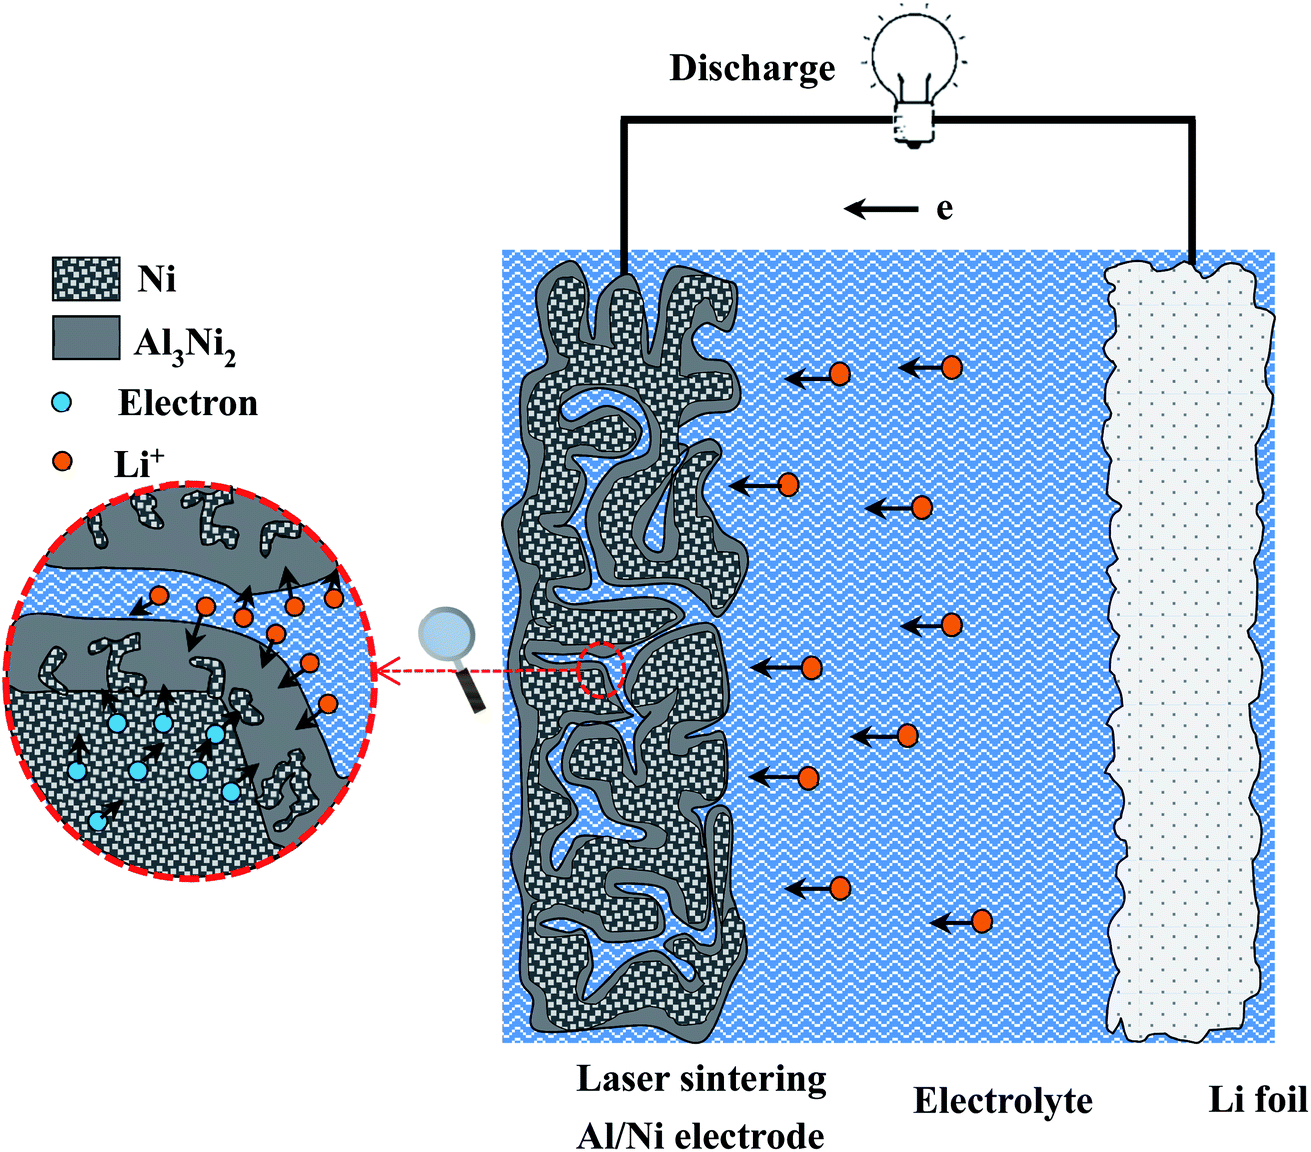
In recent years, with the increasing applications of portable electronics devices, electric/hybrid vehicles, and large-scale electricity grid storage, the demand for lithium-ion batteries (LIBs) with high energy/power densities is more urgent than ever before. Traditional carbon materials have good cycling performance, but they suffer from low capacity (375 mA h g−1), low reaction potential (0–0.25 V vs. Li+/Li), and safety issues caused by lithium dendrite growth.1–3 It is therefore desirable to develop new materials with high capacity and high cycling stability. It is well-known that electrochemically active materials, such as Si, Sn, Al, Ge, Sb, Bi, Pb,4–11 are accessible to be pulverized and fall off from the electrode due to great volume changes, leading to a serious degradation of the cycle performance. LiAl possesses a theoretical capacity of 993 mA h g−1, corresponding to a volume expansion of 97%.12,13 In addition, Al has the advantages of low density, high conductivity, abundant reserves, and low cost.14 As a possible substitute material for traditional carbon electrodes, Al and LiAl alloys have been studied extensively.13,15–17 However, the main obstacle to the development of Al anodes is still the issue of the large volume expansion. The stress caused by volume changes can effectively be alleviated by adding a host matrix of electrochemically inert materials (such as Fe, Co, Ni, Cu, Cr, Mn, P) or other active materials to form intermetallic compounds.7,14,17–19Intermetallic compounds have been explored as potential anode materials for lithium-ion batteries. The work mainly focuses on combining an active material and an inactive material. Al–Ni intermetallic compounds offer the advantages of a high yield strength, low ductility, and low elastic modulus. They can also reduce the tendency for active particle cracking and buffer large volume changes to maintain the electrode integrity and good electronic contact between the active particles and conductive phases. Al–Ni intermetallic compounds were fabricated and their Li+-diffusion properties tested in Machill and Rahner's work.20 The capability of the Al–Ni intermetallic compounds for lithium incorporation was found to be much higher than that of pure Al. It was also confirmed that the diffusion coefficient of Li+ in Al–Ni intermetallic compounds increases with the Ni content. Although the addition of Ni element to Al electrodes leads to a decline in the specific capacity and energy density, the improvement of the cycle performance can make up for the deficiency.
Intermetallic compounds used as electrode materials are mainly prepared by chemical synthesis,21–23 high-energy mechanical milling (HEMM),24–27 thermal sintering or heat treatment28,29 (often combined with the HEMM method), electrodepositing,30–32 chemical vapor deposition (CVD),33,34 etc. The preparation process is complex, and more importantly, the active materials are unevenly distributed, agglomerated, and even separated from the electrode during the charge/discharge process, which affects the cycling performance of the electrode. In addition, these methods for preparing intermetallic compounds have a number of disadvantages too, such as a long process flow, low efficiency, high cost, and high risk to the environment. To solve the above problems, a Sn/graphite anode was previously prepared by laser sintering,35 together with exploration of the effect of the laser parameters on the electrode structure and performance, which provides a foundation for preparing a composite electrode consisting of the active metal Al and inert metal Ni.
By preparing an integrated electrode, the metallurgical combination of a collector and active material is obtained without the need to use a conductive agent and binder, which leads to a higher mechanical strength and structural stability in the charge/discharge process. Herein, the phase constitution and structural characteristics of a laser-sintered Al/Ni electrode with different atomic ratios were explored. The formation mechanisms are also discussed through the theory of laser liquid-phase sintering. A porous integrated electrode supported by a Ni skeleton was successfully prepared. Such a porous structure inside can well act as the channels for Li+ diffusion, as well as buffer the volume expansion/contraction caused by the change/discharge processes. Moreover, the increased specific surface area of the active material provides more reaction sites for electrochemical reactions.
2 Experimental
Al/Ni electrodes with systematically varying atomic ratios from 9:1 to 1:9 were fabricated by laser sintering. First, raw powders of Al (99.9% purity, 10–20 μm) and Ni (99.9% purity, 20–100 μm) were blended by a vacuum ball grinder according to the required atomic ratio. Subsequently, the powder mixtures were compressed into a disc with a diameter of 14 mm and a height of 1 mm under 30 MPa pressure. Then, a 5 kW continuous wave CO2 laser unit with a wavelength of 10.6 μm was used as a heat-generating source for sintering the integrated anodes in an argon protection environment. Based on the preliminary experiments, the optimized laser processing parameters were set as follows: laser power 200 W, laser beam diameter 15 mm, laser irradiation time 20 s, and argon flow rate 7.0 L min−1.
The phase constitution of the laser-sintered specimens was identified using an XRD-6000 X-ray diffraction (XRD) system equipped with Ni filtered, Cu Kα radiation operating at 40 kV and 30 mA. X-ray photoelectron spectroscopy (XPS) analysis was performed on a Thermo ESCALAB XI+ device with an Al Kα (hv = 1486.6 eV) excitation source. The data analysis was performed using the Casa-XPS software with a Shirley background. The microstructural characteristics and composition were analyzed using a Zeiss Supra 55 scanning electron microscopy (SEM) system and EPMA-1720 electron probe microanalyzer (EPMA). To investigate the size distribution and structure feature of the pores in the laser-sintered specimens, nitrogen isotherm adsorption curves were measured using a Quadrasor-SI automatic specific surface area and porosity analyzer.
To measure the electrochemical performances, all the laser-sintered specimens were thinned down to 0.2 mm thickness through the use of successively finer silicon carbide grinding paper, and were assembled into CR2025-type half-cells in a glove box filled with argon gas. Lithium foils were used as the counter electrodes, while 1 mol L−1 LiPF6 was dissolved into ethylene carbonate (EC) and diethyl carbonate (DEC) (1:1 by volume) solution to act as the electrolyte. Cyclic voltammetry measurements were performed on a CHI660D electrochemical workstation at a scanning rate of 0.1 mV s−1 within the potential range of 0.01–2.00 V. Electrochemical impedance spectra were analyzed in the frequency range between 0.01 Hz and 100 kHz with a signal amplitude of 5 mV. Charge/discharge characteristics were measured using a Land CT2001A battery system at various current densities in the voltage range of 0.01–2.00 V.
3 Results and discussion
3.1 Microstructure
Fig. 1 shows the X-ray diffraction (XRD) patterns taken from the as-sintered Al/Ni electrodes and the enlarged spectrum of 23°–50°. When the Al/Ni atomic ratios were more than 5:5, the phase structure of the as-sintered electrodes consisted of Al, Ni, Al3Ni, and Al3Ni2 phases. The difference was that the content of the Al phase decreased with the decrease in the Al/Ni atomic ratio, while the Ni, Al3Ni, and Al3Ni2 phases showed a reverse trend with Al, as revealed in Table 1. When the Al/Ni atomic ratio decreased to less than 5:5, the diffraction peaks corresponding to Al and Al3Ni phases disappeared. Meanwhile, the content of the Ni phase continued to increase, and the content of the Al3Ni2 phase reached the maximum value of 40.4% at an Al/Ni atomic ratio of 3:7, and then decreased to 12.0% at the Al/Ni atomic ratio of 1:9.
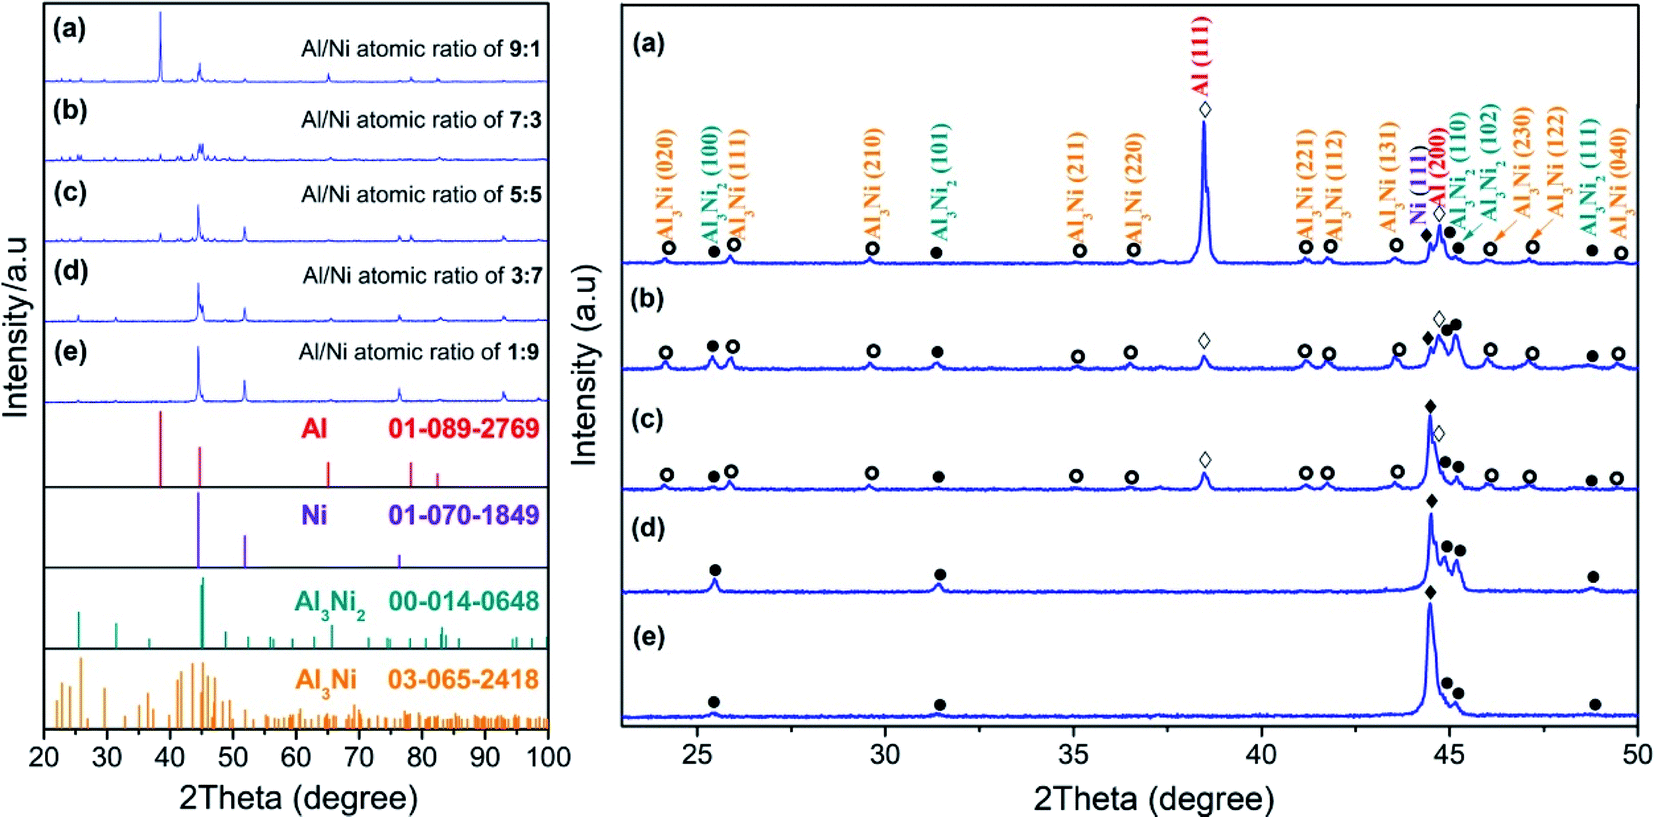 | ||
| Fig. 1 XRD patterns of the laser-sintered Al/Ni electrodes with different atomic ratios and the enlarged spectrum of 23°–50°. | ||
| Al/Ni atomic ratio | Al phase | Ni phase | Al3Ni phase | Al3Ni2 phase |
|---|---|---|---|---|
| 9:1 |
75.4 | 17.9 | 3.6 | 2.1 |
| 7:3 |
46.3 | 35.6 | 14.5 | 3.6 |
| 5:5 |
25.8 | 44.1 | 26.0 | 4.1 |
| 3:7 |
— | 59.6 | — | 40.4 |
| 1:9 |
— | 88.0 | — | 12.0 |
The element composition of the Al/Ni electrodes were further confirmed by the XPS profiles as shown in Fig. 2. In Fig. 2a, The Ni 2p level is split into Ni 2p3/2 and Ni 2p1/2 sublevels owing to the spin–orbit interaction. For electrodes made with the Al/Ni atomic ratio from 9:1 to 1:9, the peak heights of Ni 2P3/2 and Ni 2p1/2 increased gradually, the binding energies increased first and then decreased. As indicated by the dotted line in Fig. 2a, the Ni 2p3/2 and Ni 2p1/2 levels in Ni, Al3Ni2, and Al3Ni were 852.65, 853.40, 853.75 eV and 869.90, 870.70, 871.05 eV, respectively.36 Therefore, it could be determined that there were Ni, Al3Ni2, and Al3Ni phases in the electrodes, and their contents were reflected in the positions of the peaks. However, it was difficult to distinguish the energy level between Al3Ni2 and Al3Ni due to the small shift. Moreover, for the electrodes with the Al/Ni atomic ratios of 3:7 and 9:1, two shake-up satellites of Ni 2p could be observed, which may be due to the high Ni content. Fig. 2b shows the high-resolution spectra of the Al 2p core level of the as-sintered Al/Ni electrodes. In the spectra of the electrode with an Al/Ni atomic ratio of 9:1, four peaks appeared at binding energies of 67.21, 69.38, 70.98, and 75.25 eV, which corresponded to Ni 3p3/2, Ni 3p1/2, Al 2p, and Al2O3, respectively.37,38 With the decrease in Al content, the peak height of Al 2p decreased gradually, and when the atomic ratio of Al/Ni was 1:9, the peak could not be observed. The variation of the Al2O3 peak was the same as that of Al 2p. It is worth mentioning that the surface of Al can be easily oxidized. Due to the limited detection depth and resolution of XRD, there was no Al2O3 peak, but while the detection depth of XPS was only several nanometers, Al2O3 could be detected. The Ni 3p level was split into Ni 3p3/2 and Ni 3p1/2 sublevels, and the variation of the peak heights was consistent with that of the Ni content. The positions of these two peaks moved toward the direction of low binding energy when the Ni content increased.
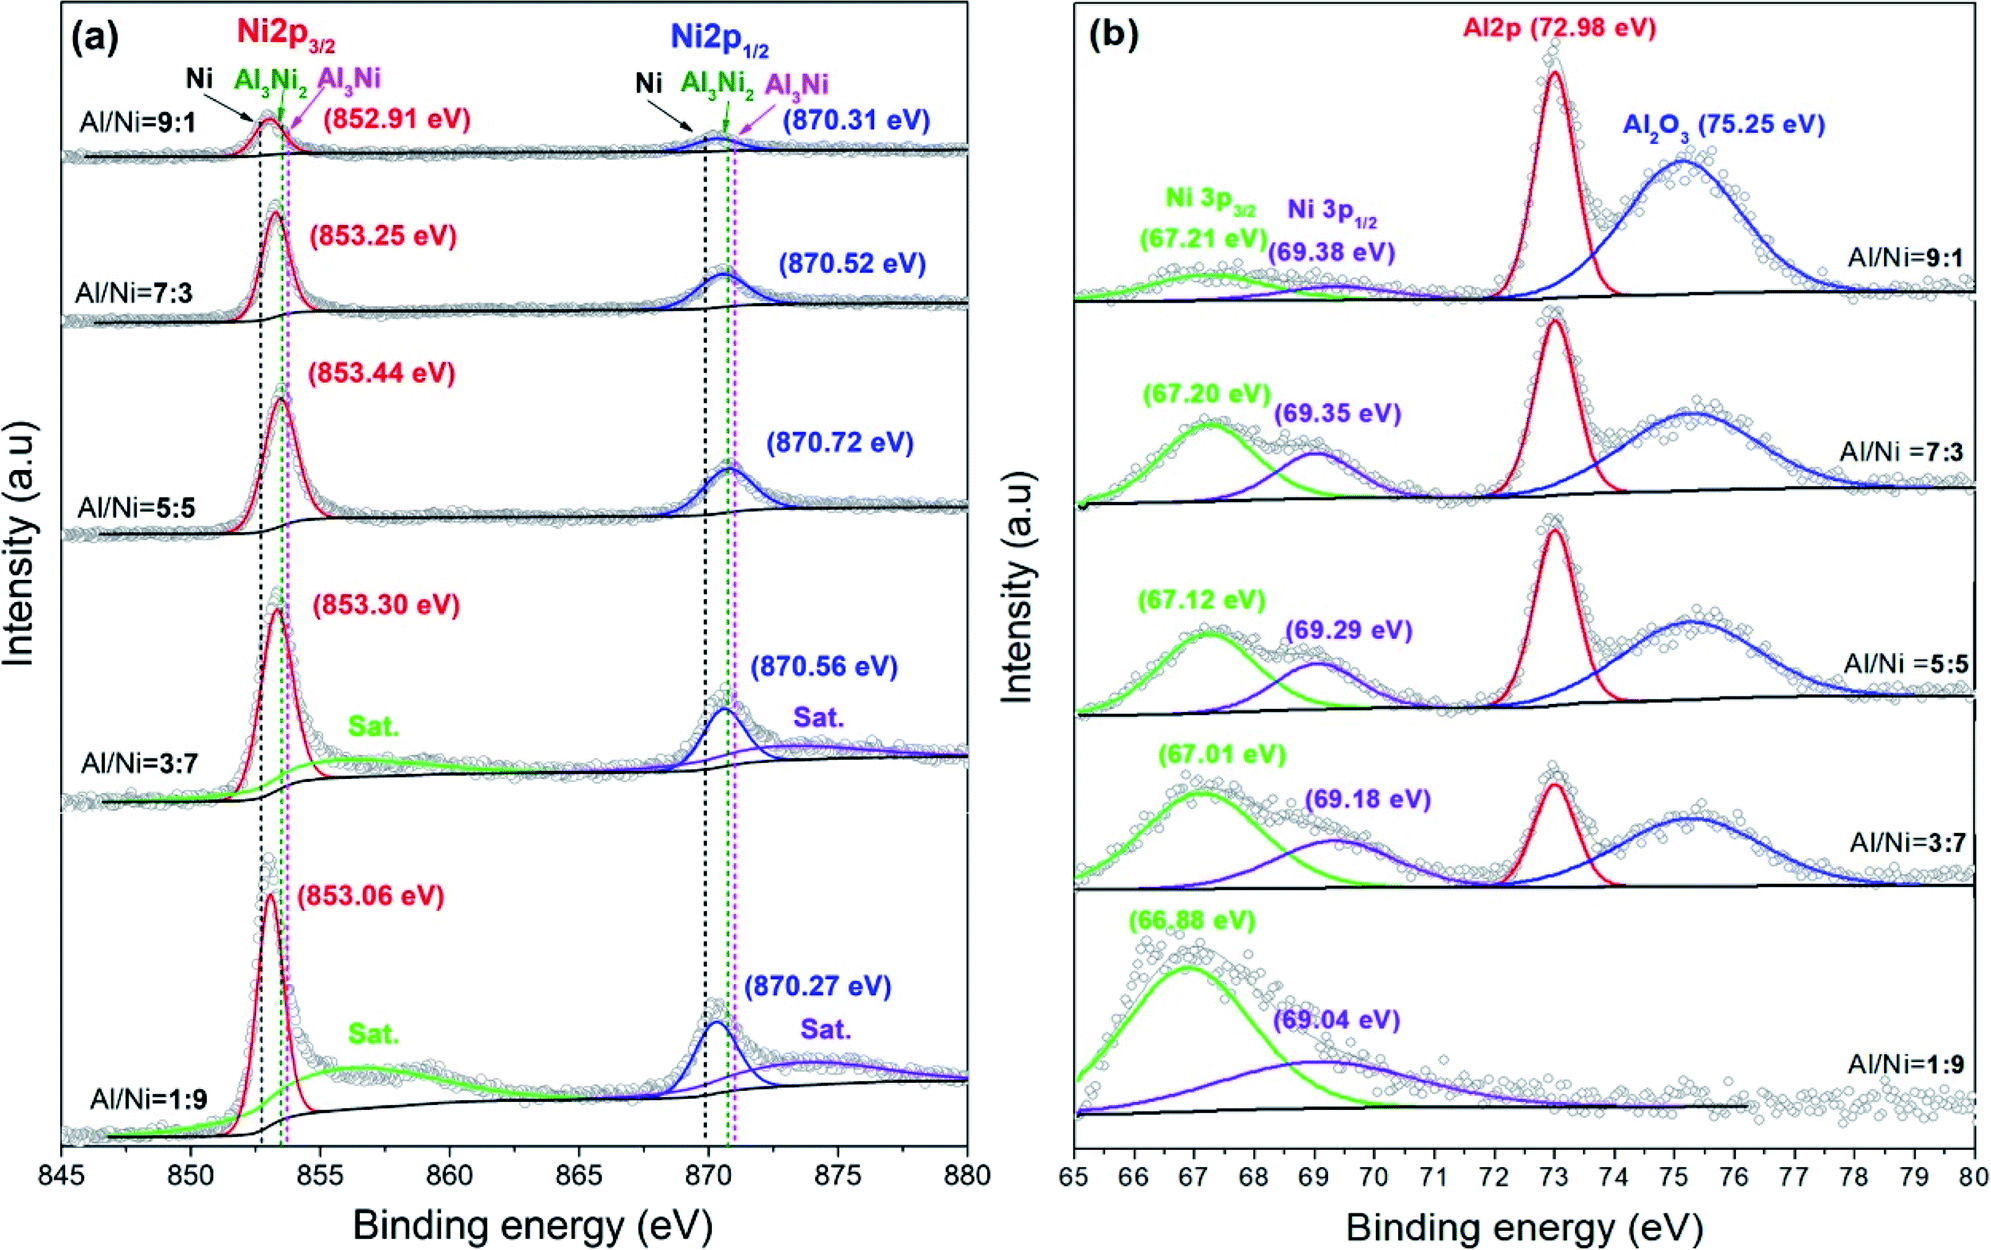 | ||
| Fig. 2 High-resolution XPS spectra of (a) the Al 2p and (b) Ni 2p orbitals for the electrodes with different Al/Ni atomic ratios. | ||
Fig. 3 presents typical SEM images of the as-sintered Al/Ni electrodes. The EPMA analysis results of the electrodes in different zones (marked A, B, C, etc. in Fig. 3) are shown in Table 2. For the electrode with the Al/Ni atomic ratio of 9:1, it was found that some block or columnar particles, together with a fewer bright particles, were embedded in a dark matrix. Moreover, a gray epitaxial growth layer around each bright particle was clearly visible (Fig. 3a). Combined with the XRD and EPMA data, these particles were assigned to Ni, Al3Ni, Al, and Al3Ni2 phases. Similar constituent phases were observed in the as-sintered electrode with the Al/Ni atomic ratio of 7:3. However, in that case the Al3Ni phase evolved into larger blocks that grow in the form of aggregates. Meanwhile, the bright Ni particles, together with their epitaxial growth layers, exhibited an obvious increase in the size and volume fraction (Fig. 3b). This variation trend became more pronounced when the Al/Ni atomic ratio was 5:5 (Fig. 3c). Furthermore, as the Al/Ni atomic ratio decreased to 3:7, the Ni particles became larger and irregular in shape (Fig. 3d). When the Al/Ni atomic ratio was 1:9, the Ni particles connected with each other to form a skeletal network with an increase in their fraction, while fewer Al3Ni2 matrix phases were maintained (Fig. 3e).
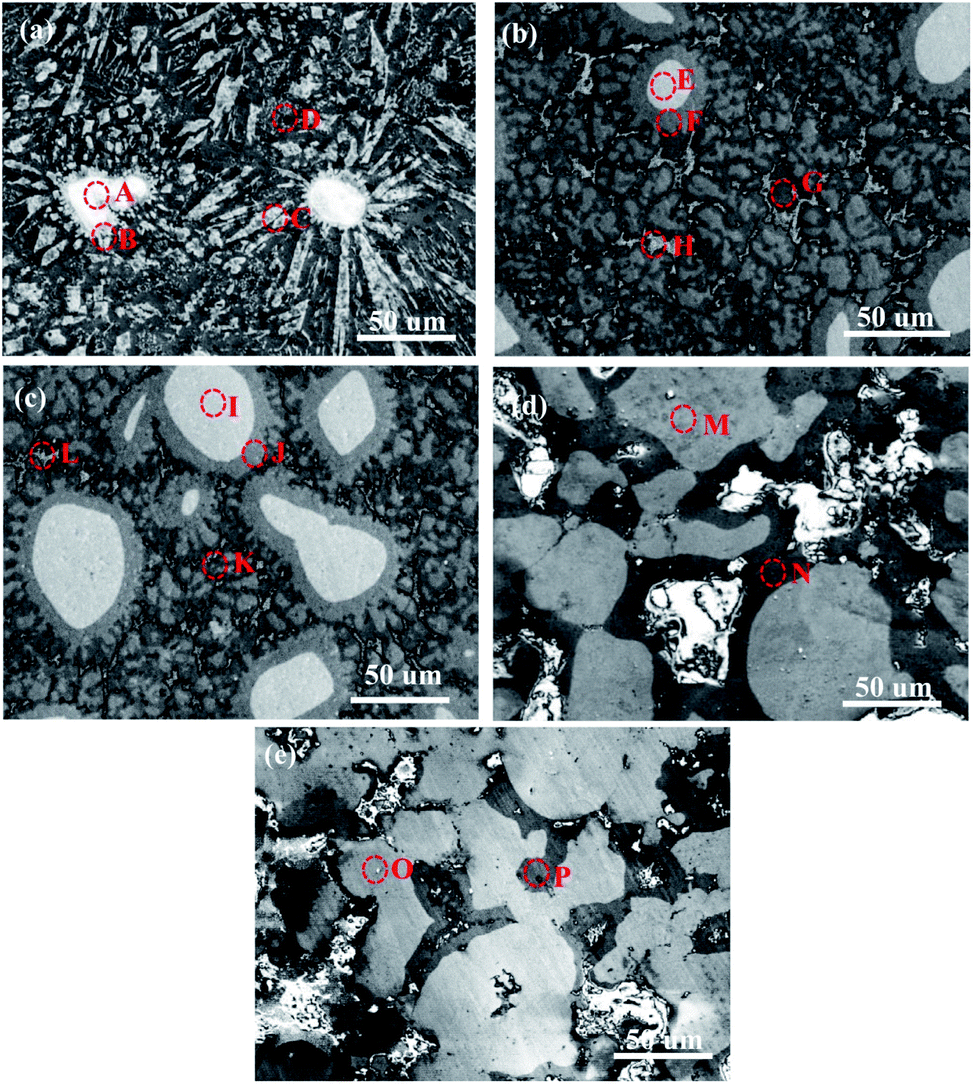 | ||
| Fig. 3 Typical SEM images of the as-sintered electrodes with different Al/Ni atomic ratios of: (a) 9:1, (b) 7:3, (c) 5:5, (d) 3:7, and (e) 1:9. | ||
| Electrodes with Al/Ni (at%) | Zone | Composition (at%) | Phase | |
|---|---|---|---|---|
| Al | Ni | |||
| 9:1 |
A | 2.28 | 97.72 | Ni |
| B | 61.58 | 38.42 | Al3Ni2 | |
| C | 72.81 | 27.19 | Al3Ni | |
| D | 98.94 | 1.06 | Al | |
| 7:3 |
E | 3.18 | 96.82 | Ni |
| F | 58.59 | 41.41 | Al3Ni2 | |
| G | 75.57 | 24.43 | Al3Ni | |
| H | 98.83 | 1.17 | Al | |
| 5:5 |
I | 2.90 | 97.10 | Ni |
| J | 63.36 | 36.64 | Al3Ni2 | |
| K | 72.50 | 27.50 | Al3Ni | |
| L | 97.87 | 2.13 | Al | |
| 3:7 |
M | 1.48 | 98.52 | Ni |
| N | 62.06 | 37.94 | Al3Ni2 | |
| 1:9 |
O | 2.29 | 97.71 | Ni |
| P | 61.81 | 38.19 | Al3Ni2 | |
Based on the above analyses, the microstructure evolution during the laser-sintering process is proposed. The sintering of electrodes with the Al/Ni atomic ratios more than 5:5 begins with the formation of Al liquid due to its low melting point, followed by the wetting and spreading of Al liquid over the Ni solid surface, so that the Ni particles are separated by a liquid bridge. The friction between the Ni particles is significantly reduced, which allows them to easily rearrange under the action of the compressive capillary stress exerted by the liquid. Once a liquid–solid interface is established, the Al liquid provides a path for matter transport, since diffusion in a liquid is much faster than in a solid. Rapid transport in the Al liquid causes the formation of a diffusion layer around the Ni particles, and induces a chemical reaction to form an Al3Ni2 phase within the layer. With epitaxial growth of the layer, some bulges are formed in the liquid–solid interface due to interfacial turbulence. Furthermore, a peritectic reaction occurs between the bulges and surrounding liquid to form an Al3Ni phase according to the Al–Ni phase diagram, which then separates from the epitaxial growth layer. Meanwhile, the size of the Ni particles gradually reduces due to the continuous diffusion reaction. Through this process, Ni particles become almost spheroidal in shape since the sharp angle of the particle has a higher solubility in a liquid than the flat places. As the content of the liquid is more than that required for peritectic transformation, residual liquid is produced after the transformation. As a result, a multiphase structure consisting of Ni, Al3Ni, Al, and Al3Ni2 phases is formed at the terminal stage of sintering. For the cases of the electrodes with Al/Ni atomic ratios less than 5:5, initially Al particles melt and then epitaxial diffusion layers form. However, there is insufficient remaining liquid to support the subsequent peritectic reaction, such that a dual-phase structure consisting of Ni and Al3Ni2 phases is obtained. In these cases, Ni particles take up a prismatic shape, and some of their contact regions become relatively flat. This is because the capillary stress leads to a higher chemical potential in these regions. Precipitation occurs at the sites away from the contact area. With a further decrease in the Al/Ni atomic ratio, the Ni particles connect with each other to form a skeletal network, which allows the particles to pack more efficiently. It is worth mentioning that the interface between the phases is a metallurgical combination, which greatly enhances the strength of the electrode. The influence of the metallurgical combination and pore structure can buffer the volume expansion and maintain the integrity of the electrodes in the charge/discharge process. This effect will be verified in the subsequent electrochemical results. The two typical processes are sketched in Fig. 4.
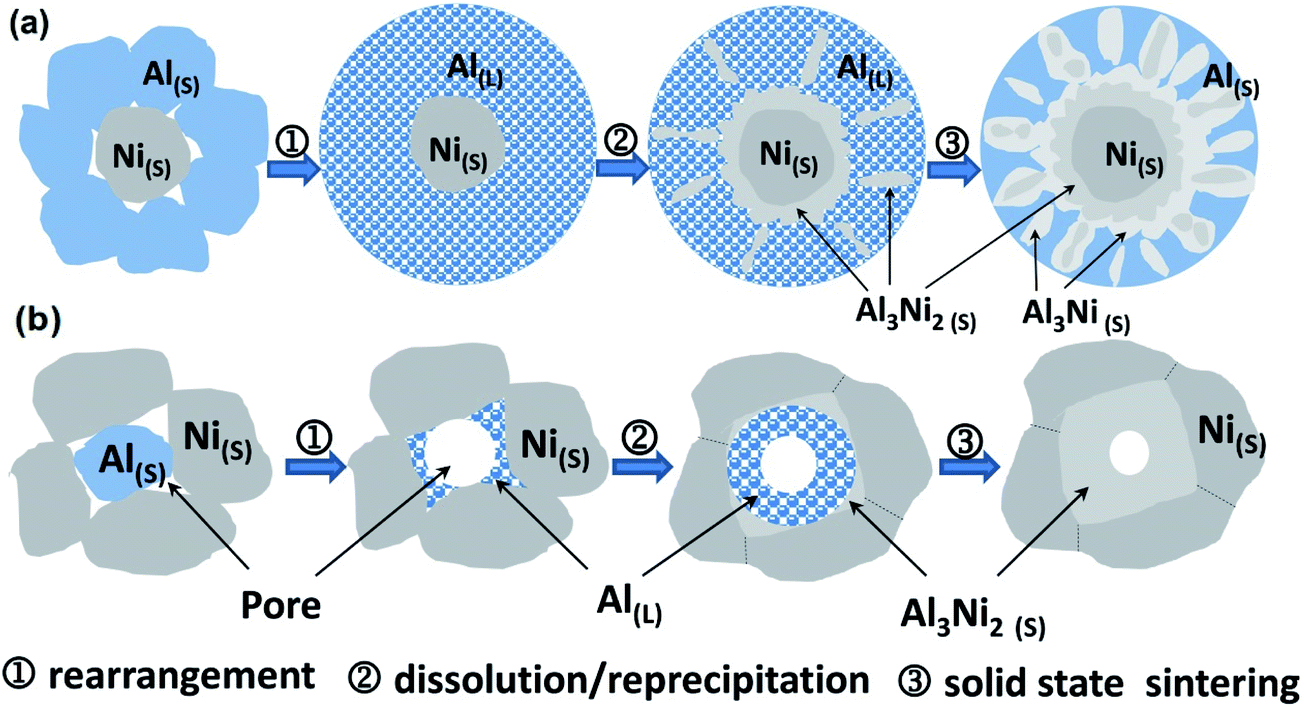 | ||
| Fig. 4 Schematic diagram of the microstructure evolution of the Al/Ni integrated electrodes with (a) Al/Ni atomic ratios more than 5:5 and (b) Al/Ni atomic ratios less than 5:5. | ||
3.2 Porosity and specific surface area
The specific surface area and pore-size distribution of the materials can be obtained from the nitrogen adsorption–desorption isotherms.39–41 Fig. 5a presents the nitrogen adsorption–desorption isotherms of the Al/Ni as-sintered electrodes. As shown in Fig. 5a, all the curves appeared similar and belonged to the type III isotherm according to the IUPAC (International Union of Pure and Applied Chemistry) classification, which indicates a weak interaction between adsorption and desorption.42,43 Correspondingly, the surface areas of the electrodes ranged from 7.1 to 112.4 m2 g−1 as the Al content decreased. For the Al/Ni atomic ratios of 3:7 and 1:9, the specific surface areas (112.4 m2 g−1 and 93.1 m2 g−1) were significantly higher than that of other electrodes. The nitrogen sorption increased gently at P/P0 < 0.9, corresponding to micro- and mesopores in the range of 1.0–6.5 nm for all the electrodes, as shown in Fig. 5b. The nitrogen sorption showed a great incensement at P/P0 > 0.95 for the electrodes with Al/Ni atomic ratios of 7:3 and 1:9, and the corresponding pore-size range was 11–25 nm.
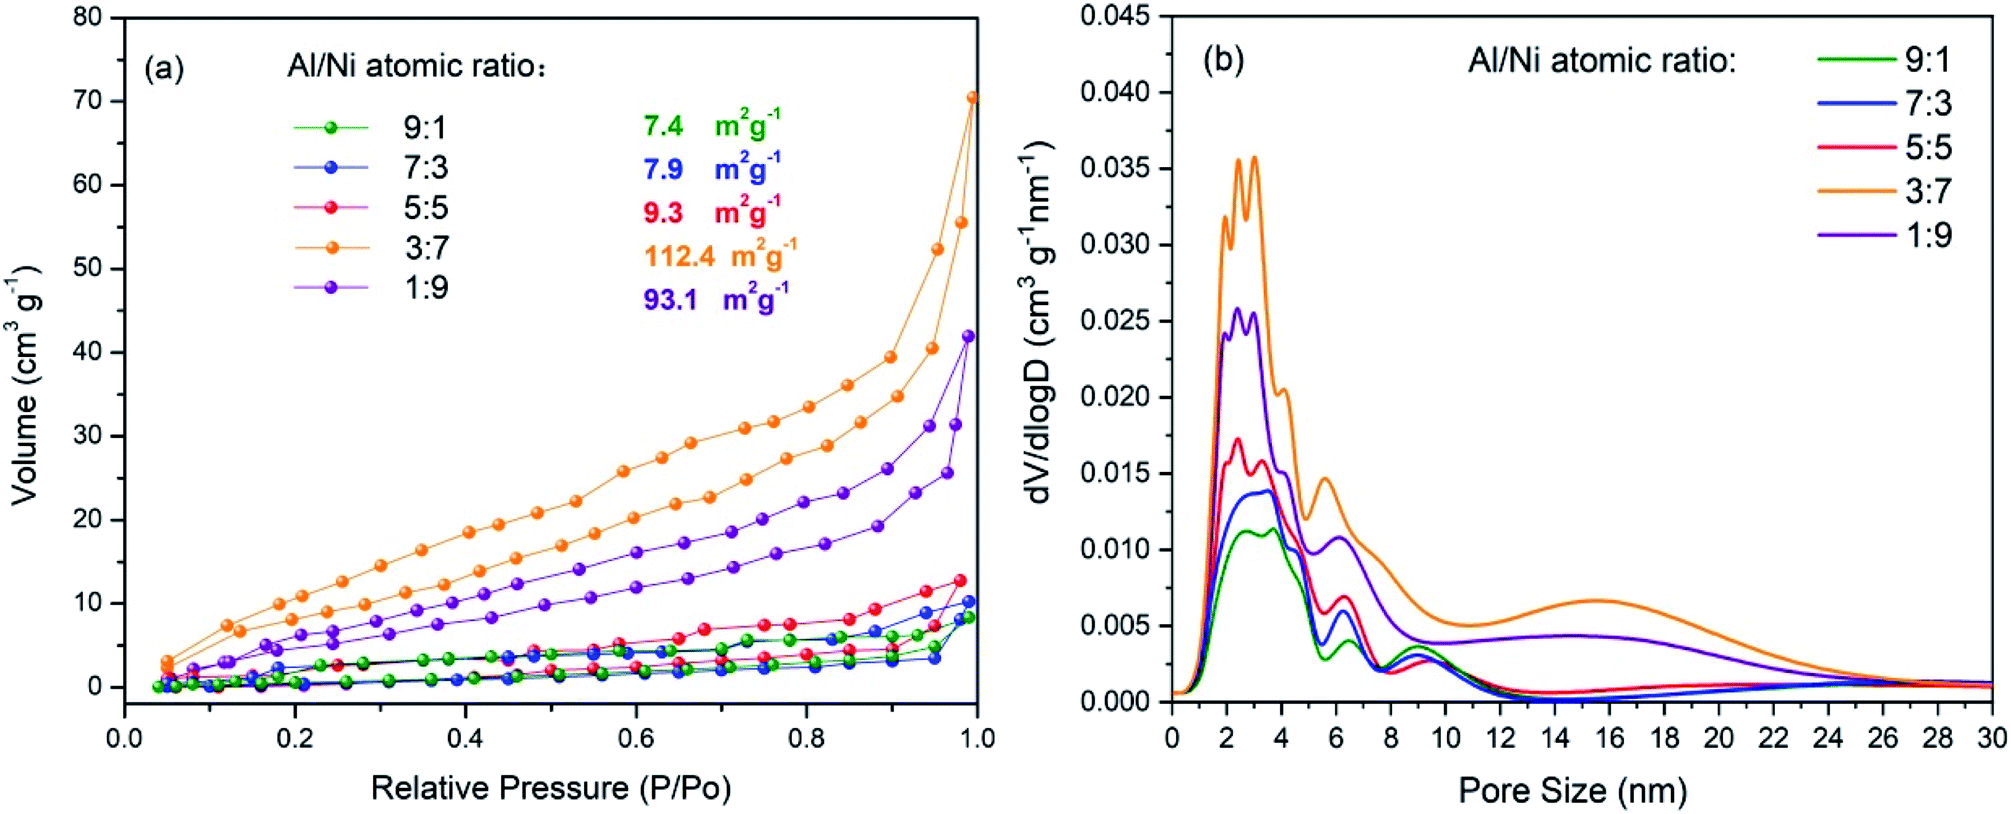 | ||
| Fig. 5 (a) Nitrogen adsorption–desorption isotherms and (b) pore-size distribution curves of the as-sintered electrodes. | ||
Once the Al particles melt to form the liquid phase during the laser-sintering process, capillary stresses cause the redistribution between the liquid and Ni particles, leading to the sequential filling of the pores. Since the small pores have a high surface-to-volume ratio, they are filled first and the large pores later. However, the pore filling has a percolation problem, depending on the amount of the liquid phase; whereby the liquid may have no access to all the small pores, so some of them remain empty when the large pores start to fill. When the Al/Ni atomic ratio is 9:1, since the liquid is sufficient, the rearrangement by itself can lead to an almost fully dense material with few closed pores. As the Al/Ni atomic ratio decreases, the filling of the pores decreases due to the increased viscosity of the liquid, which causes an increase in porosity. When the Al/Ni atomic ratio decreases to 5:5, the solid–solid contacts begin to form, in which case the liquid phase is still capable of penetrating indefinitely along the particle edges. However, the liquid phase is largely consumed in the subsequent interface reaction, leading to large pores at its site. When the Al/Ni atomic ratio deceases to 1:9, the formation of the solid skeleton inhibits the penetration of the liquid phase between the particles, so that the liquid forms isolated pockets in the narrow gap between the neighboring particles, limiting greatly the sizes of the pores.
3.3 Electrochemical properties
To understand the electrochemical properties of the as-sintered electrodes, cyclic voltammogram (CV) curves for the initial three cycles were measured in the range of 0.01–3.00 V at a scan rate of 0.1 mV s−1 as shown in Fig. 6. In Fig. 6a, during the first negative scanning of the Al/Ni electrode with the atomic ratio of 9:1, there was no obvious reduction peak corresponding to an SEI layer. Relevant studies also show that there is no or only a weak peak corresponding to an SEI layer on the CV curve during the first charge and discharge of Al electrodes.16,44,45 Then, the irreversible reduction peak of R1 (∼0.26 V) and the reversible peak of R2 (∼0.12 V) appear, corresponding to the lithium intercalation reaction of AlxNiy (stands for Al3Ni2 and/or Al3Ni) and Al, respectively. The reaction equations for the above lithium intercalation process are as follows in eqn (1) and (2). In eqn (1), the reduced Ni does not participate in the subsequent reaction, and acts as the conductive particles to enhance the conductivity of the electrode. During the subsequent negative scanning, there is no reduction peak around 0.26 V, indicating that AlxNiy has reacted completely during the first cycle. From the second cycle, the reduction peak appears only at about 0.12 V, indicating that Al is the only lithium intercalation phase in the subsequent cycle. During the positive scanning, the reversible oxidation peak O1 around 0.58–0.64 V corresponds to the delithiation reaction of LixAl as per the following eqn (3).| AlxNiy + xLi+ + xe− → xLiAl + yNi | (1) |
| Al + Li+ + e− ↔ LiAl | (2) |
| LiAl ↔ Al + Li+ + e− | (3) |
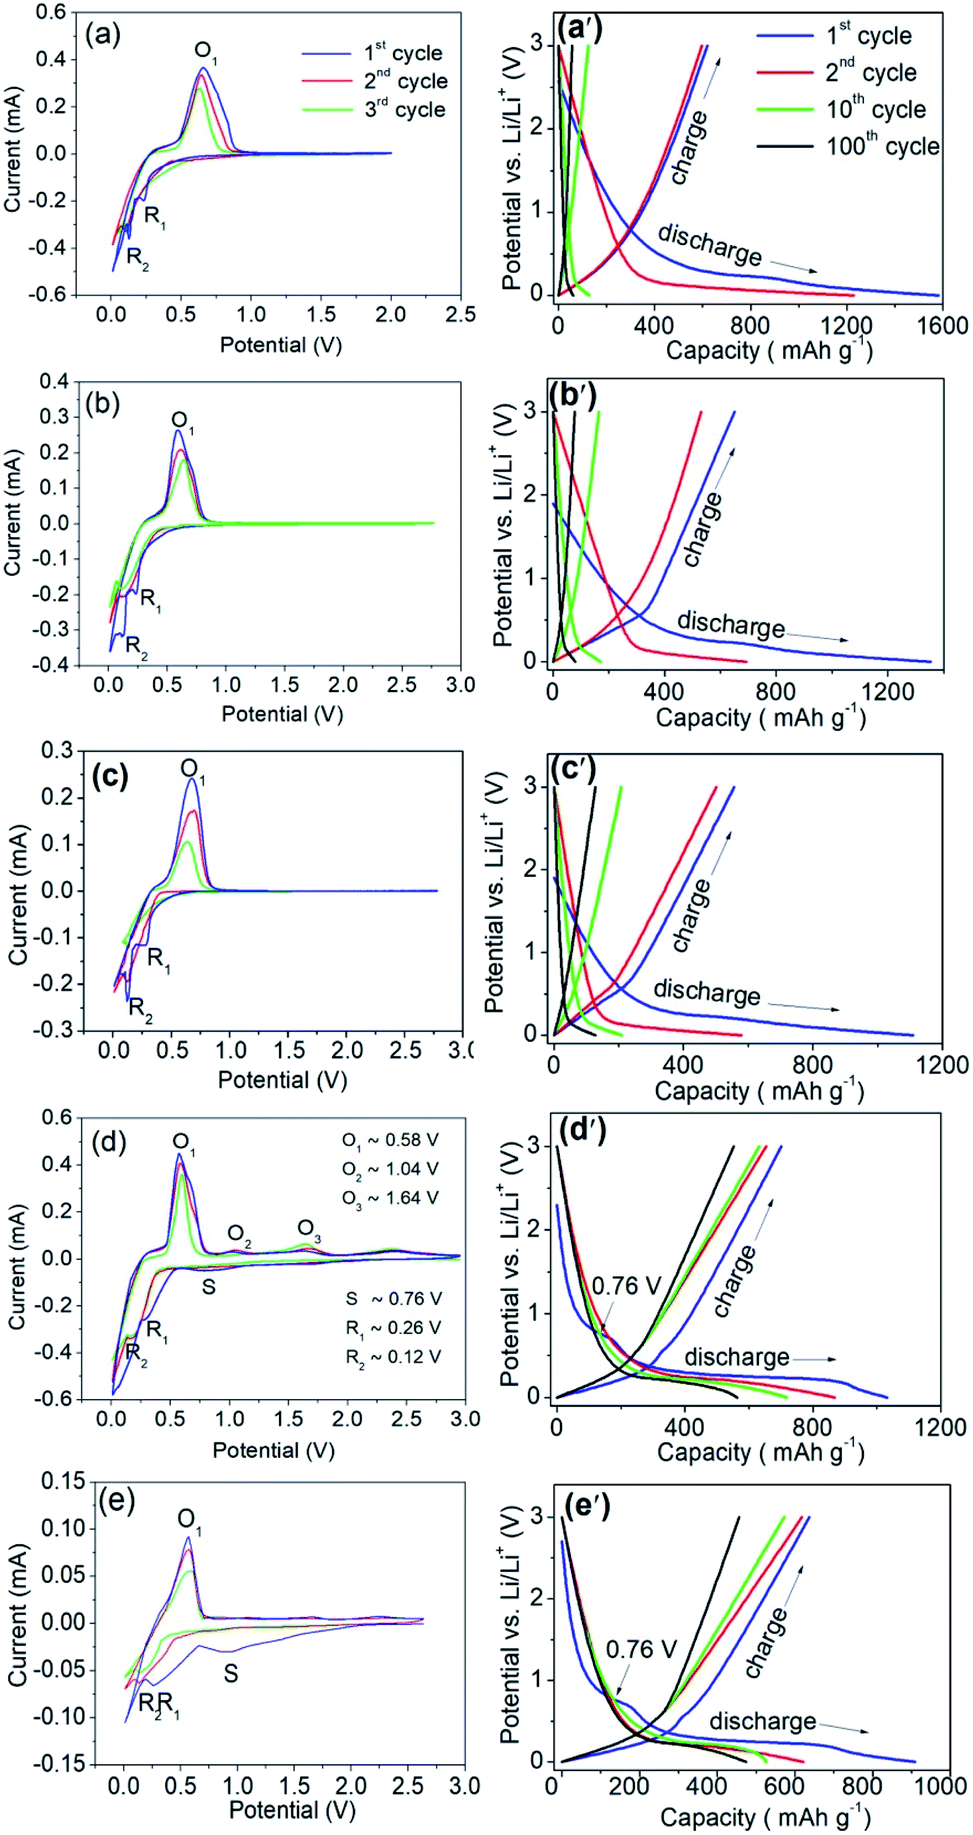 | ||
| Fig. 6 Cycle voltammogram curves of the as-sintered electrodes for the initial three cycles with a Al/Ni atomic ratio of: (a) 9:1, (b) 7:3, (c) 5:5, (d) 3:7, and (e) 1:9. The galvanostatic discharge/charge profiles of the as-sintered electrodes with a Al/Ni atomic ratio of: (a′) 9:1, (b′) 7:3, (c′) 5:5, (d′) 3:7, and (e′) 1:9 for the 1st, 2nd, 10th, and 100th cycles. | ||
Moreover, with the increase in cycle times, the height of the reduction and oxidation peak decreased, which shows that the charge/discharge capacity decreased during cycling.16 In Fig. 6b and c, the peak positions are basically consistent with Fig. 6a. With the decrease in Al/Ni atomic ratio, the intensities of the reduction peak R2 and oxidation peak O1 gradually decreased, which is consistent with the change in the residual Al content in the as-sintered electrode.
As shown in Fig. 6d, during the first negative scanning, two irreversible reduction peaks appeared at the S point (∼0.76 V) and R1 point (∼0.26 V), respectively. The former corresponded to the irreversible reaction between the electrode and the electrolyte, indicating that a stable SEI layer was formed on the electrode surface.45 The SEI layer is an electronic insulator, so that its formation hinders the further decomposition of the electrolyte. At the same time, it provides a channel for Li+ intercalation/de-intercalation, which makes the electrode work reversibly. The latter corresponds to the irreversible reaction of the Li+ and AlxNiy, as shown in eqn (1). During the discharge process, LiAl is delithiated into Al, as shown in eqn (3), corresponding to the oxidation peak of the O1 point (0.58–0.64 V). From the second negative scanning, Li+ intercalated into Al form LiAl, as shown in eqn (2), which corresponded to the reduction peak of R2 (∼0.12 V). The delithiation process may not be completed in one step, and a small amount of LiAl will remove Li+ in several steps, corresponding to the weak oxidation peaks near O2 (∼1.04 V) and O3 (∼1.64 V). In Fig. 6e, the reaction process was similar to the electrode with an Al/Ni atomic ratio of 3:7 due to having the same phase compositions. Only a small amount of LiAl can be produced through the reaction (eqn (1)) due to the lower content of AlxNiy, resulting in less active materials in the subsequent reversible electrochemical reaction (eqn (3)).
Fig. 6a′–e′ show the 1st, 2nd, 10th, and 100th cycled discharge/charge profiles of the as-sintered electrodes with different Al/Ni atomic ratios in the potential range of 0.01–3.00 V at a current density of 0.1 A g−1. In the first discharge, as the Al content decreased, the electrode delivered specific capacitances of 1582, 1353, 1108, 1033, and 909 mA h g−1, with initial coulombic efficiencies (ICE) of 39.2%, 48.0%, 50.2%, 67.9%, and 70.1%. The irreversible capacity loss was caused by the generation of side reactions and SEI layers in the initial cycle. For the as-sintered electrodes for the initial three cycles with Al/Ni atomic ratios of 3:7 and 1:9, the higher ICS values were attributed to the improvement of the electrical conductivity and shortening of the diffusion distance for Li+ ions due to the Ni framework and pore structure. Especially for the electrodes with the Al/Ni atomic ratios of 3:7 and 1:9, the irreversible reduction peak corresponding to the SEI film appeared at 0.76 V, while the other electrodes had no the plateaus around it, which was consistent with the results in the CV profiles (Fig. 6a–e). In the first charge process, a slope plateau appeared in the potential range of 0.58–0.64 V, corresponding to the delithiation reaction of LiAl. In the following cycles up to 100 rounds, as the Al content decreased, the discharge capacity decreased to 61, 80, 128, 563, and 474 mA h g−1. Compared with the first discharge capacity, the capacity retention was 3.8%, 5.9%, 11.5%, 54.5%, and 52.1%, respectively. The as-sintered electrode with the Al/Ni atomic ratio of 3:7 delivered a higher capacity than other Al composite electrodes reported in recent years; for example, the Al–Cu–Fe quasicrystal electrode with a capacity of 60 mA h g−1 (100 cycles),41 Al metal–organic framework/graphene with the capacity of 403 mA h g−1 (100 cycles),39 and Sn-18 wt% Al electrode with the capacity of 500 mA h g−1 (50 cycles)18 under a current of 0.1 A h g−1.
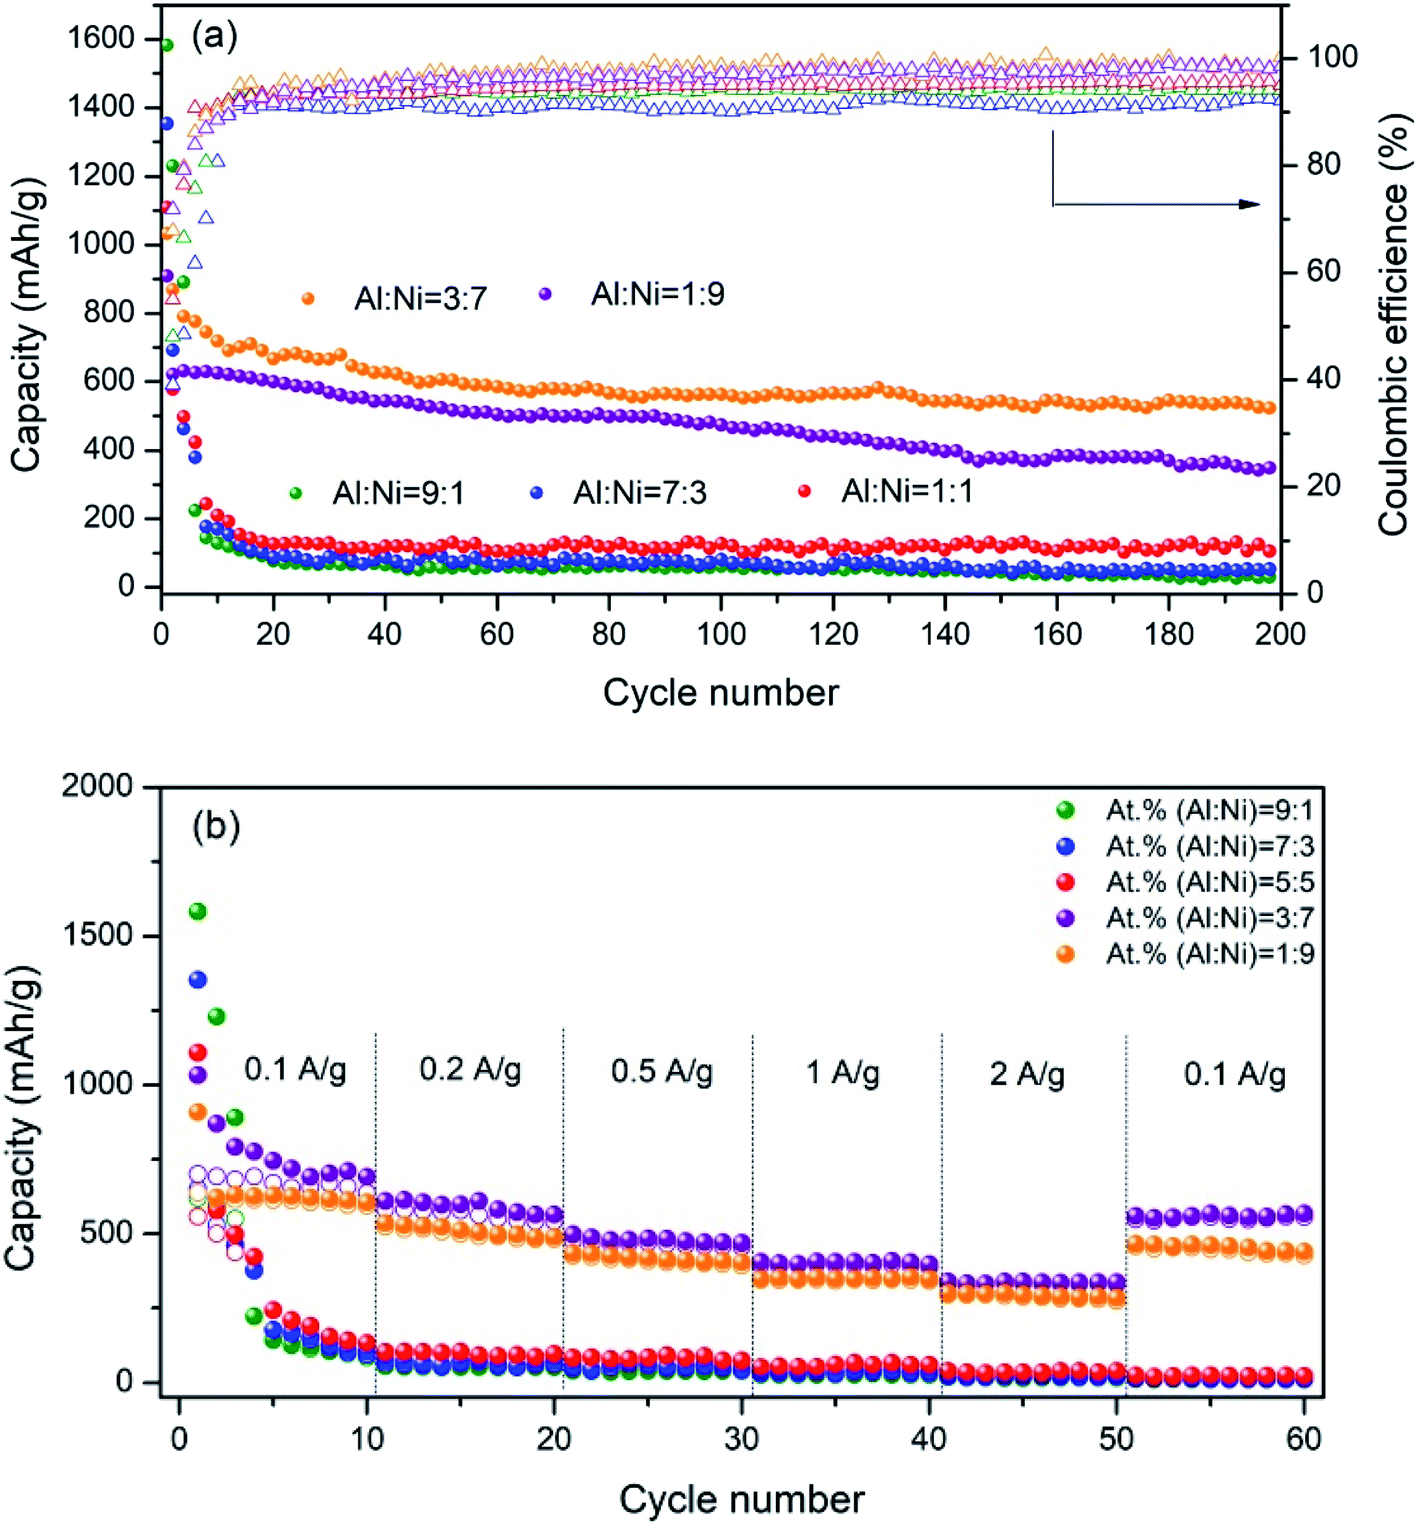
In order to further study the charge/discharge performance of the as-sintered electrodes, the specific capacities and coulombic efficiencies of the electrodes were tested, as shown in Fig. 7a. For the as-sintered electrodes with Al/Ni atomic ratios more than and equal to 5:5, it was obvious that the capacities decreased seriously during cycling, and were all less than 200 mA h g−1 after 200 cycles. However, for the as-sintered electrodes with Al/Ni atomic ratios of 3:7 and 1:9 at 200 cycles, the capacities of the electrodes remained at a high level. Especially for the electrode with the Al/Ni atomic ratio of 3:7, the capacity reached 522.8 mA h g−1, which was significantly higher than the theoretical capacity of the traditional carbon anode (372 mA h g−1). Fig. 7b shows the rate capacity of each electrode at different current densities. The rate performance results of the as-sintered Al/Ni electrodes were basically consistent with the cyclic performance. For the electrodes with Al/Ni atomic ratios more than 5:5, the rate performance of each electrode was poor. For example, the capacity of the electrode with the Al/Ni atomic ratio of 9:1 dropped from 91.7 (0.1 A g−1) to 18.3 mA h g−1 (2 A g−1), and the capacity did not return to the initial value in the subsequent small current cycle, indicating that the internal structure was damaged irreversibly at a large rate charge/discharge. In contrast, for the electrodes with an Al/Ni atomic ratio less than 5:5, the electrodes showed good rate performance. Especially for the electrode with the Al/Ni atomic ratio of 3:7, average reversible capacities of 691.1, 592.4, 480.2, 403.7, 337.1, and 567.4 mA h g−1 were obtained at current densities of 0.1, 0.2, 0.5, 1, 2, and 0.1 A g−1, respectively. Meanwhile, the capacity was restored to 82% of its initial value at a current density of 0.1 A g−1, indicating that the electrode internal structure remained stable after a high rate charge/discharge cycle. Table 3 presents a summary of the electrochemical properties of some intermetallic compound anodes reported in the literature. Through comparison, it can be seen that the Al/Ni electrode prepared by laser sintering showed a strong capacity advantage and cycle stability.
 | ||
| Fig. 7 (a) Cycling performances of the Al/Ni as-sintered electrodes at a current density of 100 mA g−1 between 0.01–2.00 V. (b) Rate capabilities of the as-sintered electrodes at various current densities from 0.1 A g−1 to 2.0 A g−1 in the potential range of 0.01–2.00 V. | ||
| Active substance | Synthesis method | Capacity after cycling | Ref. |
|---|---|---|---|
| Cu5Sn6 | Chemically dealloying | 340 mA h g−1 (0.1 A g−1, 100 cycles) | 46 |
| Cu5Sn6 | Electrodepositing | 448 mA h g−1 (0.1 A g−1, 25 cycles) | 47 |
| Ni3Sn2 | Chemically dealloying | 347 mA h g−1 (0.1 A g−1, 100 cycles) | 46 |
| Ni3.5Sn4 | Mechanical milling | 200 mA h g−1 (0.01 A g−1, 450 cycles) | 48 |
| Ni3Sn4 | High energy ball milling | 125 mA h g−1 (0.0002 A cm−2, 70 cycles) | 25 |
| CoSn@C | Hydrothermal, annealing, etching | 519 mA h g−1 (1 A g−1, 300 cycles) | 49 |
| C@Mg2Si | Mechano-thermal technique | 380 mA h g−1 (2 A g−1, 500 cycles) | 50 |
| Cu2Sb | Chemical synthesis | 230 mA h g−1 (0.0001 A cm−2, 30 cycles) | 21 |
| Cu2Sb | Chemical reduction | 200 mA h g−1 (0.0006 A cm−2, 25 cycles) | 22 |
| NiSb/G | One-step solvothermal route | 270 mA h g−1 (0.04 A g−1, 30 cycles) | 23 |
| FeSb2/G | One-step solvothermal route | 220 mA h g−1 (0.04 A g−1, 30 cycles) | 23 |
| Zn4Sb3/C | High energy ball milling | 400 mA h g−1 (0.04 A g−1, 10 cycles) | 26 |
| Zn4Sb3 | Chemical vapor deposition | 450 mA h g−1 (0.1 A g−1, 100 cycles) | 51 |
| ZnSb | Electrodepositing | 400 mA h g−1 (0.1 A g−1, 100 cycles) | 32 |
| SnSb/C | High energy ball milling | 420 mA h g−1 (0.1 A g−1, 50 cycles) | 27 |
| TiSb2 | Heat-treatment and milling | 170 mA h g−1 (0.1 A g−1, 100 cycles) | 28 |
| Al3Ni2 | Laser sintering | 520 mA h g−1 (0.1 A g−1, 200 cycles) | This work |
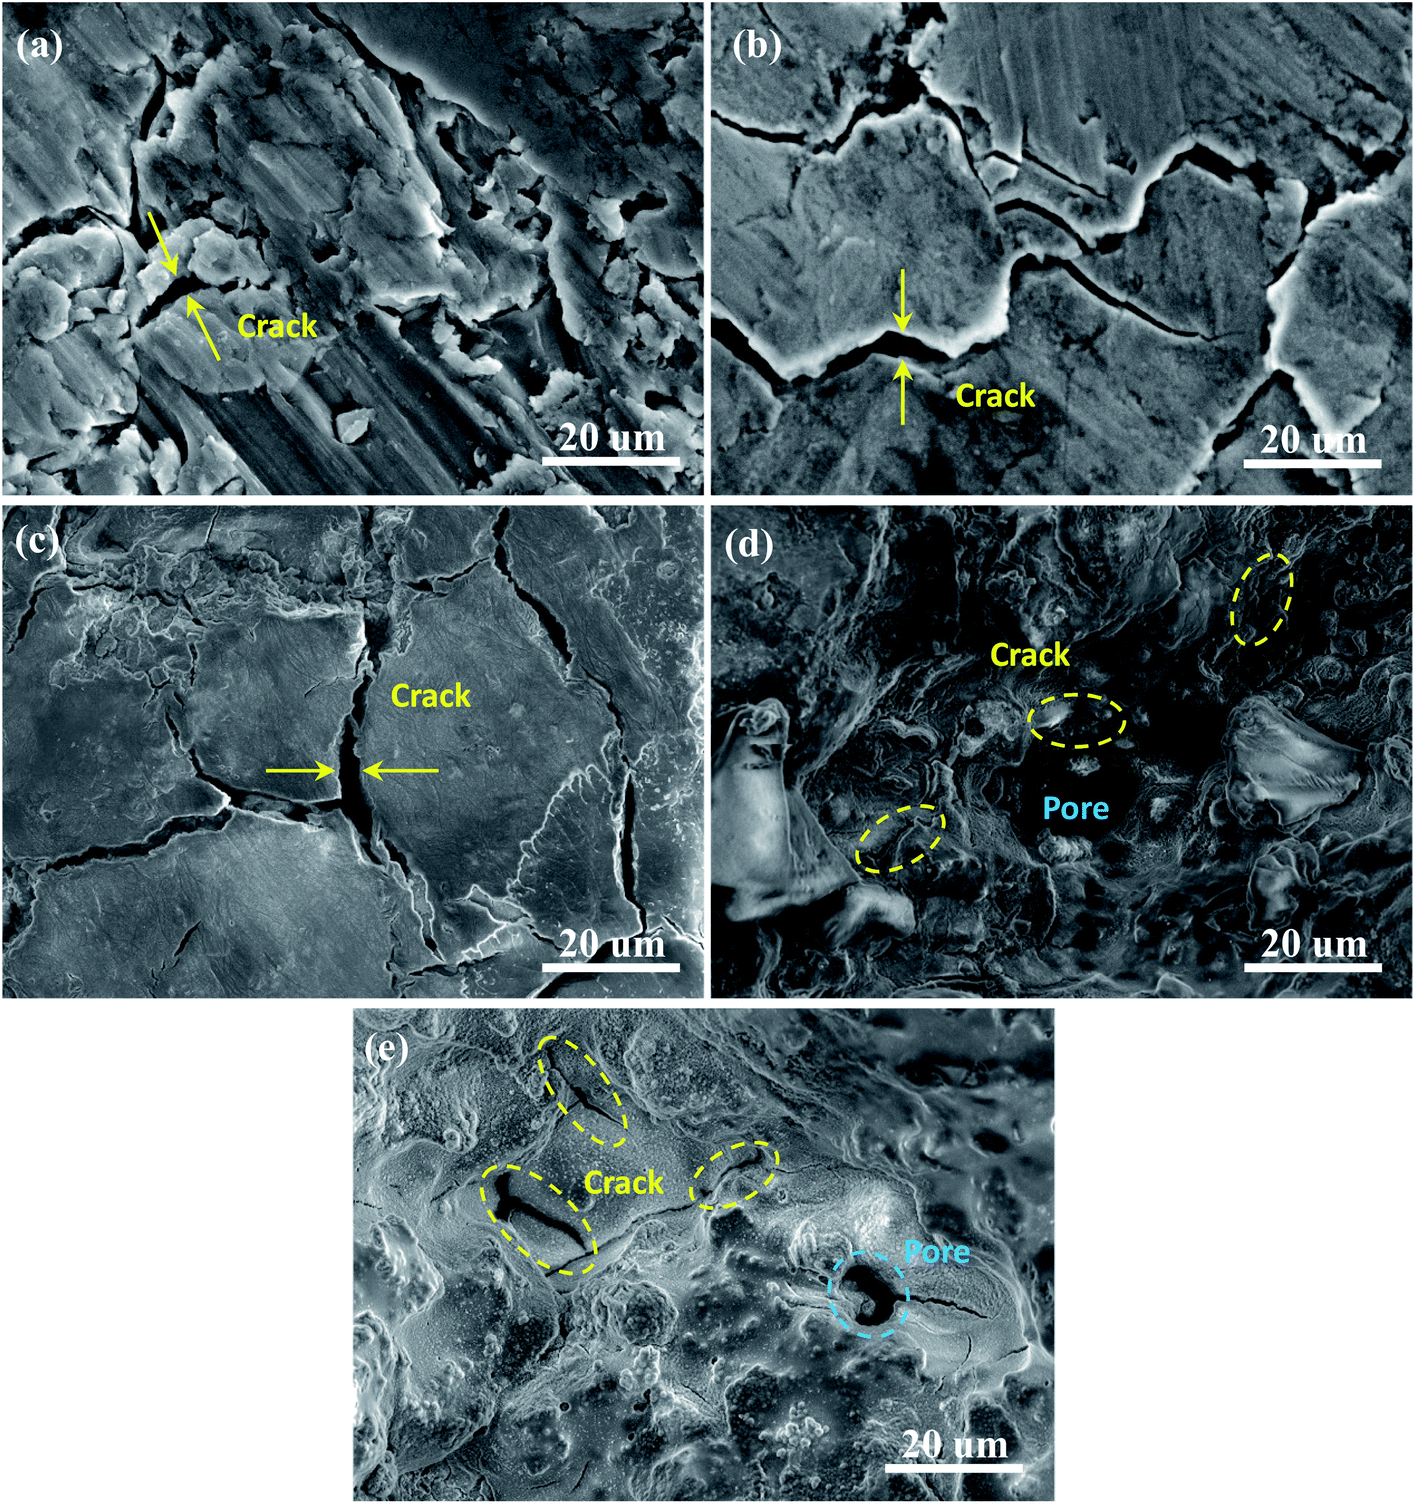
To further reveal the morphological variations of the as-sintered electrodes after cycling, typical SEM images are presented for the different Al/Ni atomic ratios after 200 cycles at the current density of 0.1 A g−1, as shown in Fig. 8. For the Al/Ni atomic ratio more than and equal to 5:5, a large number of cracks and even active materials peeled off from the electrode in the electrode with the Al/Ni atomic ratio of 9:1. The maximum width of the cracks was about 5 μm. This is because the porosity of the electrodes was low, and there was not enough space to alleviate the volume expansion of the active material during the charge/discharge processes, leading to fracture of the electrodes and a loss of electrical connection, resulting in serious capacity fade. For the Al/Ni atomic ratio less than 5:5, only a small number of cracks appeared, and the maximum width of the cracks was less than 0.1 μm, while no peeling of the active material was observed, and the integrity of the electrodes remained good. Here, there were a lot of pores in the electrodes, which could effectively alleviate the volume expansion, while the unique Ni framework formed in the laser sintering process played an important role in maintaining the integrity of the electrodes.
 | ||
| Fig. 8 SEM images as-sintered electrodes with different Al/Ni atomic ratios of: (a) 9:1, (b) 7:3, (c) 5:5, (d) 3:7, and (e) 1:9 after 200 cycles. | ||
For the great difference in the performance of each Al/Ni as-sintered electrode during the cycle, we try to explain this in terms of the structure as following. For the electrodes with the Al/Ni atomic ratio more than and equal to 5:5, due to the existence of the residual Al phase in the as-sintered electrodes, the higher the content of the residual Al phase, the more Li+ ions are involved in the intercalation process during charging. However, owing to the shrinkage of LiAl alloy in the process of lithium removal, interior cracks are caused by tensile stress,52 and the active material is separated from the electrode, resulting in a significant capacity fade. Moreover, the low porosity and specific surface area result in insufficient space for the electrode to inhibit volume expansion during charge and discharge. The dispersion of Ni particles and the inhomogeneity of the components in the electrodes greatly hinder the diffusion of lithium ions and the transmission of electrons. The above three points are the main reasons for the rapid capacity fade and poor rate performances. For the electrodes with Al/Ni atomic ratios of 3:7 and 1:9, the electrodes showed good cycle and rate performances. In combination with the schematic diagram of the electrode reaction mechanism in Fig. 9, the reasons for their good performances can be explained as follows. First, as a good conductor of electrons, the Ni framework can act as a current collector. At the same time, it can resist the stress caused by expansion during the charge and discharge, and maintain the structural stability of the electrode. Second, the pores distributed throughout the electrode can not only relieve the volume expansion, but also provide a channel for the rapid transmission of Li+ ions. Third, the Ni produced in the first step electrode reaction of Al3Ni2 and Li+ can act as conductive particles in the subsequent reaction. Moreover, the LiAl produced in the above reaction attached to the Ni particles continues to participate in the reaction and provides capacity for the electrode. It is worth mentioning that the capacity of the electrode with the Al/Ni atomic ratio of 1:9 was lower than that of the electrode with the atomic ratio of 3:7, which was mainly due to the decrease in the content of the active material Al3Ni2 and the pores.
 | ||
| Fig. 9 Schematic diagram of the electrode reactions for the electrodes with the Al/Ni atomic ratio less than 5:5. | ||
Electrochemical impedance spectroscopy (EIS) measurements were performed on the laser-sintered Al/Ni integrated electrodes to further investigate the electrochemical properties. Fig. 10 shows the Nyquist plots and fitting curves for the electrodes in the initial state and after 3 cycles. As shown in Fig. 10a, the impedance spectra of the initial state were composed of a semicircle in the high frequency range and a sloped line in the low frequency range. The former reflects the resistance of the charge transfer and the latter represents the diffusion of Li+ in the solid electrode. In Fig. 10b, compared with the initial state, in the impedance spectra of the cycled electrodes appeared two semicircles in the high frequency range. The first new semicircle represents the diffusion of Li+ in the SEI film, while the other semicircle and the sloped line represent the same process as in the initial state.
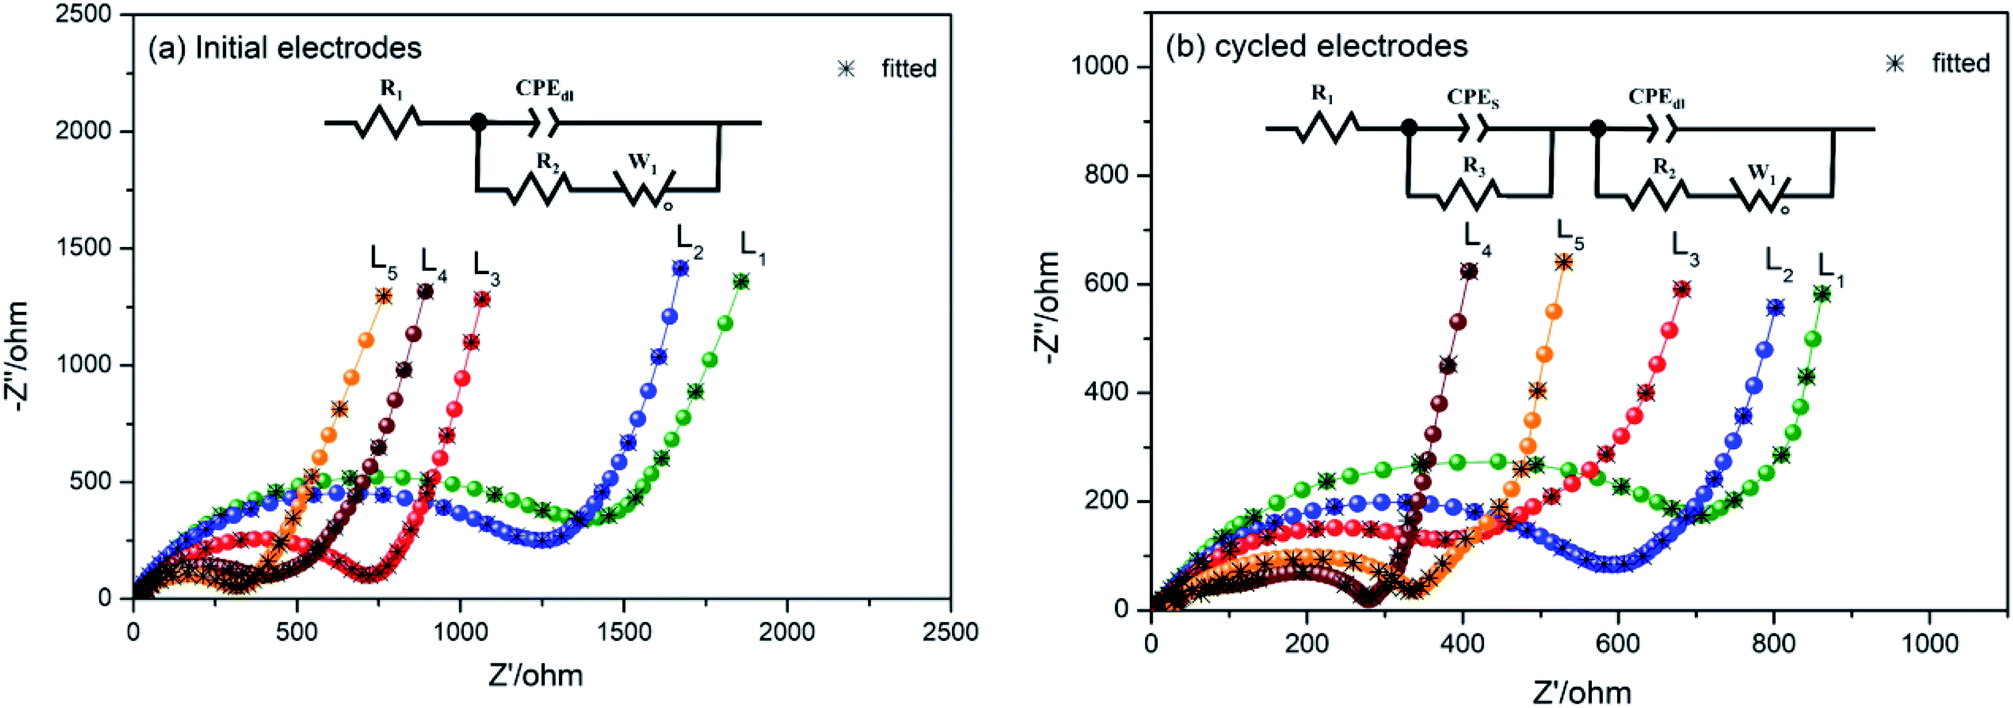 | ||
| Fig. 10 Nyquist plots for electrodes and fitting curves of the laser sintering Al/Ni integrated electrodes (a) at the initial state and (b) after 3 cycles within the frequency range between 0.01 Hz and 100 kHz. | ||
The insets of Fig. 10 are the analog circuits of the initial and cycled electrodes by numerically simulating the impedances spectra. Here, R1 reflects the contact resistance of the electrolyte and electrode; R2 and CPEdl are the charge-transfer resistance and its relative double-layer capacitance, which appear as a semicircle at high frequencies; and W1 is the Warburg impedance related to Li+ diffusing in the active materials, corresponding to the sloped line at low frequencies. After cycling, R3 and CPES are the resistance and capacitance of the SEI layer on the surface of active phases, which correspond to the semicircle at high frequencies. The faradaic current density (IF) and the diffusion coefficient (D0) of Li+ ions were calculated by the following eqn (4)–(6) and all the results are listed in Table 4.
| Z′ = R1 + Rct + Rs + σwω−0.5 | (4) |
| IF = RT/(nAFRct) | (5) |
| D0 = 0.5(RT/AF2σwC)2 | (6) |
The data in Table 4 are the simulation results from fitting the curves using ZView software. All the values of R1 were less than 10 Ω before and after the cycles, indicating the batteries were well assembled and the structural stabilities were good after cycling. The Rct values of the laser-sintered Al/Ni integrated electrodes decreased after cycling, especially decreasing to the lowest value of 133.8 Ω for the electrode with the Al/Ni atomic ratio of 3:7. At the same time, it could be found that the diffusion coefficient D0 (9.02 × 10⁻¹⁶ m2 s−1) and the Faraday current density IF (12.5 × 10⁻² mA cm−2) of the electrode with the Al/Ni atomic ratio of 3:7 were higher than those of the other electrodes after cycling. Obviously, this may be attributed to the stable and porous structure formed by laser sintering. Therefore, the specific capacity of the electrode with the Al/Ni atomic ratio of 3:7 was the highest, while the cycle stability was excellent in all the electrodes.
| Al/Ni (at%) | Initial state | After 3 cycles | ||||||
|---|---|---|---|---|---|---|---|---|
| R1/(Ω) | Rct/(Ω) | D0/(m2 s−1) | IF/(mA cm−2) | R1/(Ω) | Rct/(Ω) | D0/(m2 s−1) | IF/(mA cm−2) | |
| 9:1 |
8.8 | 1515.1 | 3.12 × 10⁻¹⁷ | 1.10 × 10⁻² | 6.4 | 796.2 | 1.16 × 10⁻¹⁷ | 2.10 × 10⁻² |
| 7:3 |
9.5 | 1148.0 | 5.08 × 10⁻¹⁷ | 1.45 × 10⁻² | 5.6 | 539.9 | 2.85 × 10⁻¹⁷ | 3.10 × 10⁻² |
| 5:5 |
8.5 | 693.2 | 6.81 × 10⁻¹⁷ | 2.41 × 10⁻² | 6.7 | 507.0 | 3.36 × 10⁻¹⁷ | 3.30 × 10⁻² |
| 3:7 |
8.7 | 338.6 | 7.81 × 10⁻¹⁷ | 4.93 × 10⁻² | 5.7 | 133.8 | 9.02 × 10⁻¹⁶ | 12.5 × 10⁻² |
| 1:9 |
5.6 | 296.9 | 7.98 × 10⁻¹⁷ | 5.62 × 10⁻² | 3.2 | 270.4 | 2.86 × 10⁻¹⁶ | 6.18 × 10⁻² |
4 Conclusion
Al/Ni integrated electrodes were successfully prepared by laser sintering. The microstructure, phase composition, and pore structure of the as-fabricated electrodes were closely related to the composition of the raw materials and the laser parameters. The results showed that for Al/Ni atomic ratios more than 5:5, the main phases were Al, Al3Ni2, Al3Ni, and Ni. In contrast, for the electrodes with Al/Ni atomic ratios less than 5:5, they featured a Ni framework supporting an Al3Ni2 intermetallic compound. The Ni skeletons played the role of a support and conductive network. The large porosity and specific surface area played important roles in maintaining the stable high capacity, ensuring the full contact between the active substances and electrolyte, and alleviating the volume expansion in the charge/discharge process. The Ni skeleton and epitaxial growth Al3Ni2 layer were combined metallurgically, and the stability of the electrode structure was maintained by the strong mechanical strength. Therefore, this was reflected in the good cycle stability and rate performance under high current. In particular, the capacity of the electrode with the Al/Ni atomic ratio of 3:7 was above 520 mA h g−1 after 200 cycles at the current density of 100 mA g−1. Even when the current density was 2 A g−1, the capacity was 338.4 mA h g−1. Laser sintering provides a new attempt and exploration direction for the large-scale industrial preparation of integrated electrodes.
Author contributions
C. S. Wang and X. L. Dong conceived and designed the project. X. Zhang performed the experiments, analyzed the data, and wrote the manuscript. W. F. Yang, Z. Y. Zhang and D. D. Gao reviewed and modified the manuscript. All authors discussed the results and commented on the manuscript.Conflicts of interest
There are no conflicts to declare.Acknowledgements
This work was supported by the National Natural Science Foundation of China (No. 51371041).References
- M. Winter, J. O. Beaenhard, M. E. Spahr and P. Novak, Adv. Mater., 1998, 10, 725–763 CrossRef CAS.
- A. K. Shukla and T. P. Kumar, Curr. Sci., 2008, 94, 314–331 CAS.
- T. Chen, Q. Zhang, J. Xu, J. Pan and Y.-T. Cheng, RSC Adv., 2016, 6, 29308–29313 RSC.
- T. Zhang, L. Hu, J. Liang, Y. Han, Y. Lu, Y. Zhu and Y. Qian, RSC Adv., 2016, 6, 30577–30581 RSC.
- J. Liang, Y. Yang, J. Gao, L. Zhou, M. Gao, Z. Zhang, M. Javid, Y. G. Jung, X. L. Dong and G. Z. Cao, J. Solid State Electrochem., 2019, 23, 735–748 CrossRef.
- J. S. Song, G. B. Cho, J. H. Ahn and K. K. Cho, Appl. Surf. Sci., 2017, 415, 14–18 CrossRef CAS.
- N. Umirov, D. H. Seo, K. N. Jung, H. Y. Kim and S. S. Kim, J. Electrochem. Sci. Technol., 2019, 10, 82–88 CAS.
- W. Wei, H. Wang, A. Tian, K. Wang, J. Wang, P. Qu, S. Zhang and L. Guo, Nanoscale, 2018, 10, 6872–6877 RSC.
- A. Trifonova, M. Wachtler, M. Winter and J. O. Besenhard, Ionics, 2002, 8, 321–328 CrossRef CAS.
- Z. Chen, Y. Cao, J. Qian, X. Ai and H. Yang, J. Solid State Electrochem., 2012, 16, 291–295 CrossRef CAS.
- M. Ara, K. Wadumesthrige, T. Meng, S. O. Salley and K. Y. S. Ng, RSC Adv., 2014, 4, 20540–20547 RSC.
- J. O. Besenhard, M. Hess and P. Komenda, Solid State Ionics, 1990, 40–41, 525–529 CrossRef CAS.
- M. J. Lindsay, G. X. Wang and H. K. Liu, J. Power Sources, 2003, 119–121, 84–87 CrossRef CAS.
- R. Hu, M. Zeng, C. Y. V. Li and M. Zhu, J. Power Sources, 2009, 188, 268–273 CrossRef CAS.
- J. H. Park, C. Hudaya, A. Y. Kim, D. K. Rhee, S. J. Yeo, W. Choi, P. J. Yoo and J. K. Lee, Chem. Commun., 2014, 50, 2837–2840 RSC.
- Y. Hamon, T. Brousse, F. Jousse, P. Topart, P. Buvat and D. M. Schleich, J. Power Sources, 2001, 97–98, 185–187 CrossRef CAS.
- S. K. Sharma, M. S. Kim, D. Y. Kim and J. S. Yu, Electrochim. Acta, 2013, 87, 872–879 CrossRef CAS.
- L. Wei, K. Zhang, Z. Tao and J. Chen, J. Alloys Compd., 2015, 644, 742–749 CrossRef CAS.
- Z. W. Huang, S. J. Hu, X. H. Hou, L. Z. Zhao, Q. Ru, W. S. Li and Z. W. Zhang, Chin. Phys. B, 2010, 19, 117101 CrossRef.
- S. Machill and D. Rahner, J. Power Sources, 1995, 54, 428–432 CrossRef CAS.
- T. Sarakonsri, C. S. Johnson, S. A. Hackney and M. M. Thackeray, J. Power Sources, 2006, 153, 319–327 CrossRef CAS.
- J. Ren, X. He, W. Pu, C. Jiang and C. Wan, Electrochim. Acta, 2006, 52, 1538–1541 CrossRef CAS.
- X. Jian, Y. X. Zheng, R. J. Pan, S. Y. Liu and X. B. Zhao, Int. J. Electrochem. Sci., 2011, 6, 4811–4821 Search PubMed.
- G. M. Ehrlich, C. Durand, X. Chen, T. A. Hugener, F. Spiess and S. L. Suib, J. Electrochem. Soc., 2000, 147, 886–891 CrossRef CAS.
- H. Y. Lee, S. W. Jang, S. M. Lee, S. J. Lee and H. K. Baik, J. Power Sources, 2002, 112, 8–12 CrossRef CAS.
- X. B. Zhao and G. S. Cao, Electrochim. Acta, 2002, 46, 891–896 CrossRef.
- C. M. Park and K. J. Jeon, Chem. Commun., 2011, 47, 2122–2124 RSC.
- C. M. Park and H. J. Sohn, J. Electrochem. Soc., 2010, 157, A46–A49 CrossRef CAS.
- L. Simonin, U. Lafont and E. M. Kelder, J. Power Sources, 2008, 180, 859–863 CrossRef CAS.
- J. M. Mosby and A. L. Prieto, J. Am. Chem. Soc., 2008, 130, 10656–10661 CrossRef CAS PubMed.
- Y. W. Yang, T. Y. Li, L. Fei, W. B. Zhu, X. L. Li, Y. C. Wu and M. G. Kong, Microelectron. Eng., 2013, 104, 1–4 CrossRef CAS.
- S. Saadat, J. Zhu, M. M. Shahjamali, S. Maleksaeedi, Y. Y. Tay, B. Y. Tay, H. H. Hng, J. Ma and Q. Yan, Chem. Commun., 2011, 47, 9849–9851 RSC.
- J. Chen, Z. Yin, D. Sim, Y. Y. Tay, H. Zhang, J. Ma, H. H. Hng and Q. Yan, Nanotechnology, 2011, 22, 325602 CrossRef PubMed.
- J. Xu, H. Wu, W. Fei, Y. Xia and G. Zheng, Adv. Energy Mater., 2013, 3, 286–289 CrossRef CAS.
- X. Zhang, C. Wang, X. Dong, J. Liang, D. Gao, W. Yang and Z. Zhang, J. Solid State Chem., 2020, 290, 121543 CrossRef CAS.
- J. C. F. F. Ulrich Hillebrecht, P. A. Bennett, Z. Zonierek and C. Freiburg, Phys. Rev. B: Condens. Matter Mater. Phys., 1983, 27, 2179–2193 CrossRef.
- V. L. Vorob'ev, L. V. Dobysheva, A. Y. Drozdov, P. V. Bykov and V. Y. Bayankin, J. Electron Spectrosc. Relat. Phenom., 2021, 252, 147124 CrossRef.
- M.-J. Zhou, T. Xu and J.-M. Hu, Surf. Coat. Technol., 2021, 421, 127416 CrossRef CAS.
- C. Gao, P. Wang, Z. Wang, S. K. Kær, Y. Zhang and Y. Yue, Nano Energy, 2019, 65, 104032 CrossRef CAS.
- J. Sun, J. Li, B. Ban, J. Shi, Q. Wang and J. Chen, Electrochim. Acta, 2020, 345, 136242 CrossRef CAS.
- X. Lan, H. Wang, Z. Sun and X. Jiang, J. Alloys Compd., 2019, 805, 942–946 CrossRef CAS.
- K. S. W. Sing, D. H. Everett, R. A. W. Haul, L. Moscou, R. S. Pierotti, J. Rouquerol and T. Siemieniewska, Pure Appl. Chem., 1985, 57, 603–619 CrossRef CAS.
- B. L. Newalkar, J. Olanrewaju and S. Komarneni, Langmuir, 1997, 13, 6267–6273 CrossRef.
- G. Oltean, C.-W. Tai, K. Edström and L. Nyholm, J. Power Sources, 2014, 269, 266–273 CrossRef CAS.
- X. Guanglin, Z. Hongyu, L. Ming, W. Jian and F. Sun, Adv. Mater., 2019, 31, 1901372 CrossRef PubMed.
- N. Soltani, A. D. C. Permana, S. Donath and D. Mikhailova, Mater. Today Commun., 2021, 29, 102965 CrossRef CAS.
- L. Yu, C. Miao, S. Nie, M. Wen, J. Wang, Y. Tan and W. Xiao, Solid State Ionics, 2021, 364, 115625 CrossRef CAS.
- Z. Edfouf, C. Fariaut-Georges, F. Cuevas, M. Latroche, T. Hézèque, G. Caillon, C. Jordy, M. T. Sougrati and J. C. Jumas, Electrochim. Acta, 2013, 89, 365–371 CrossRef CAS.
- D. Zhang, G. Chen, H. Wang, L. Chen, Z. Guo, Z. Wen, N. Zhang, X. Liu and R. Ma, Chin. Chem. Lett., 2021 DOI:10.1016/j.cclet.2021.11.021.
- A. G. Tamirat, M. Hou, Y. Liu, D. Bin, Y. Sun, L. Fan, Y. Wang and Y. Xia, J. Power Sources, 2018, 384, 10–17 CrossRef CAS.
- J. Xu, H. Wu, W. Fei, Y. Xia and G. Zheng, Adv. Energy Mater., 2013, 3, 286–289 CrossRef CAS.
- W. J. Zhang, J. Power Sources, 2011, 196, 13–24 CrossRef CAS.
| This journal is © The Royal Society of Chemistry 2022 |