 Open Access Article
Biomass porous carbon as the active site to enhance photodegradation of oxytetracycline on mesoporous g-C3N4 †
Hekun Dingab,
Zheng Liu *ab,
Qiongyue Zhanga,
Xiao Hea,
Qingge Feng
 ab,
Dongbo Wangab and
Dachao Maab
aSchool of Resources, Environment and Materials, Guangxi University, Nanning 530004, Guangxi, China. E-mail: zhengl99@gxu.edu.cn
bGuangxi Key Laboratory of Processing for Non-ferrous Metals and Featured Materials, Guangxi University, Nanning 530004, Guangxi, China
First published on 12th January 2022
Abstract
Graphitic carbon nitride (g-C3N4) is widely used in photocatalytic adsorption and degradation of pollutants, but there are still some problems such as low adsorption performance and high electron–hole recombination efficiency. Herein, we propose a new molten salt assisted thermal polycondensation strategy to synthesize biomass porous carbon (BPC) loaded on g-C3N4 composites (designated as BPC/g-C3N4) with a hollow tubular structure, which had a high surface area and low electron–hole recombination rate. The study shows that the morphology of g-C3N4 changes dramatically from massive to hollow tubular by molten salt assisted thermal polycondensation, which provides a base for the loading of BPC, to construct a highly effective composite photocatalyst. BPC loaded on g-C3N4 could be used as the active site to enhance Oxytetracycline (OTC) removal efficiency by adsorption and with higher electron–hole separation efficiency. As a result, the BPC(5%)/g-C3N4 sample presented the highest photocatalytic degradation efficiency (84%) for OTC degradation under visible light irradiation. The adsorption capacity and photocatalytic reaction rate were 3.67 and 5.63 times higher than that of the g-C3N4, respectively. This work provided a new insight for the design of novel composite photocatalysts with high adsorption and photocatalytic performance for the removal of antibiotic pollutants from wastewater.
Introduction
In recent years, environmental pollution and energy shortage have become urgent problems of the modern world with the rapid growth of industrialization and urbanization, which have threatened survival.1,2 Antibiotics are a kind of persistent pollutant, and as a typical tetracycline antibiotic and growth promoter, oxytetracycline (OTC) has been widely employed in clinical treatment and livestock farming.3,4 However, OTC cannot be fully metabolized in the human body and other living bodies, resulting in its massive release to the environment through hospital wastewater discharge, aquaculture, and human and animal feces.5,6 Moreover, traditional treatment methods such as adsorption, Fenton oxidation and biodegradation are not effective in OTC removal.7 Therefore, the OTC contamination of the environment brings serious threat to human health and the ecosystem,5,8,9 and it is necessary to develop novel materials and technology to eliminate OTC pollution from the environment effectively.More recently, light-driven photocatalytic technology has attracted much attention due to its stability, low energy consumption and ecofriendly nature, which has been considered as an promising technology.10,11 A variety of semiconductors have been developed as photocatalysts for the degradation of antibiotics pollutants,12–14 such as TiO2, ZnO and CdS, among which graphitic carbon nitride (g-C3N4) as a new semiconductor photocatalyst has attracted the attention of many researchers worldwide.15,16 It is of great the advantages of suitable band gap (≈2.7 eV), high catalytic efficiency, as well as excellent thermal and chemical stability, cost effectiveness and easy preparation.17–19 However, the photocatalytic activity of g-C3N4 was limited by the small specific surface area, high combination rate of photogenerated electron–hole pairs and low utilization efficiency of the visible light.18,20,21 Consequently, some strategies such as element doping,22,23 constructing heterojunction24–26 and morphology control27,28 have been adopted to enhance the photocatalytic performance of g-C3N4. Among them, increasing the specific surface area was regarded as the more simply and practical way to modify the g-C3N4. Chen et al.29 prepared g-C3N4 with 3D porous structures by SiO2 template method, which showed higher photocatalytic activity due to the large specific surface area and the short charge migration distance. Jin et al.30 fabricated nanotube g-C3N4 with high specific surface area and more defects by a simple two-step condensation method, and the photocatalytic activity of RhB under visible light irradiation was enhanced. Liu et al.31 prepared a mesoporous g-C3N4 with hollow tubular structure by molten salt-assisted silica (SiO2) aerogel template method, and its photocatalytic degradation efficiency of RhB can reach 90.9%. Furthermore, it has been found that the activated carbon with large specific surface area and strong adsorption capacity can be introduced to synthesize the composite photocatalytic materials, which could produce synergistic effects of adsorption and photocatalytic degradation to improve the efficiency. Wang et al.32 found that Bi–Ti/PAC(10%) prepared by sol-hydrothermal method had a better photocatalytic degradation effect of sulfamethazine (SMT) compared to Bi–Ti without PAC. Lim et al.33 successfully prepared TiO2/AC composites and explored the bifunctionality of adsorption and photocatalysis to remove organic pollutants from water. However, there are few reports on the preparation of biomass porous carbon (BPC) and g-C3N4 composites materials for the degradation of antibiotic contaminant. Furthermore, although the preparation of g-C3N4 and activated carbon composites by thermal polycondensation has been described, the improvement of the photocatalytic performance of composites by molten salt-assisted method has been rarely reported. Besides, the photocatalytic degradation of antibiotic pollutants and its photocatalytic degradation mechanism have not been thoroughly investigated.
In this study, using eucalyptus bark and melamine as raw materials, BPC/g-C3N4 composites with the hollow nanorod structure was prepared by a molten salt-assisted thermal polycondensation method. The effects of BPC loading content on the adsorption and photocatalytic properties of BPC/g-C3N4 composites for OTC were deliberated investigated. In addition, the comprehensive characterization of composite material was conducted and the mechanism of photocatalytic activity improvement was revealed by the electrochemical testing. This work proved that the BPC/g-C3N4 composites exhibited enhanced photocatalytic degradation of OTC activities under visible-light irradiation in comparison to g-C3N4, and it may provide a good reference for developing more superior g-C3N4 composite materials.
Experimental section
Composite preparation
Characterization
The crystal structure and chemical components of the BPC(X%)/g-C3N4 was measured by X-ray diffraction (XRD, Rigaku D/MAX 2500 V, Japan) with Cu/Kα radiation, Fourier transform infrared spectrum (FT-IR, IRTracer-100, Shimadzu company of Japan) and X-ray photoelectron spectroscopy (XPS, Thermo Fisher USA). The surface morphologies and specific surface area of the samples were studied using scanning electron microscopy (SEM, Hitachi SU8220, Japan), Transmission electron microscopy (TEM, JEOL JEM 2100F, Japan) and Brunauer–Emmett–Teller (BET, TriStarII3020, MAC, USA) of N2 adsorption/desorption analyses. The optical properties of the samples were characterized by diffuse reflectance spectroscopy (DRS, UV-2600, Shimadzu Instruments Co. Ltd, Suzhou, China) in a spectral range of 220–800 nm and photoluminescence (PL, omni-fluo-960, Zhuo Lihan optical instruments Co. Ltd, Beijing, China) with a 355 nm excitation wavelength. The electrochemical impedance spectroscopy (EIS) and Mott–Schottky (MS) analysis were conducted on a CHI660E electrochemical workstation (Chenhua Instrument, Shanghai, China). In a three-electrode system, Pt foil as the counter electrode and Ag/AgCl electrode (3 M KCl) acted as reference electrode, in which 0.5 M Na2SO4 was served as the electrolyte solution. The EIS measurement was performed at the frequency ranging from 0.1 Hz to 105 Hz and the MS measurement was performed at frequency of 1000 Hz.Adsorption test
Kinetic and equilibrium adsorption experiments of OTC on g-C3N4 and BPC/g-C3N4 composite were performed in dark. In a typical experiment, 100 mg of g-C3N4 and BPC/g-C3N4 were dispersed in 100 ml OTC solution at a concentration of 10 mg l−1. The suspension was sealed in a conical flask with cover, placed in a constant temperature shaker and agitated at 120 rpm in the dark. At the regular time intervals, 5 ml suspension was removed and filtered through a 0.45 μm nylon syringe filter. Finally, the concentrations of OTC suspension were analysed by UV-vis spectrophotometer with absorbance at its characteristic absorption peaks of 353 nm.Photocatalytic test
The photocatalytic performance of BPC/g-C3N4 composite was evaluated by the degradation of OTC under visible light irradiation, and a xenon lamp (300 W) with a cut-off filter of 420 nm was used as the light source. A certain amount of photocatalyst (50 mg) was dispersed in a proper concentration of OTC solution (10 mg l−1, 50 ml), and stirred under dark conditions for 60 min to ensure that the OTC reached adsorption equilibrium on the surface of the photocatalyst. Then 5 ml suspension was taken at an appropriate interval, filtered by 0.45 μm nylon syringe filter to remove catalysts. The remaining concentration of OTC in the filtrate was tested by a UV-vis spectrophotometer. The OTC solution degradation rate can be calculated by the following formula:
 | (1) |
The reaction kinetics process of the OTC photodegradation was evaluated through fitting experimental data by applying the pseudo-first-order kinetic equation The kinetic equation of OTC photodegradation is as follows:
 | (2) |
In addition, to estimate the reusability of the samples, five successive cycles of experiments were performed for OTC photocatalytic degradation. The used sample after each cycle was collected by centrifugation and rinsed three times with ethanol and ultrapure water before drying for standby.
Radical scavenging experiment
In order to detect the active species in the photocatalytic process, 10 mmol IPA, 10 mmol EDTA and 1 mmol BQ were used to trap hydroxyl radical (˙OH), hole (h+) and superoxide radical (˙O2−), respectively. The quenching experimental steps were conducted with the same as the photocatalytic degradation experiment mentioned above, except that the scavenger was added to the suspension before the experiment.Results and discussion
Physical characterization
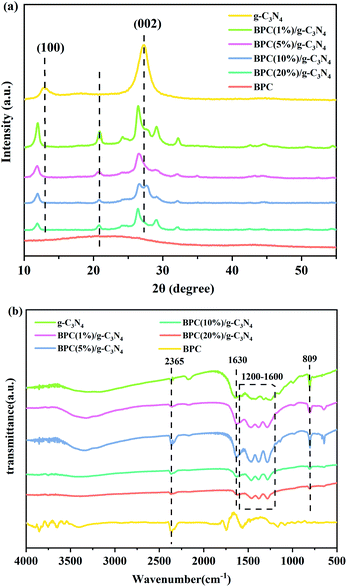
The X-ray diffraction patterns of the prepared pure g-C3N4, BPC and BPC/g-C3N4 composite are shown in Fig. 1(a). It was observed that the pure g-C3N4 had the characteristic peaks at 12.92° and 27.3°, which can be indexed as the (100) and (002) reflections.34 These peaks can be ascribed to the in-plane structural packing motifs and interplanar stacking of carbon nitride layers, respectively.35,36 For BPC, the broad peaks at 2θ = 22.3° indicated that BPC was almost amorphous, which was a typical characteristic of BPC. Compared with the pure g-C3N4, the characteristic peaks of the BPC/g-C3N4 composites were shifted from 27.3° to 26.5° and the intensity of the diffraction peaks was reduced gradually with the increase of BPC loading content. The results indicated that the composites were mainly including g-C3N4 and BPC, the loaded BPC promoted the interlayer spacing of the g-C3N4, which increased the specific surface area and active site.The interaction between the g-C3N4 and BPC was investigated by FT-IR. Fig. 1(b) showed the FT-IR spectra of the g-C3N4, BPC(X%)/g-C3N4 and BPC. For the FTIR spectrum of the pure g-C3N4, the peak located at 809 cm−1 was attributed to the tri-s-triazine ring.37 The group of peaks in the region of 1200–1600 cm−1 corresponded to the stretching vibration modes of C–N heterocycles.38 The broad peaks around 3000–3500 cm−1 were ascribed to terminal amino groups and surface adsorbed water molecules.39,40 Compared with pure g-C3N4, the new peak located at about 1630 cm−1 appeared in the spectrum of BPC/g-C3N4 composite, which was attributed to C![[double bond, length as m-dash]](https://www.rsc.org/images/entities/char_e001.gif) C stretching vibration mode in BPC aromatic ring. It could be clearly seen that the characteristic absorption peaks of BPC/g-C3N4 composites are almost the same as those of pure g-C3N4. We also observed that the intensity of all peaks decreased with the increase of the BPC loading content, indicating that there was no structural change of the g-C3N4 in the preparation process, and BPC was loaded in the g-C3N4 samples.
C stretching vibration mode in BPC aromatic ring. It could be clearly seen that the characteristic absorption peaks of BPC/g-C3N4 composites are almost the same as those of pure g-C3N4. We also observed that the intensity of all peaks decreased with the increase of the BPC loading content, indicating that there was no structural change of the g-C3N4 in the preparation process, and BPC was loaded in the g-C3N4 samples.
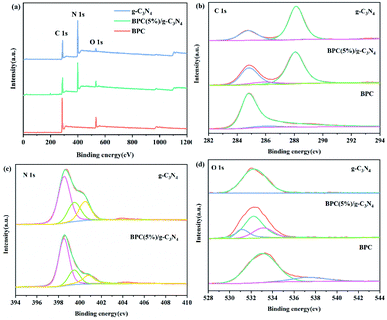
XPS was carried out to analyse the surface chemical composition and element state of the g-C3N4, BPC(5%)/g-C3N4 and BPC, and the XPS results were displayed in Fig. 2. The survey of XPS spectra (Fig. 2(a)) displayed the presence of C, N and a small amount of O in g-C3N4 and BPC(5%)/g-C3N4 and the presence of C and O in BPC. There were two typical characteristic peaks in the C 1s high resolution XPS spectra of pure g-C3N4 (Fig. 2(b)), which were assigned to the sp2 C–C bond at 284.8 eV and the N–C![[double bond, length as m-dash]](https://www.rsc.org/images/entities/char_e001.gif) N bond of the triazine rings at 288.1 eV.38,41 For the BPC(5%)/g-C3N4, The peak at 284.8 eV and 288.1 eV was ascribed to C–C bond and N–C
N bond of the triazine rings at 288.1 eV.38,41 For the BPC(5%)/g-C3N4, The peak at 284.8 eV and 288.1 eV was ascribed to C–C bond and N–C![[double bond, length as m-dash]](https://www.rsc.org/images/entities/char_e001.gif) N bond of the g-C3N4, respectively. The peak at 284.8 increased after the addition of BPC, which is attributed to the C–C bond of g-C3N4 and BPC. The peak at 286.1 eV was corresponded to π–π* shake-up bond of BPC,42 indicating that the BPC(5%)/g-C3N4 composite composed of the g-C3N4 and BPC. The N1s spectrum of the pure g-C3N4 (Fig. 2(c)) was divided into three peaks at 398.5, 399.5, and 400.5 eV, corresponding to the nitrogen atoms in the aromatic rings (C
N bond of the g-C3N4, respectively. The peak at 284.8 increased after the addition of BPC, which is attributed to the C–C bond of g-C3N4 and BPC. The peak at 286.1 eV was corresponded to π–π* shake-up bond of BPC,42 indicating that the BPC(5%)/g-C3N4 composite composed of the g-C3N4 and BPC. The N1s spectrum of the pure g-C3N4 (Fig. 2(c)) was divided into three peaks at 398.5, 399.5, and 400.5 eV, corresponding to the nitrogen atoms in the aromatic rings (C![[double bond, length as m-dash]](https://www.rsc.org/images/entities/char_e001.gif) N–C), tertiary nitrogen (N–(C)3), and C–N–H, respectively.43,44 For the BPC(5%)/g-C3N4 composite, the peaks of N 1s were slightly shifted to 398.6, 399.6 and 400.8 eV, respectively. This result suggested that the BPC(5%)/g-C3N4 composite not only composed of the g-C3N4 and BPC, but also has the interaction between the g-C3N4 and BPC. The O 1 s signal for the BPC(5%)/g-C3N4 located at about 530.7, 532.3 and 533.2 eV (Fig. 2(d)), which was corresponded to C
N–C), tertiary nitrogen (N–(C)3), and C–N–H, respectively.43,44 For the BPC(5%)/g-C3N4 composite, the peaks of N 1s were slightly shifted to 398.6, 399.6 and 400.8 eV, respectively. This result suggested that the BPC(5%)/g-C3N4 composite not only composed of the g-C3N4 and BPC, but also has the interaction between the g-C3N4 and BPC. The O 1 s signal for the BPC(5%)/g-C3N4 located at about 530.7, 532.3 and 533.2 eV (Fig. 2(d)), which was corresponded to C![[double bond, length as m-dash]](https://www.rsc.org/images/entities/char_e001.gif) O, N–C–O group and the adsorbed water. The binding energies of N–C–O group characteristic peaks shifted slightly compared with pure g-C3N4, which might attribute to the interactions between the BPC and g-C3N4.
O, N–C–O group and the adsorbed water. The binding energies of N–C–O group characteristic peaks shifted slightly compared with pure g-C3N4, which might attribute to the interactions between the BPC and g-C3N4.
The SEM and TEM images was carried out to further study the morphology and microstructures of the g-C3N4, BPC(5%)/g-C3N4 and BPC samples. As shown in Fig. 3(a), the SEM image showed that the pure g-C3N4 exhibits significantly aggregated blocky structure, and Fig. 3(b) showed that BPC has a massive structure with obvious holes on the surface. After processing by molten salt assisted thermal polycondensation method, as shown in Fig. 3(c), the morphology of pure g-C3N4 changes dramatically from massive to hollow tubular with the diameters of about 0.5 μm, and some strips are dispersed on its surface. Moreover, the TEM image of BPC(5%)/g-C3N4 as shown in Fig. 3(d), a homogeneous distribution of BPC loading on the external surface of g-C3N4 according to the difference between the images of BPC(5%)/g-C3N4 and BPC. It was obvious that (Fig. 3(e)) the TEM image of BPC displayed a pattern-like nanosheet structure with no lattice. The lattice fringes with an interplanar spacing of 0.41 nm in the TEM image (Fig. 3(f)) of the BPC(5%)/g-C3N4 sample corresponded to the (002) crystal plane of g-C3N4, and the shaded part corresponds to the BPC loaded on the surface of g-C3N4. It indicates that BPC is in close contact with g-C3N4 and successfully loaded on the surface of g-C3N4. This unique hollow tubular structure may enlarge the specific surface area and make more abundant active sites to improve the photocatalytic activity, which were also confirmed by XRD characterization.
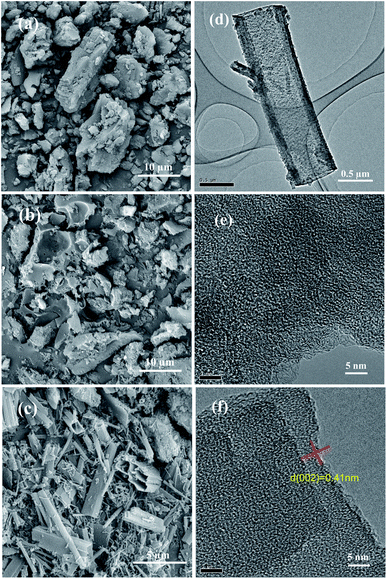 | ||
| Fig. 3 SEM images of the g-C3N4 (a), BPC (b) and BPC(5%)/g-C3N4 (c); TEM images of the BPC (e), BPC(5%)/g-C3N4 (d and f). | ||
Fig. 4 shows the N2 adsorption and desorption isotherms and pore size distribution curves of three samples. As shown in Fig. 4(a), The N2 adsorption–desorption isotherm for the BPC presented the typical type I isotherm, indicating that BPC had a micropore structure. Nevertheless, the shape of BPC(5%)/g-C3N4 isotherm was similar to g-C3N4, which both showed a typical type IV behavior, indicating that both of two samples had mesoporous structure. The shape of hysteresis loops of BPC(5%)/g-C3N4 isotherms displays the H3 type, while there was no obvious hysteresis loop in g-C3N4. It may be due to the changed the morphology and structure of the material caused by the addition of BPC. At the same time, as shown in Fig. 4(b), the pore size distribution of BPC(5%)/g-C3N4 shown that the pore size was mainly concentrated in the range of 3–4 nm, it was deduced that the BPC(5%)/g-C3N4 was mainly dominated by mesopores. Moreover, the corresponding structural parameters such as the specific surface area, the pore volume and the average pore diameter of the samples were shown in Table 1. Obviously, the g-C3N4 compounded with BPC could improve the pore volume and specific surface area, the average pore size became smaller indicating that the more active sites for adsorption and photocatalytic degradation was generated by the introduction of BPC. In addition, the t-plot data showed that the microporosity of BPC/g-C3N4 was higher than that of g-C3N4, it was caused by the reason that BPC with rich microporous structure was successfully loaded on g-C3N4.
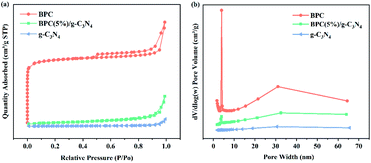 | ||
| Fig. 4 Nitrogen adsorption–desorption isotherms (a), pore size distribution curves (b) of the g-C3N4, BPC(5%)/g-C3N4 and BPC. | ||
| Material | BET surface area (m2 g−1) | Micropore surface area (m2 g−1) | Pore volume (cm3 g−1) | Micropore pore volume (cm3 g−1) | Average pore size (nm) |
|---|---|---|---|---|---|
| g-C3N4 | 5.23 | 0.22 | 0.01 | 0.0008 | 29.10 |
| BPC(5%)/g-C3N4 | 54.72 | 9.59 | 0.09 | 0.0041 | 16.07 |
| BPC | 1066.29 | 928.88 | 0.48 | 0.3592 | 10.03 |
Adsorption and photocatalytic activity
Fig. 5(a) and (b) shows the adsorption equilibrium curves and the Pseudo-second order kinetics plots and fitting lines of samples on OTC solution in dark conditions, respectively. As shown in Fig. 5(a), the adsorption capacity of the all samples showed an obviously increase in the first 40 min, then remained unchanged and achieved the adsorption equilibrium at about 60 min. Due to the specific surface area for the BPC/g-C3N4 composite is larger than pure g-C3N4, the OTC adsorption capacity of the BPC/g-C3N4 composites were much higher than that of pure g-C3N4. Among them, the sample of BPC(20%)/g-C3N4 composite exhibited the highest adsorption capacity of 1.4 mg g−1. Therefore, the dark adsorption time of the subsequent photocatalytic degradation experiment can be determined as 60 min by the adsorption equilibrium time.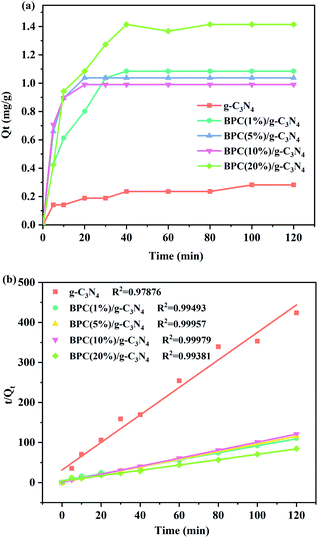 | ||
| Fig. 5 Adsorption equilibrium curves (a); Pseudo-second order kinetics plots and fitting lines (b) of OTC for the g-C3N4 and BPC(X%)/g-C3N4 composites under dark condition. | ||
The adsorption kinetics of the samples were tested to investigate adsorption behavior and the results were showed in Fig. 5(b). The experimental data of adsorption were fitted with pseudo-first-order model and pseudo-second-order model and the equations were expressed as follows:
ln(Qe − Qt) = ln![[thin space (1/6-em)]](https://www.rsc.org/images/entities/char_2009.gif) Qe − k1t Qe − k1t
| (3) |
 | (4) |
In order to further discuss the adsorption process, the adsorption isotherms for OTC on the samples was studied in the equilibrium experiments at 25 °C, pH 7 and 1 g l−1 adsorbents dosage. Moreover, the standard deviations of adsorption experimental data were all in the range of 6.3%, thus there was no obvious error in the experimental results. The Langmuir and Freundlich adsorption model were used to simulate the adsorption isotherm data and the equations were expressed as follows:
 | (5) |
 | (6) |
The Langmuir and Freundlich adsorption isotherms fitting parameters for OTC adsorption with the samples were presented in Table S2.† The obtained results showed that the correlation coefficient (R2) value of the Freundlich isotherm were larger than that of the Langmuir isotherm, which revealed that the adsorption isotherms for OTC on g-C3N4 and BPC/g-C3N4 were fitted well with Freundlich isotherm predicted, and the adsorption behavior seemed to be multilayer adsorption. The adsorption isothermal curves fitted by Langmuir and Freundlich models were shown in Fig. S1 and S2.† According to the Freundlich fitting results, the adsorption capacities of the BPC/g-C3N4 composites increased with the increasing loading content of BPC, which could be attributed to the larger specific surface area and pore volume.
The photocatalytic activities of pure g-C3N4 and BPC/g-C3N4 composites were evaluated by the photodegradation of OTC solution at room temperature under visible light irradiation. And the influence of loading content of BPC in BPC/g-C3N4 composite for OTC photocatalytic degradation was studied in Fig. 6(a). The standard deviation of all data is within 5.3%, which indicates that there is no significant error in the experiment. The results indicated that the degradation of OTC was negligible in the absence of samples and the pure g-C3N4 exhibited limited degradation rate of OTC, which were only 33.9% after 50 min irradiation respectively. It can be observed that the photocatalytic degradation of OTC on the BPC/g-C3N4 composites was more efficient than on pure g-C3N4 prepared in this work. According to the results, when the BPC loading content was 5%, the degradation efficiency is 83.9%, and the photocatalytic degradation ability of this product is the strongest. When the content was 1%, 10% and 20%, the degradation efficiency was reduced to 71.5%, 60.0% and 47.3% respectively. It could be deduced that the optimal loading content for BPC is 5%, which had a weaker adsorption capacity but a stronger photocatalytic degradation capacity, while BPC almost has no photocatalytic degradation capacity. Combined with the adsorption experiment shown in Fig. 5(a), it can be found that BPC/g-C3N4 composites with strong adsorption capacity cannot guarantee the higher photocatalytic activity. Although the adsorption capacity of BPC(20%)/g-C3N4 was the highest, the high content of BPC hindered the light absorption of g-C3N4 and reduced the photocatalytic performance, which was consistent with the results of UV-vis characterization. The results showed that the enhanced photocatalytic activity of BPC/g-C3N4 is due to its hollow tubular structure with high specific surface area, which can provide more active sites and inhibit the recombination of electron and photogenerated hole. On the other hand, BPC with excellent adsorption performance could enrich OTC around the composite material, making it quickly capture and easily degrade pollutants, increasing the reaction site of the material. As shown in Fig. 6(b), the pseudo-first-order kinetics was proved to fit well on the photocatalytic OTC degradation. It can be clearly seen that BPC(5%)/g-C3N4 has the highest first-order reaction rate constant (k) equal to 0.00884 min−1, which was 5.63 times higher than that of g-C3N4 (0.00157 min−1), indicating that the BPC(5%)/g-C3N4 has the best photocatalytic degradation efficiency.
The reusability is an important indicator in the practical application of photocatalyst. The results of photodegradation cycle experiments of BPC(5%)/g-C3N4 were showed in Fig. 6(c). After three cycles, the photocatalytic efficiency of BPC(5%)/g-C3N4 for OTC merely dropped from 84% to 73%. However, the photocatalytic efficiency decreased significantly in the fourth cycle experiment and the photodegradation efficiency reduced to 64% after five cycles, which could be attributed to that the excessive adsorption rate made the adsorption capacity for OTC larger than the photocatalytic degradation capacity, resulting in delayed photodegradation. In addition, the loss of samples during the fourth cycles would also affect the efficiency of reuse. All in all, the above results indicated that the property of BPC/g-C3N4 composite with good stability and reusability may be due to the compact structure by the interactions between the BPC and g-C3N4. At the same time, Fig. 6(d) shown that the XRD pattern of the BPC(5%)/g-C3N4 before and after 5 cycle photocatalytic was almost the same, it was also indicated that the photocatalyst has a relatively stable structure.
Photoelectrochemical performance analysis
In order to investigate the optical properties of pure g-C3N4, BPC/g-C3N4 and BPC, the UV-vis diffuse reflectance spectroscopy of the samples was shown in Fig. 7(a) and (b). As shown in Fig. 7(a), The response of pure carbon nitride to visible light (the absorption edge at around 430 nm) was consistent with previous reports.46 BPC performed a strong absorption almost in the whole range of the wavelengths from 220 to 800 nm, indicating that it can act as an active site to absorb and degrade OTC.45 The UV-vis DRS spectra of BPC/g-C3N4 were very similar to that of pure g-C3N4. In addition, the light absorption intensity of BPC/g-C3N4 increased gradually with the increasing of BPC loading content at the range of 220–800 nm. Furthermore, the absorption of BPC(X%)/g-C3N4 shifted red compared with pure g-C3N4, which suggested that the BPC/g-C3N4 composites have more visible light harvesting. Fig. 7(b) showed the band gap values of pure g-C3N4, BPC(X%)/g-C3N4 and BPC, the band gaps of the samples were calculated by using eqn (7) as follows:| ahv = A(hv − Eg)n/2 | (7) |
 | ||
| Fig. 7 UV-vis DRS (a), band gap curves (b) of the g-C3N4, BPC(X%)/g-C3N4 and BPC, Mott–Schottky plots of the g-C3N4 and BPC (c). | ||
As shown in Fig. 7(b), the band gaps of pure g-C3N4, BPC(1%)/g-C3N4, BPC(5%)/g-C3N4, BPC(10%)/g-C3N4, BPC(20%)/g-C3N4 was 2.67 eV, 2.56 eV, 2.44 eV, 2.33 eV and 2.21 eV, respectively. The results showed that the band gaps of the composites decrease as the BPC loading content increases, which indicated that BPC/g-C3N4 composites have higher separation efficiency of photogenerated electrons and photocatalytic activity. It is possible that the BPC loading content affects the specific surface area of the composite and thus increases the absorption of light by the material.
The electrochemical Mott–Schottky test was carried out with a frequency of 1000 Hz, and the results were given in Fig. 7(c). The positive slopes of Mott–Schottky results suggested that both the g-C3N4 and BPC are typical n-type semiconductors. And for n-type semiconductor, the flat band potentials (VFB) of g-C3N4 and BPC obtained from the x-axis intercept in the MS plot were determined to be about −1.45 V and −0.74 V (vs. Ag/AgCl), respectively. Furthermore, the conduction band potential (ECB) was almost similar to the flat band potential (VFB) based on the normal hydrogen electrode (NHE). Then the conduction band (CB) of g-C3N4 and BPC could be calculated to be −1.25 eV and −0.54 eV (vs.NHE).47,48 Similarly, the valence band (VB) values of g-C3N4 was calculated following formula:
| EVB = Eg + ECB | (8) |
In order to further investigate the separation and transfer efficiency of photogenerated carriers, the PL spectra were obtained under 355 nm excitation. As shown in Fig. 8(a), the PL emission intensity of BPC/g-C3N4 composite was lower than that of pure g-C3N4 exhibited, indicating that the BPC/g-C3N4 composite had the higher photogenerated e−–h+ pairs separation efficiency and excellent photocatalytic performance.51 Therefore, the weak intensity indicated that the load of BPC increased the specific surface area and brought a positive effect on restraining the recombination of the photogenerated e−–h+ pairs by trapping photo-excited electrons,52,53 so that the light-excited carriers could be transferred to the particle surface quickly, and then the carrier recombination was avoided. Besides, compare with pure g-C3N4, the PL peak of BPC(X%)/g-C3N4 also showed a blue-ward shifting, it was further demonstrated that the band gap value of the composites has changed.
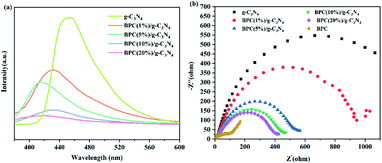 | ||
| Fig. 8 Photoluminance spectra (a) and Electrochemical Impedance Spectroscopy plots (b) of the g-C3N4 and BPC(X%)/g-C3N4. | ||
Electrochemical impedance spectroscopy (EIS) is an important indicator to measure carrier mobility. As shown in Fig. 8(b), the radius of BPC is the smallest of all samples, and the radius of the circular arc decreased with the increasing of BPC loading content compared to pure g-C3N4, indicating that the interfacial charge transfer resistance of BPC/g-C3N4 is lower and the separation efficiency is higher. This could be ascribed to the transfer of photoexcited electrons to BPC with lower ECB and accumulation on the CB of BPC, which significantly prohibited the recombination of e−–h+ pairs. This result is consistent with the PL plots.54
Photocatalytic mechanism
In order to reveal the main active species in the OTC photodegradation by BPC(5%)/g-C3N4, a series of radical trapping experiments were conducted employing EDTA, BQ and IPA as scavenge the holes (h+), superoxide radicals (˙O2−) and hydroxyl radicals (˙OH) radical scavenger, respectively. The Effects of different capture agents on OTC photodegradation by BPC(5%)/g-C3N4 was shown in the Fig. 9(a). It was seen clearly that the degradation rate was highest when there was no scavenger. The efficiency of the photocatalyst slightly decreases in the presence of IPA, suggesting that ˙OH played a less important role in the degradation process. However, when BQ and EDTA trapping agents were added, the photodegradation efficiency reduced significantly, and BQ had the most obvious quenching effect on the reaction. It was indicated that ˙O2− and h+ were the main oxidative species in the photocatalytic reaction.55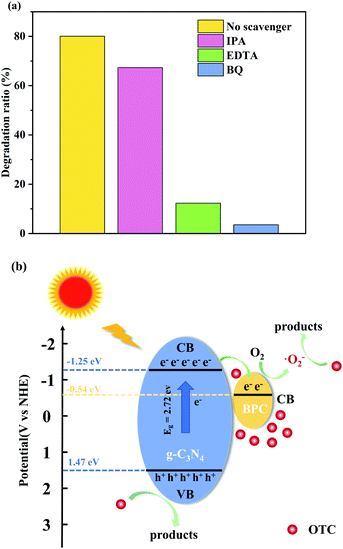 | ||
| Fig. 9 Effects of different capture agents on OTC photodegradation by BPC(5%)/g-C3N4 (a); The possible photocatalytic mechanism for the degradation of OTC under visible light irradiation (b). | ||
Based on the above analysis, the photocatalytic mechanism of BPC/g-C3N4 composites could be proposed as the Fig. 9(b). Firstly, BPC/g-C3N4 composite displays the hollow nanorod structure, which provided more active sites for pollutant adsorption and the reaction process. Furthermore, BPC loaded on g-C3N4 could act as an active site to enrich more OTC molecules around the material, thus leading to accelerating the photocatalytic reactions rates. Secondly, when the BPC/g-C3N4 was irradiated under visible light, g-C3N4 will be excited and its CB and VB will generate photoexcited electrons and holes. Then, the photoexcited electrons in the CB of g-C3N4 could easily transfer into the CB of BPC, which could remarkably improve the separation of photoinduced charge carriers, resulting in enhanced photodegradation efficiency.56 Subsequently, the photoexcited electrons accumulated on the CB of BPC were captured by O2 on the surface of the composite, then superoxide radicals (˙O2−) was generated and taken part in the OTC degradation process. While, the holes left on the VB of g-C3N4 could directly oxidize OTC molecules to decompose organic pollutants. Besides, since the weak oxidation ability with negative VB potential of g-C3N4 (1.44 eV vs. NHE) than that of both ˙OH/OH− (1.99 eV vs. NHE) and ˙OH/H2O (2.68 eV vs. NHE), the photoinduced holes cannot react with H2O or OH− to generate ˙OH radicals. Therefore, h+ and ˙O2−were the most important active species during the photocatalytic reaction, and ˙OH is not the main active species, which was confirmed by active species trapping experiment results. According to the above discussion, the probable reactions occurring in the photodegradation of OTC are:
| BPC/g-C3N4 + hv → e− + h+ | (9) |
| O2 + e− → ˙O2− | (10) |
| ˙O2− and h+ + OTC → products | (11) |
Conclusions
In conclusion, BPC was successfully loaded on g-C3N4 as an active site for by the salt – thermal polycondensation method. Compared to the traditional activated carbon load that mainly accelerate the transfer efficiency and accumulate of pollutants to assist g-C3N4 for improved photocatalysis, the loading of BPC could greatly inhibit the recombination of photogenerated electron/hole pairs due to its conduction band position. At the same time, the formation of hollow tubular structure increased the specific surface area of g-C3N4 and provides more active sites for the reaction. Results of the adsorption and photocatalytic test showed that the as-prepared photocatalyst BPC/g-C3N4 exhibited optimal removal efficiency for OTC when the BPC loading content was 5%, and the adsorption capacity and photocatalytic reaction rate were 3.67 and 5.63 times higher than that of the g-C3N4, respectively. This work clarified the importance of BPC as an active site in BPC/g-C3N4 photocatalyst towards the adsorption and photocatalytic degradation of pollutants, and it provide a new sight to design photocatalyst for antibiotic pollutants removing.Author contributions
Hekun Ding: investigation, data curation, formal analysis, writing-original draft preparation. Zheng Liu: conceptualization, methodology, funding acquisition, resource and supervision, writing-reviewing & editing. Qiongyue Zhang: investigation. Xiao He: investigation, data curation. Qingge Feng: funding acquisition, resource and supervision. Dongbo Wang: supervision. Dachao Ma: supervision.Conflicts of interest
There are no conflicts to declare.Acknowledgements
We acknowledged the financial support from the Guangxi Natural Science Foundation, China (Grant No. 2021GXNSFAA220049) and the National Key R&D Program of China (Grant No. 2018YFC1903201).Notes and references
- H. Che, G. Che, E. Jiang, C. Liu, H. Dong and C. Li, J. Taiwan Inst. Chem. Eng., 2018, 91, 224–234 CrossRef CAS.
- M. Jia, Z. Yang, H. Xu, P. Song, W. Xiong, J. Cao, Y. Zhang, Y. Xiang, J. Hu, C. Zhou, Y. Yang and W. Wang, Chem. Eng. J., 2020, 388, 124388 CrossRef CAS.
- R. Daghrir and P. Drogui, Environ. Chem. Lett., 2013, 11, 209–227 CrossRef CAS.
- A. Majumdar and A. Pal, Clean Technol. Environ. Policy, 2019, 22, 11–42 CrossRef.
- Z. Cai, A. D. Dwivedi, W.-N. Lee, X. Zhao, W. Liu, M. Sillanpää, D. Zhao, C.-H. Huang and J. Fu, Environ. Sci.: Nano, 2018, 5, 27–47 RSC.
- L. Lian, J. Lv and D. Lou, ACS Sustainable Chem. Eng., 2017, 5, 10298–10306 CrossRef CAS.
- R. Gothwal and T. Shashidhar, Environ. Sci.: Nano, 2015, 43, 479–489 CAS.
- B. Shao, Z. Liu, G. Zeng, Y. Liu, X. Yang, C. Zhou, M. Chen, Y. Liu, Y. Jiang and M. Yan, J. Hazard. Mater., 2019, 362, 318–326 CrossRef CAS PubMed.
- L. M. Chiesa, M. Nobile, S. Panseri and F. Arioli, Food Control, 2018, 91, 268–275 CrossRef CAS.
- Z. Long, Q. Li, T. Wei, G. Zhang and Z. Ren, J. Hazard. Mater., 2020, 395, 122599 CrossRef CAS PubMed.
- S. Wu, Z. Xu, J. Zhang and M. Zhu, Sol. RRL, 2021, 5, 2100668 CrossRef CAS.
- L. Cheng, Y. Tian and J. Zhang, J. Colloid Interface Sci., 2018, 526, 470–479 CrossRef CAS PubMed.
- M. J. F. Calvete, G. Piccirillo, C. S. Vinagreiro and M. M. Pereira, Coord. Chem. Rev., 2019, 395, 63–85 CrossRef CAS.
- R. Gusain, K. Gupta, P. Joshi and O. P. Khatri, Adv. Colloid Interface Sci., 2019, 272, 102009 CrossRef CAS PubMed.
- X. Zhao, D. Pan, X. Chen, R. Li, T. Jiang, W. Wang, G. Li and D. Y. C. Leung, Appl. Surf. Sci., 2019, 467–468, 658–665 CrossRef CAS.
- K. Wu, D. Chen, S. Lu, J. Fang, X. Zhu, F. Yang, T. Pan and Z. Fang, J. Hazard. Mater., 2020, 382, 121027 CrossRef CAS PubMed.
- X. Liang, G. Wang, X. Dong, G. Wang, H. Ma and X. Zhang, ACS Appl. Nano Mater., 2018, 2, 517–524 CrossRef.
- L. Ye, D. Wu, K. H. Chu, B. Wang, H. Xie, H. Y. Yip and P. K. Wong, Chem. Eng. J., 2016, 304, 376–383 CrossRef CAS.
- J. Feng, T. Chen, S. Liu, Q. Zhou, Y. Ren, Y. Lv and Z. Fan, J. Colloid Interface Sci., 2016, 479, 1–6 CrossRef CAS PubMed.
- M. Wu, J.-M. Yan, X.-w. Zhang and M. Zhao, Appl. Surf. Sci., 2015, 354, 196–200 CrossRef CAS.
- H. Zhang, W. Wu, Y. Li, Y. Wang, C. Zhang, W. Zhang, L. Wang and L. Niu, Appl. Surf. Sci., 2019, 465, 450–458 CrossRef CAS.
- H. Qin, W. Lv, J. Bai, Y. Zhou, Y. Wen, Q. He, J. Tang, L. Wang and Q. Zhou, J. Mater. Sci., 2018, 54, 4811–4820 CrossRef.
- Y. Huang, D. Li, Z. Fang, R. Chen, B. Luo and W. Shi, Appl. Catal., B, 2019, 254, 128–134 CrossRef CAS.
- S. Qi, R. Zhang, Y. Zhang, X. Liu and H. Xu, Inorg. Chem. Commun., 2021, 132, 108761 CrossRef CAS.
- W. Wang, L. Wang, W. Li, C. Feng, R. Qiu, L. Xu, X. Cheng and G. Shao, Mater. Lett., 2019, 234, 183–186 CrossRef CAS.
- Y. Tan, Z. Shu, J. Zhou, T. Li, W. Wang and Z. Zhao, Appl. Catal., B, 2018, 230, 260–268 CrossRef CAS.
- H. Dong, X. Zhang, J. Li, P. Zhou, S. Yu, N. Song, C. Liu, G. Che and C. Li, Appl. Catal., B, 2020, 263, 118270 CrossRef CAS.
- L. Pei, Y. Xu, J. Liu, J. Wu, Y. Han and X. Zhang, J. Am. Ceram. Soc., 2019, 102, 6517–6528 CrossRef CAS.
- W. Chen, M. Liu, X. Li and L. Mao, Appl. Surf. Sci., 2020, 512, 145782 CrossRef CAS.
- Z. Jin, Q. Zhang, S. Yuan and T. Ohno, RSC Adv., 2015, 5, 4026–4029 RSC.
- Z. Liu, X. He, X. Yang, H. Ding, D. Wang, D. Ma and Q. Feng, J. Mater. Sci., 2021, 56, 11248–11265 CrossRef CAS.
- N. Wang, X. Li, Y. Yang, T. Guo, X. Zhuang, S. Ji, T. Zhang, Y. Shang and Z. Zhou, Sep. Purif. Technol., 2019, 211, 673–683 CrossRef CAS.
- T.-T. Lim, P.-S. Yap, M. Srinivasan and A. G. Fane, Crit. Rev. Environ. Sci. Technol., 2011, 41, 1173–1230 CrossRef CAS.
- M. Chen, C. Guo, S. Hou, J. Lv, Y. Zhang, H. Zhang and J. Xu, Appl. Catal., B, 2020, 266, 118614 CrossRef CAS.
- S. Ghattavi and A. Nezamzadeh-Ejhieh, Composites, Part B, 2020, 183, 107712 CrossRef CAS.
- J. Barzegar, A. Habibi-Yangjeh, A. Akhundi and S. Vadivel, Solid State Sci., 2018, 78, 133–143 CrossRef CAS.
- K. Hu, R. Li, C. Ye, A. Wang, W. Wei, D. Hu, R. Qiu and K. Yan, J. Cleaner Prod., 2020, 253, 120055 CrossRef CAS.
- N. Liu, N. Lu, Y. Su, P. Wang and X. Quan, Sep. Purif. Technol., 2019, 211, 782–789 CrossRef CAS.
- Z. Feng, L. Zeng, Q. Zhang, S. Ge, X. Zhao, H. Lin and Y. He, J. Environ. Sci., 2020, 87, 149–162 CrossRef PubMed.
- S. Zhang, C. Hu, H. Ji, L. Zhang and F. Li, Appl. Surf. Sci., 2019, 478, 304–312 CrossRef CAS.
- H. Zhao, G. Li, F. Tian, Q. Jia, Y. Liu and R. Chen, Chem. Eng. J., 2019, 366, 468–479 CrossRef CAS.
- X. Li, S. Zhang, M. Zhang, M. Yu, H. Chen, H. Yang and Q. Xu, J. Hazard. Mater., 2021, 409, 124990 CrossRef CAS PubMed.
- X. Miao, X. Yue, Z. Ji, X. Shen, H. Zhou, M. Liu, K. Xu, J. Zhu, G. Zhu, L. Kong and S. A. Shah, Appl. Catal., B, 2018, 227, 459–469 CrossRef CAS.
- Y. Hong, C. Li, B. Yin, D. Li, Z. Zhang, B. Mao, W. Fan, W. Gu and W. Shi, Chem. Eng. J., 2018, 338, 137–146 CrossRef CAS.
- J. Shi, T. Chen, C. Guo, Z. Liu, S. Feng, Y. Li and J. Hu, Colloids Surf., A, 2019, 580, 123701 CrossRef CAS.
- C. Wu, S. Xue, Z. Qin, M. Nazari, G. Yang, S. Yue, T. Tong, H. Ghasemi, F. C. R. Hernandez, S. Xue, D. Zhang, H. Wang, Z. M. Wang, S. Pu and J. Bao, Appl. Catal., B, 2021, 282, 113528 Search PubMed.
- X. Li, B. Wang, X. Shu, D. Wang, G. Xu, X. Zhang, J. Lv and Y. Wu, RSC Adv., 2019, 9, 15900–15909 RSC.
- J. Pan, Z. Dong, B. Wang, Z. Jiang, C. Zhao, J. Wang, C. Song, Y. Zheng and C. Li, Appl. Catal., B, 2019, 242, 92–99 CrossRef CAS.
- M. Nouri, N. Zare-Dehnavi, F. Jamali-Sheini and R. Yousefi, Colloids Surf., A, 2020, 595, 102984 CrossRef.
- J. Cao, C. Pan, Y. Ding, W. Li, K. Lv and H. Tang, J. Environ. Chem. Eng., 2019, 7, 102984 CrossRef CAS.
- J. Jing, Z. Chen and C. Feng, Electrochim. Acta, 2019, 297, 488–496 CrossRef CAS.
- Y. Chen, X. He, D. Guo, Y. Cai, J. Chen, Y. Zheng, B. Gao and B. Lin, J. Energy Chem., 2020, 49, 214–223 CrossRef.
- J. Zhang, B. Jing, Z. Tang, Z. Ao, D. Xia, M. Zhu and S. Wang, Appl. Catal., B, 2021, 289, 120023 CrossRef CAS.
- W. M. A. El Rouby, A. E. A. Aboubakr, M. D. Khan, A. A. Farghali, P. Millet and N. Revaprasadu, Sol. Energy, 2020, 211, 478–487 CrossRef CAS.
- W. Wang, L. Zhu, P. Lv, J. Li and X. Zhao, Mater. Res. Bull., 2019, 110, 190–197 CrossRef CAS.
- M. Sun, Z.-L. He, C. Yuan, X. Wang, C. Zhai and M. Zhu, Ind. Eng. Chem. Res., 2021, 60, 762–770 CrossRef CAS.
Footnote |
| † Electronic supplementary information (ESI) available. See DOI: 10.1039/d1ra08615d |
| This journal is © The Royal Society of Chemistry 2022 |

