 Open Access Article
Praseodymia–titania mixed oxide supported gold as efficient water gas shift catalyst: modulated by the mixing ratio of oxides†
Weixuan Zhao‡
a,
Junjie Shi‡ *ab,
Mingyue Lincd,
Libo Suna,
Huijuan Sua,
Xun Suna,
Toru Murayama
 aef and
Caixia Qi
 *a
*a
aShandong Applied Research Centre of Gold Nanotechnology, School of Chemistry & Chemical Engineering, Yantai University, Yantai 264005, China. E-mail: qicx@ytu.edu.cn; junjieshiding@gmail.com
bDepartment of Chemical Engineering, University of Florida, Gainesville, Florida 32611, USA
cShanghai Environmental Protection Key Laboratory on Environmental Standard and Risk Management of Chemical Pollutants, East China University of Science and Technology, Shanghai 200237, China
dState Environmental Protection Key Laboratory of Environmental Risk Assessment and Control on Chemical Process, School of Resources and Environmental Engineering, East China University of Science and Technology, Shanghai, China
eResearch Center for Gold Chemistry, Department of Applied Chemistry for Environment, Graduate School of Urban Environmental Sciences, Tokyo Metropolitan University, 192-0397 Tokyo, Japan
fResearch Center for Hydrogen Energy-based Society, Department of Applied Chemistry for Environment, Graduate School of Urban Environmental Sciences, Tokyo Metropolitan University, Tokyo 192-0397, Japan
First published on 14th February 2022
Abstract
Modulating the active sites for controllable tuning of the catalytic activity has been the goal of much research, however, this remains challenging. The O vacancy is well known as an active site in reducible oxides. To modify the activity of O vacancies in praseodymia, we synthesized a series of praseodymia–titania mixed oxides. Varying the Pr![[thin space (1/6-em)]](https://www.rsc.org/images/entities/char_2009.gif) :
:![[thin space (1/6-em)]](https://www.rsc.org/images/entities/char_2009.gif) Ti mole ratio (2
Ti mole ratio (2![[thin space (1/6-em)]](https://www.rsc.org/images/entities/char_2009.gif) :
:![[thin space (1/6-em)]](https://www.rsc.org/images/entities/char_2009.gif) 1, 1
1, 1![[thin space (1/6-em)]](https://www.rsc.org/images/entities/char_2009.gif) :
:![[thin space (1/6-em)]](https://www.rsc.org/images/entities/char_2009.gif) 2, 1
2, 1![[thin space (1/6-em)]](https://www.rsc.org/images/entities/char_2009.gif) :
:![[thin space (1/6-em)]](https://www.rsc.org/images/entities/char_2009.gif) 1, 1
1, 1![[thin space (1/6-em)]](https://www.rsc.org/images/entities/char_2009.gif) :
:![[thin space (1/6-em)]](https://www.rsc.org/images/entities/char_2009.gif) 4) allows us to control the electronic interactions between Au, Pr and Ti cations and the local chemical environment of the O vacancies. These effects have been studied study by X-ray photoelectron spectroscopy (XPS), CO diffuse reflectance Fourier transform infrared spectroscopy (CO-DRIFTS) and temperature-programmed reduction (CO-TPR, H2-TPR). The water gas shift reaction (WGSR) was used as a benchmark reaction to test the catalytic performance of different praseodymia–titania supported Au. Among them, Au/Pr1Ti2Ox was identified to exhibit the highest activity, with a CO conversion of 75% at 300 °C, which is about 3.7 times that of Au/TiO2 and Au/PrOx. The Au/Pr1Ti2Ox also exhibited excellent stability, with the conversion after 40 h time-on-stream at 300 °C still being 67%. An optimal ratio of Pr content (Pr
4) allows us to control the electronic interactions between Au, Pr and Ti cations and the local chemical environment of the O vacancies. These effects have been studied study by X-ray photoelectron spectroscopy (XPS), CO diffuse reflectance Fourier transform infrared spectroscopy (CO-DRIFTS) and temperature-programmed reduction (CO-TPR, H2-TPR). The water gas shift reaction (WGSR) was used as a benchmark reaction to test the catalytic performance of different praseodymia–titania supported Au. Among them, Au/Pr1Ti2Ox was identified to exhibit the highest activity, with a CO conversion of 75% at 300 °C, which is about 3.7 times that of Au/TiO2 and Au/PrOx. The Au/Pr1Ti2Ox also exhibited excellent stability, with the conversion after 40 h time-on-stream at 300 °C still being 67%. An optimal ratio of Pr content (Pr![[thin space (1/6-em)]](https://www.rsc.org/images/entities/char_2009.gif) :
:![[thin space (1/6-em)]](https://www.rsc.org/images/entities/char_2009.gif) Ti 1
Ti 1![[thin space (1/6-em)]](https://www.rsc.org/images/entities/char_2009.gif) :
:![[thin space (1/6-em)]](https://www.rsc.org/images/entities/char_2009.gif) 2) is necessary for improving the surface oxygen mobility and oxygen exchange capability, a higher Pr content leads to more O vacancies, however with lower activity. This study presents a new route for modulating the active defect sites in mixed oxides which could also be extended to other heterogeneous catalysis systems.
2) is necessary for improving the surface oxygen mobility and oxygen exchange capability, a higher Pr content leads to more O vacancies, however with lower activity. This study presents a new route for modulating the active defect sites in mixed oxides which could also be extended to other heterogeneous catalysis systems.
1. Introduction
Metal oxides as one of the largest families of heterogeneous catalysts play a very important role in both industry application and academic research.1–6 The varieties in compositions, electronic and geometrical structures lead to a broad spectrum of chemical properties. Among them, redox ability is considered as the key characteristic of metal oxides which determines the activities in heterogeneous catalysis.1,5,7 The reducible oxides are usually considered as more active for the redox reactions, such as the CO oxidation, water gas shift reactions (WGSR) and reforming reactions.2,8 In most cases the reducible oxides follow a Mars–van Krevelen (MvK) mechanism in reaction.1,5,9 The key of the MvK mechanism is O from the oxide lattice can be removed and refilled.1,10 The fast O exchange ability is therefore considered as a prerequisite for high activity.Praseodymium oxide similar to ceria contains a mixed-valence state (Pr4+/Pr3+), which is reported to have the highest O mobility among the rare earth oxides (REOs) holds great promise in catalysis.10–15 Our recent work on Au/PrOx shows praseodymia is rich in O vacancies can facilitate H2O dissociation in the WGSR. However, the reactivity of Au/PrOx is not as high as expected (several times higher than Au/CeO2), although it has a relatively high O vacancy ratio (0.32).12 Zhou et al. also find the catalytic performances of some catalysts are not always increase with the concentration of O defects.16,17 One possible reason is that not all the O vacancies are the active sites, only those can balance the easy adsorbing of reactant molecules and desorbing of product molecules are the active sites.17 In fact, both the STM and DFT studies already prove that the O vacancies can be divided into different types according to their arrangements.18,19 For example, in the CeO2 single crystal, O vacancies are in the forms of an isolated single point, linear clusters and triangular trimers, which also correspond to different activities and stabilities.20
One of the benchmark reactions that is usually used for testing the O vacancies activities is the WGSR. Due to O vacancies on the oxide play a crucial role in facilitating H2O dissociation (limiting step) for the WGSR (Fig. 1).21 In addition, WGSR is known as an essential process for hydrogen generation and CO removal in various energy-related chemical operations.21–26 Recently, its potential application in proton-exchange membrane fuel cells (PEMFCs) for eliminating CO and simultaneously producing hydrogen has aroused great interest, especially after the discovery of gold/oxide system shows high performance for the low temperature (200–300 °C) WGSR by Flytzani-Stephanopoulos and co-workers. They proposed that the atomically dispersed nonmetallic Au or Pt is the active site for the WGSR. Inspired by this study, recently the single-site catalysts have become a very active frontier of heterogeneous catalysis.22,24–29
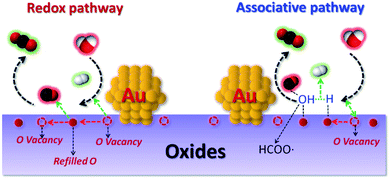 | ||
| Fig. 1 Schematic illustration of the redox and associative pathway with redox regeneration for the WGSR at metal/oxide interface sites. | ||
In order to further improve the efficiencies of supported catalyst, many attentions have been paid to synthesize single active site or modify the chemical environment of O vacancies on an oxide support.26,30–34 One effective way to modulate the local environment of the O vacancy is by doping heteroatoms.1,3,5,6 The substitution of a metal cation with another dopant will result in a direct change in the chemical environment and electronic structure of oxide.8 According to Stacchiola et al., the Ti4+ cations dopant can decrease the O vacancy formation energy in ceria, therefore leads to easier reduction of ceria–titania mixed oxides.6 The theoretical study indicates the incorporation of Ti into ceria induces half of the oxygen ions moving toward Ti4+ and the other half away from Ti4+ in Ce0.8Ti0.2O2 and high degrees of strain are introduced to the bulk lattices.6 The recent study on Pr–TiOx/nanoporous gold (npAu) shows Pr–TiOx mixed oxides functionalized npAu exhibits higher catalytic activity than PrOx/npAu and TiOx/npAu for the WGSR.11 Inspired by the inverse design catalyst, we are questioning if the Pr–TiOx mixed oxides supported Au can also show better catalytic activities in the WGSR in Fig. 1.15,35 As praseodymium oxide is rich in O vacancies, the praseodymia–titania mixed oxides are a good system to study these relationships between O vacancies chemical environment and catalytic activities, to the best of our knowledge, this has been rarely studied.
In this work, we employed a sol–gel method for preparing praseodymia–titania mixed oxides. Gold was then loaded using a modified deposition–precipitation method. The catalytic activity of Au/PraTibOx for the WGSR was studied in a plug-flow reactor. The structure of the catalysts was investigated with high-resolution transmission electron microscopy (HRTEM), high-angle annular dark-field imaging (HAADF) and energy-dispersive X-ray fluorescence (EDX) elemental mapping. The interactions of metal and support, as well as the metal cations inside the mixed oxides were examined by X-ray photoelectron (XPS) and CO diffuse reflectance Fourier transform infrared spectroscopy (CO-DRIFTS), which also gives information on changes in the chemical environment. The temperature-programmed desorption/reduction (CO-TPR, H2-TPR) were used to evaluate the surface oxygen exchange capability and reducibility of catalysts which was closely related to the reactivity of the surface O vacancy site. Altogether, this enabled us to explain the origin of the doping ratio's effect of mixed oxides on catalytic performance and to illustrate the importance of the special chemical environment of O vacancies in promoting the limiting step of H2O dissociation.
2. Experimental
2.1 Catalyst preparation
2.2 Catalyst characterization
Powder X-ray diffraction (XRD) analysis was carried out on a Rigaku SmartLab III using Cu Kα radiation (λ = 1.54184 Å, 40 mA and 40 kV) with a 2θ angle ranging from 10° to 80° and a scanning rate of 10° min−1. The gold content of in all catalysts was measured using an inductively coupled plasma-optical emission spectrometer (ICP-OES) with Agilent 5110 analyzer. The nitrogen adsorption–desorption isotherms were determined at −196 °C on a Micromeritics ASAP2020HD with pretreatment at 200 °C under vacuum for 3 h. Brunauer–Emmett–Teller (BET) equation was used to calculate the specific surface area. Pore size distribution was obtained from the desorption branch using the Barrett–Joyner–Halenda (BJH) method. Transmission electron microscopy (TEM) images and high-resolution TEM (HRTEM) images were performed on an FEI Talos F200X at an accelerating voltage of 200 kV. X-ray photoelectron spectra (XPS) measurements were recorded on a Thermo Scientific Escalab 250Xi equipped with Al Kα radiation (1486.6 eV). All binding energies were calibrated with the C 1s peak at 284.8 eV.Pulse CO chemisorption carried out on Micromeritics AutoChem II 2920 was used to get the dispersion of Au. Prior to chemisorption, the catalysts were treated in the reaction gas (2 vol% CO and 10 vol% H2O, N2 balance) at 300 °C for 2 h and then in a nitrogen stream at 200 °C for 90 min to remove the adsorbed reaction gases, followed by cooling down to room temperature in Ar.
To be noticed, the samples were first treated in the reaction gas (2 vol% CO and 10 vol% H2O) at 300 °C for 2 h to stabilize their chemical state, and about 100 mg of catalysts were used for the following experiments. Hydrogen temperature-programmed reduction (H2-TPR) was measured on a Micromeritics AutoChem II 2920 apparatus with a thermal conductivity detector (TCD). In a typical process, about 100 mg of catalysts were sealed in a quartz tube reactor and purged in He (50 mL min−1) atmosphere at 200 °C for 90 min to remove impurities on the surface. Then, the temperature was raised to 300 °C and pretreated in 20 vol% O2/He (50 mL min−1) for 60 min. After cooling down to room temperature, the analysis was carried out in a stream of 10 vol% H2/He (50 mL min−1) with a ramping rate of 10 °C min−1 up to 800 °C.
The temperature-programmed CO reduction (CO-TPR) was carried out in Bel Cata II. A Bel mass spectrometer was used to monitor CO2 (m/z = 44) and H2 (m/z = 2) formation at the exit. The catalysts were pretreated in He (30 mL min−1) atmosphere at 200 °C for 90 min and then oxidized in 20 vol% O2/He (30 mL min−1) for 60 min. The analysis was carried out in a stream of 10 vol% CO/He (30 mL min−1) from 50 to 800 °C at the rate of 10 °C min−1.
CO-DRIFTS spectra were collected on a JASCO FT/IR-6100 spectrometer equipped with a diffuse reflectance accessory (ST Japan Heat Chamber HC-500) and MCT detector. CO-DRIFTs spectra were recorded by accumulating 128 scans with a resolution of 4 cm−1. The sample was first purged under N2 (50 mL min−1) at the 120 °C for 1 h in the IR cell. After cooling down to −180 °C the background spectrum was recorded and subtracted. The CO adsorption was carried out at −180 °C with 3.84 vol% CO/He (50 mL min−1) for 30 min. Then N2 gas was introduced at −180 °C with a flow rate of 50 mL min−1 for 30 min to fully exclude the gas phase and weakly adsorbed CO species.36–38
To be noted most of the characterizations are done for the spent catalyst in order to more precisely reflecting the properties of catalysts especially under steady-state conditions. According to McFarland and Metiu, heterogeneous catalytic reactions are run under steady-state conditions instead of at equilibrium.2 It is difficult to accurately describe the catalytic performance of oxide catalysts using the property parameters of as-prepared catalysts, which are more likely to be in thermodynamic equilibrium during the preparation process.2
2.3 Catalyst evaluations
The water gas shift reaction (WGSR) was performed under atmospheric pressure in a continuous flow reactor and a temperature range within 150–400 °C. About 50 mg of powder catalysts were packed to quartz wool in a U-shaped tube reactor (8 mm I.D.). An online Agilent 7820A gas chromatograph was used to detect the gas composition in feed and product gas streams by a thermal conductivity detector (TCD). The catalysts without pretreatment were tested under the following condition: CO, 2 vol%; H2O, 10 vol%; N2 88 vol%; total gas flow, 45 mL min−1; gas hourly space velocity (GHSV), 54![[thin space (1/6-em)]](https://www.rsc.org/images/entities/char_2009.gif) 000 mL gcat−1 h−1. Water vapor was fed into the reactor by a temperature-controlled saturator. The evaluations were maintained for 30 min to obtain catalyst performance. Reaction kinetics and stability test were performed under the same reaction conditions as catalytic evaluations. The kinetic studies were carried out at differential reaction conditions and by changing the amount of catalysts the conversion rate was kept below 20%.
000 mL gcat−1 h−1. Water vapor was fed into the reactor by a temperature-controlled saturator. The evaluations were maintained for 30 min to obtain catalyst performance. Reaction kinetics and stability test were performed under the same reaction conditions as catalytic evaluations. The kinetic studies were carried out at differential reaction conditions and by changing the amount of catalysts the conversion rate was kept below 20%.
The CO conversion (XCO) was quantified using an area normalization method and determined by the degradation of CO gas following the equation:
The turnover frequencies (TOF) were calculated based on the following equation:
3. Results and discussion
3.1 Structural and morphological studies
XRD investigation shows that only anatase phase TiO2 is present in the Au/TiO2. No diffraction peaks correspond to either praseodymia or titania are observed in the praseodymia–titania mixed oxides supported Au, with a broad peak present at 30°, which indicates the praseodymia–titania mixed oxides mainly form an amorphous phase (Fig. S1†).12,39 Moreover, no distinct peaks of gold particles are observed on all samples, demonstrating the high Au dispersion (Fig. S1†). The BET data in Table 1 shows that the specific surface areas of Au/TiO2, Au/Pr1Ti4Ox and Au/Pr1Ti2Ox are in the range of 104–135 m2 g−1, while the Au/Pr2Ti1Ox has a specific surface area of 2 m2 g−1. Such low surface area is also found on the Au/Pr1Ti1Ox sample (2.3 m2 g−1, Table S1†), it reveals when the atomic ratio of praseodymium is over a half in the praseodymia–titania mixed oxides, the specific surface area will decrease sharply. The low surface area also leads to few exposed catalytic active sites, therefore low catalytic activity as indicated in catalytic performance (below). The bulk Au concentration measured by ICP-OES shows the Au loading varies from 0.46 wt% to 0.69 wt% on Au/TiO2, Au/Pr1Ti4Ox and Au/Pr1Ti2Ox, with Au/Pr2Ti1Ox shows the lowest loading of 0.24 wt%, which can also be attributed to the low specific surface area of Au/Pr2Ti1Ox result in few anchoring sites for Au. The XPS shows the surface atomic ratio of Pr![[thin space (1/6-em)]](https://www.rsc.org/images/entities/char_2009.gif) :
:![[thin space (1/6-em)]](https://www.rsc.org/images/entities/char_2009.gif) Ti for Au/Pr1Ti4Ox, Au/Pr1Ti2Ox and Au/Pr2Ti1Ox round 1
Ti for Au/Pr1Ti4Ox, Au/Pr1Ti2Ox and Au/Pr2Ti1Ox round 1![[thin space (1/6-em)]](https://www.rsc.org/images/entities/char_2009.gif) :
:![[thin space (1/6-em)]](https://www.rsc.org/images/entities/char_2009.gif) 3, 1
3, 1![[thin space (1/6-em)]](https://www.rsc.org/images/entities/char_2009.gif) :
:![[thin space (1/6-em)]](https://www.rsc.org/images/entities/char_2009.gif) 1.6 and 1.8
1.6 and 1.8![[thin space (1/6-em)]](https://www.rsc.org/images/entities/char_2009.gif) :
:![[thin space (1/6-em)]](https://www.rsc.org/images/entities/char_2009.gif) 1, respectively, which are close to the desired value (during synthesis), confirming the effectiveness of controlling the Pr
1, respectively, which are close to the desired value (during synthesis), confirming the effectiveness of controlling the Pr![[thin space (1/6-em)]](https://www.rsc.org/images/entities/char_2009.gif) :
:![[thin space (1/6-em)]](https://www.rsc.org/images/entities/char_2009.gif) Ti ratio by using the sol–gel method.
Ti ratio by using the sol–gel method.
| Samples | ICP Au loading (wt%) | SBET (m2 g−1) | XPS | ||
|---|---|---|---|---|---|
| Pr (atomic%) | Ti (atomic%) | Pr![[thin space (1/6-em)]](https://www.rsc.org/images/entities/char_2009.gif) : :![[thin space (1/6-em)]](https://www.rsc.org/images/entities/char_2009.gif) Ti real ratio Ti real ratio |
|||
| Au/TiO2 | 0.69 | 104 | — | 18.1 | — |
| Au/Pr1Ti4Ox | 0.46 | 135 | 2.5 | 7.5 | 1![[thin space (1/6-em)]](https://www.rsc.org/images/entities/char_2009.gif) : :![[thin space (1/6-em)]](https://www.rsc.org/images/entities/char_2009.gif) 3.0 3.0 |
| Au/Pr1Ti2Ox | 0.61 | 105 | 4.7 | 7.7 | 1![[thin space (1/6-em)]](https://www.rsc.org/images/entities/char_2009.gif) : :![[thin space (1/6-em)]](https://www.rsc.org/images/entities/char_2009.gif) 1.6 1.6 |
| Au/Pr2Ti1Ox | 0.24 | 2 | 4.9 | 2.7 | 1.8![[thin space (1/6-em)]](https://www.rsc.org/images/entities/char_2009.gif) : :![[thin space (1/6-em)]](https://www.rsc.org/images/entities/char_2009.gif) 1 1 |
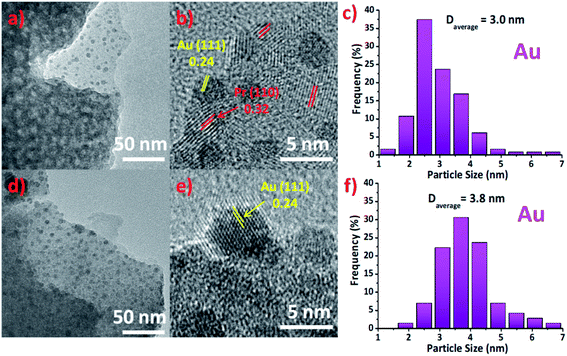
TEM images in Fig. 2(a) and (d) corresponding to Au/Pr1Ti2Ox and Au/Pr2Ti1Ox. As we can see the former can maintain the porous structure and nanosheet morphology, while the latter hardly have any pores. One explanation is that under the specific ratio (Pr![[thin space (1/6-em)]](https://www.rsc.org/images/entities/char_2009.gif) :
:![[thin space (1/6-em)]](https://www.rsc.org/images/entities/char_2009.gif) Ti = 2
Ti = 2![[thin space (1/6-em)]](https://www.rsc.org/images/entities/char_2009.gif) :
:![[thin space (1/6-em)]](https://www.rsc.org/images/entities/char_2009.gif) 1) the praseodymia–titania forming big aggregated particles. This is also in line with the nitrogen sorption analysis and explains why the Au/Pr2Ti1Ox exhibit such a small specific surface area (Fig. S2†). The HRTEM images of Au/Pr1Ti2Ox and Au/Pr2Ti1Ox in Fig. 2(b) and (e) display interplanar spacings of 0.24 nm and 0.32 nm, corresponding to the (111) plane of Au and (110) plane of Pr6O11, respectively.11,12,35,40–43 In addition, from Fig. 2(a) and (d) we can see the surface of nano-sheet are decorated with many small particles, which are attributed to be Au nanoparticles. The histogram analysis reveals that the Au nanoparticles have a mean size of about 3.0 ± 1.2 nm in the case of Au/Pr1Ti2Ox (Fig. 2(c)) and slightly bigger size of around 3.8 ± 1.5 nm in the case of Au/Pr2Ti1Ox (Fig. 2(f)). The Fig. 2(b) and (e) further indicates the arrangement of Au nanoparticles at the interfaces, with half of the Au atoms embedded into the supports. Similar to the observations on the nano-rod ceria supported Au catalyst, according to Shen et al., the interfacial surface oxygen vacancies on oxide support work as anchoring sites for Au nanoparticles facilitating its stabilization.44
1) the praseodymia–titania forming big aggregated particles. This is also in line with the nitrogen sorption analysis and explains why the Au/Pr2Ti1Ox exhibit such a small specific surface area (Fig. S2†). The HRTEM images of Au/Pr1Ti2Ox and Au/Pr2Ti1Ox in Fig. 2(b) and (e) display interplanar spacings of 0.24 nm and 0.32 nm, corresponding to the (111) plane of Au and (110) plane of Pr6O11, respectively.11,12,35,40–43 In addition, from Fig. 2(a) and (d) we can see the surface of nano-sheet are decorated with many small particles, which are attributed to be Au nanoparticles. The histogram analysis reveals that the Au nanoparticles have a mean size of about 3.0 ± 1.2 nm in the case of Au/Pr1Ti2Ox (Fig. 2(c)) and slightly bigger size of around 3.8 ± 1.5 nm in the case of Au/Pr2Ti1Ox (Fig. 2(f)). The Fig. 2(b) and (e) further indicates the arrangement of Au nanoparticles at the interfaces, with half of the Au atoms embedded into the supports. Similar to the observations on the nano-rod ceria supported Au catalyst, according to Shen et al., the interfacial surface oxygen vacancies on oxide support work as anchoring sites for Au nanoparticles facilitating its stabilization.44
A combined TEM (Fig. 3(a)), high-angle annular dark-field (HAADF) STEM images (Fig. 3(b)) and energy-dispersive spectroscopy (EDS) mapping (Fig. 3(c)–(f)) were used to determine the distribution of different components in Au/Pr1Ti2Ox catalyst. The STEM-EDS mapping of Pr (Fig. 3(e)) and Ti (Fig. 3(f)) show a homogeneous distribution in the catalysts, indicates praseodymia was successfully mixed with titanium rather than separated mixture which is also in line with the XRD study. The signal of Au (Fig. 3(d)) corresponds well with the position of the nanoparticles in the HAADF-STEM (Fig. 3(b)), further confirming that they are Au nanoparticles.
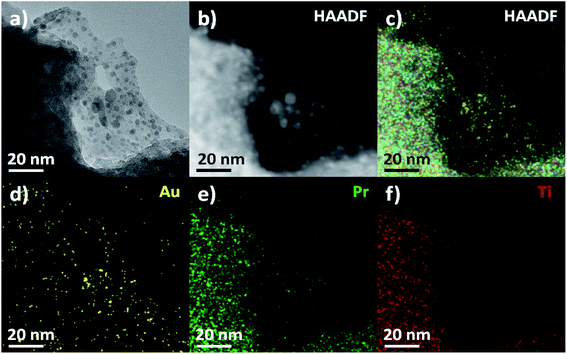 | ||
| Fig. 3 (a) TEM and (b) HAADF-STEM image of Au/Pr1Ti2Ox, (c–f) elemental distributions maps. Au (yellow), Pr (green), Ti (red). | ||
3.2 Catalytic performance
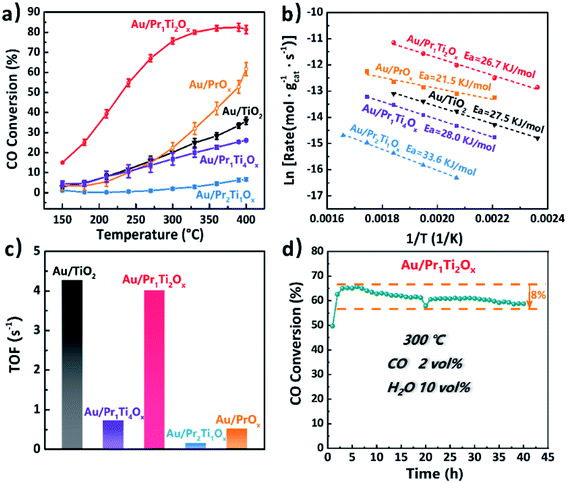
Catalytic performances of the Au/PraTibOx (Au/Pr1Ti4Ox, Au/Pr1Ti2Ox, Au/Pr1Ti1Ox and Au/Pr2Ti1Ox) and Au/TiO2 catalysts for WGSR were studied with a continuous flow reactor in the temperature range of 150–400 °C. The Au/Pr1Ti2Ox sample (Fig. 4(a)) exhibits exceptional high activities among the catalysts in the whole temperature range. Already at temperatures of 150 °C the catalytic conversion of water and CO is observed (Fig. 4(a)) over Au/Pr1Ti2Ox and around 15%. At 300 °C, the CO conversion rate over Au/Pr1Ti2Ox reached the highest point (75%), which is about 3.2 times that of Au/TiO2 (25%) and 2.7 times that of Au/PrOx (30%). The Au/Pr1Ti1Ox (Fig. S4†) and Au/Pr2Ti1Ox show very poor activity. Further increase the temperature to 400 °C instead leads to a slight decrease in the CO conversion rate. This is due to the WGSR is an exothermic reaction, at a high temperature which is thermodynamically unfavorable.25 In addition, after increasing or decreasing the atomic ratio of Pr in the praseodymia–titania mixed oxides corresponding to the Au/Pr2Ti1Ox and Au/Pr1Ti4Ox result in a drastically decrease in reactivity (Fig. 4(a)) of both catalysts. The control experiment pointed that pure PraTibOx and TiO2 were inactive for WGSR (CO conversion < 3%, 150–400 °C). We observed a similar behavior of catalysts in a simulate CO2 laser conditioned CO oxidation (CO2 60 vol%, CO 1 vol%, O2 0.5 vol%, H2O 0.5 vol%, N2 balanced) reaction, with the Au/Pr1Ti2Ox shows the highest CO conversion rate of 75% at 120 °C, while Au/Pr1Ti4Ox of 9% and Au/Pr2Ti1Ox almost no reactivity at the same temperature (more details will be reported in another paper). The different behaviors of the catalysts suggest that the nature of the oxide support especially the atomic ratio of Pr![[thin space (1/6-em)]](https://www.rsc.org/images/entities/char_2009.gif) :
:![[thin space (1/6-em)]](https://www.rsc.org/images/entities/char_2009.gif) Ti plays a key role in determining the catalytic activities. Still, the high activity of Au/Pr1Ti2Ox must be a result of a synergistic effect of Au species and the oxide support.
Ti plays a key role in determining the catalytic activities. Still, the high activity of Au/Pr1Ti2Ox must be a result of a synergistic effect of Au species and the oxide support.
The apparent activation energy (Ea, Fig. 4(b)) amounts to 21.5, 26.7, 27.5, 28.0, 33.6 kJ mol−1 for Au/PrOx, Au/Pr1Ti2Ox, Au/TiO2, Au/Pr1Ti4Ox and Au/Pr2Ti1Ox, these values are comparable to the values reported by Fu et al. and Si et al., with an Ea of 37 kJ mol−1 on Au/CeO2 and 32 kJ mol−1 on Au/(Ti–Ce)O2 mixed oxides, respectively.24,45 The relatively lower Ea on Au/Pr1Ti2Ox (26.7 kJ mol−1) highlights the benefits of using Pr1Ti2Ox mixed oxides as support.
The turn-over frequencies (TOF) were calculated to compare the WGSR activities with other reported catalysts. We assume that all Au atoms are active sites (Au dispersion measured by pulsed CO chemisorption). The bar plot in Fig. 4(c) displays the TOFs of the four catalysts at 300 °C. The order of TOFs follow the sequences of Au/TiO2 (4.27 s−1) > Au/Pr1Ti2Ox (4.02 s−1) > Au/Pr1Ti4Ox (0.72 s−1) > Au/Pr2Ti1Ox (0.15 s−1). The calculated TOF of Au/Pr1Ti2Ox is around 4.02 s−1 (300 °C), which is even higher than the nanoparticulate Au/CeO2 (1.27 s−1, at 350 °C) reported by Fu et al.24
In addition, we also tested the long-term stability of Au/Pr1Ti2Ox for WGSR at 300 °C under steady-state conditions. As one major obstacle that limiting the practical applications of Au-based catalysts is rapid deactivation caused by aggregation of Au species and/or blocking of the active sites with the accumulation of intermediates (carbonates).12,35,42,46 As indicated in Fig. 4(d), after 40 h continued time-on-stream test, the CO conversion rate only decreased from 65% to 57%. Compared with the reported catalysts so far, the Au/Pr1Ti2Ox is among the most stable catalysts.44 For example, Jia et al. found the reactivity of Au/CeOx decreased from 83% to 59% within 50 h even at lower T (250 °C).22
3.3 Investigations of electronic metal–support interaction
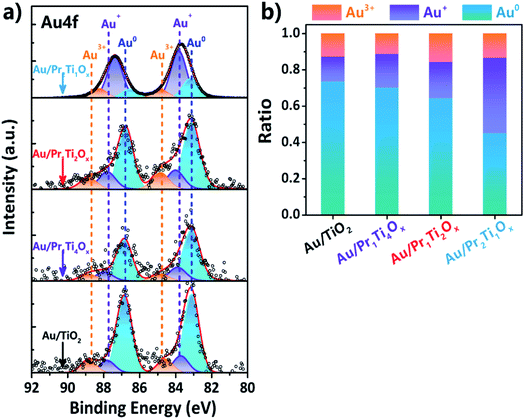
Fig. 5(a) shows the XPS spectra of Au 4f which is deconvoluted using a Gaussian fitting method. Two major peaks centered at 83.1 (Au 4f7/2) and 86.8 eV (Au 4f5/2) can be assigned to Au0.47 The amounts of Au0 are higher than 40% in all the samples after reaction as a result of the strong reducing atmosphere of WGSR, which is also in line with the findings of Si et al.45,48 The binding energy at 84.6 (Au 4f7/2) & 88.3 (Au 4f5/2) eV and 83.8 (Au 4f7/2) & 87.7 (Au 4f5/2) eV can be attributed to Au3+ and Au+, respectively.47,49 From Fig. 5(b) we can see the amount of ionic Au (Au+, 0.20; Au3+, 0.16) in Au/Pr1Ti2Ox is the higher compared with other samples (Au/Pr1Ti4Ox, 0.3; Au/TiO2, 0.27). The positively charged Au indicates there is electron transfer from Au to the oxide (PraTibOx and TiO2) support. According to Buergel et al. the charge state of gold plays a key role in influencing the binding of CO molecules, with cationic gold clusters can promote the CO adsorption through both an Eley–Rideal-like and Langmuir–Hinshelwood-like mechanism.50 In this work we demonstrate that by changing the oxide composition (Pr![[thin space (1/6-em)]](https://www.rsc.org/images/entities/char_2009.gif) :
:![[thin space (1/6-em)]](https://www.rsc.org/images/entities/char_2009.gif) Ti ratio) one can modify the electron transfer between the support and Au, therefore, control the content of ionic gold. This provides a new way to modulate the active sites in catalysts.
Ti ratio) one can modify the electron transfer between the support and Au, therefore, control the content of ionic gold. This provides a new way to modulate the active sites in catalysts.
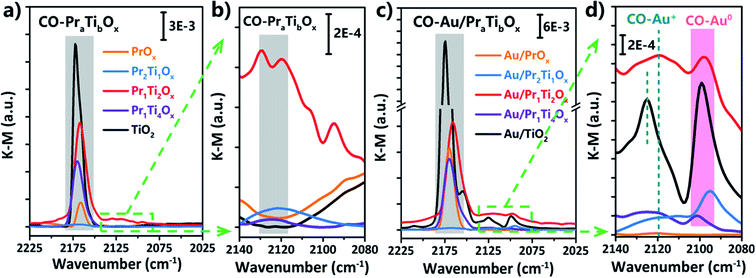
The DRIFT spectras of CO adsorption on Au/TiO2, Au/PrOx and Au/PraTibOx catalysts were used to further confirm the oxidation state of Au. As shown in Fig. 6(a), the absorption bands observed at v = 2168, 2166, 2170, 2174 and 2172 cm−1 can be assigned to CO adsorbed on the oxide support (TiO2, PrOx and PraTibOx). The bands at 2095, 2097, 2101 and 2099 cm−1 can be assigned to CO adsorbed on Au0 (Fig. 6(d)). The bands at 2122, 2120, 2123 and 2125 cm−1 can be assigned to CO adsorbed on Auδ+ (Fig. 6(d)).37 The CO adsorbed on PraTibOx also shows the band at 2122 cm−1, after loading Au on it (Au/PraTibOx), the peak intensity further increased indicates it is overlapped with the CO–Auδ+ band. Fig. 6(d) shows the enlarged CO–Auδ+ and CO–Au0 band on all the samples. As we can see the intensity of CO–Auδ+ and CO–Au0 band on Au/TiO2 are the highest followed by Au/Pr1Ti2Ox > Au/Pr2Ti1Ox > Au/Pr1Ti4Ox > Au/PrOx. From the literature we know it has been intensively disputed whether metallic (Au0) or ionic gold (cationic Auδ+ or anionic Auδ−) are the active site for WGSR.22,25,51 For example, Stere et al. used the in situ DRIFTS coupled with plasma activation method and pointed that metallic Au was the most stable and active species, the Auδ+ is less active for the WGSR in the Au/CeZrO4 catalyst.51 Jia et al. reported that CO–Au0 was not the active site for the WGSR due to its inferior ability for CO adsorption under the WGSR conditions. The CO–Auδ+ species at interfaces make the real contributions for the gold–ceria catalyst.22 While Wei et al. reported that the Auδ− induced through a strong electronic metal–support interaction (EMSI) between Au and TiO2−x acts as an active site for CO chemisorptions on the Au@TiO2−x/ZnO catalyst in WGSR.25 Based on the current work, it's hard to say whether pure Au0, Auδ+ and Auδ− are the active sites. But it can be sure that the CO adsorbed on Au or the Au-support interface indeed play an important role in WGSR, as CO can also adsorb on the pure oxides but almost no WGS reactivity on the pure oxides. Although the intensity of CO on Au/Pr1Ti2Ox is in medium among all the catalysts, it shows the highest reactivity. One explanation is that following the “Sabatier principle”, the CO should have the “just right” interactions with Au or Au-support interface which should neither too strong nor too weak, can easily react with the OH group in the following steps.
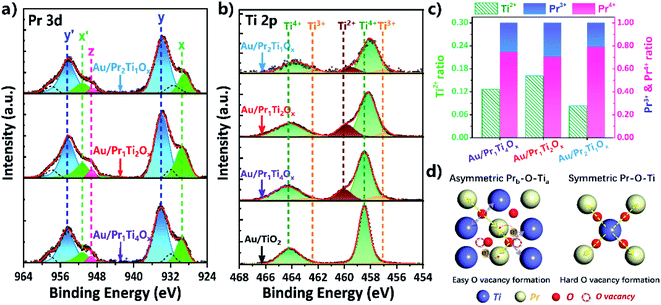
To further clarify the electronic interactions between Ti and Pr, we explored the valence changes in both Ti and Pr caused by the mixing of them. Fig. 7(a) and (b) shows the Pr 3d and Ti 2p XPS spectra of the Au/PraTibOx and Au/TiO2 catalysts after WGSR. Due to the complex nature of final-state effects in the Pr 3d systems (hybridization of 4f2 and 4f3L (L hole) and the multiple coupling of unpaired 4f electrons with 3d hole), distinguishing between Pr3+ and Pr4+ by XPS is challenging.9,13,14,52–54 The systematic studies of praseodymium oxides from Schaefer et al. point the peaks intensity increased at 973 and 949 eV after oxygen plasma treatment under UHV condition.52 The ratio of these peaks therefore can be used as a semi-quantitative probe for the amount of Pr3+ in the oxides (Fig. S3†). The two peaks centered at 954 and 934 eV due to hybridization of O 2p and Pr 4f can be attributed to Pr4+. The Ti 2p3/2 spectrum in Fig. 7(b) is deconvoluted into three peaks at 459.8, 458.5 and 457.2 eV, assigned to the Ti2+, Ti3+ and Ti4+ states, respectively.9,25,55,56
Fig. 7(c) depicts changes of Ti2+, Pr3+ and Pr4+ content with the mixing of Pr![[thin space (1/6-em)]](https://www.rsc.org/images/entities/char_2009.gif) :
:![[thin space (1/6-em)]](https://www.rsc.org/images/entities/char_2009.gif) Ti from 1
Ti from 1![[thin space (1/6-em)]](https://www.rsc.org/images/entities/char_2009.gif) :
:![[thin space (1/6-em)]](https://www.rsc.org/images/entities/char_2009.gif) 4 to 1
4 to 1![[thin space (1/6-em)]](https://www.rsc.org/images/entities/char_2009.gif) :
:![[thin space (1/6-em)]](https://www.rsc.org/images/entities/char_2009.gif) 2 and 2
2 and 2![[thin space (1/6-em)]](https://www.rsc.org/images/entities/char_2009.gif) :
:![[thin space (1/6-em)]](https://www.rsc.org/images/entities/char_2009.gif) 1. As we can see, the ratios of Ti2+ and Pr4+ following the same trend, with the Au/Pr1Ti2Ox has the highest amount of Ti2+ (0.16) and Pr3+ (0.30), also corresponding the lowest amount of Pr4+ (0.70). This can be explained by the interaction between Pr and Ti. It is known that in TiO2 the main cations are Ti4+, while in PrOx the majority of cations are Pr3+. As Ti4+ (0.745 Å) is smaller than Pr3+ (1.266 Å), it should have a stronger affinity to electrons, when both Ti4+ and Pr3+ coordinate with O (Ti–O–Pr).6,13,25 Electrons of O may tend to move to Ti, leading to the reduction of Ti4+ → Ti2+ (accompanied by the creation of O vacancies). Simultaneously, the O attracts more electrons from Pr for compensation result in the oxidation of Pr3+ to Pr4+. However, the content of Ti2+ and Pr4+ doesn't monotonously increase with the amount of Ti in the mixed oxides. This can be explained by an asymmetry effect of the chemical bonds in Fig. 7(d). Recently, Zhou and co-workers proposed that the asymmetric Ametal–O–(Bmetal)x led to easier O vacancy formation, which is accompanied by electron transformation between metals.17
1. As we can see, the ratios of Ti2+ and Pr4+ following the same trend, with the Au/Pr1Ti2Ox has the highest amount of Ti2+ (0.16) and Pr3+ (0.30), also corresponding the lowest amount of Pr4+ (0.70). This can be explained by the interaction between Pr and Ti. It is known that in TiO2 the main cations are Ti4+, while in PrOx the majority of cations are Pr3+. As Ti4+ (0.745 Å) is smaller than Pr3+ (1.266 Å), it should have a stronger affinity to electrons, when both Ti4+ and Pr3+ coordinate with O (Ti–O–Pr).6,13,25 Electrons of O may tend to move to Ti, leading to the reduction of Ti4+ → Ti2+ (accompanied by the creation of O vacancies). Simultaneously, the O attracts more electrons from Pr for compensation result in the oxidation of Pr3+ to Pr4+. However, the content of Ti2+ and Pr4+ doesn't monotonously increase with the amount of Ti in the mixed oxides. This can be explained by an asymmetry effect of the chemical bonds in Fig. 7(d). Recently, Zhou and co-workers proposed that the asymmetric Ametal–O–(Bmetal)x led to easier O vacancy formation, which is accompanied by electron transformation between metals.17
XPS spectroscopy was also used to study changes in surface oxygen vacancies, induced by mixing of Ti and Pr. According to Hyuntae et al., the O 1s could be deconvoluted into 3 peaks.57 The binding energy of around 529.5 eV is attributed to the lattice oxygen of Ti4+–O2 or Pr4+–O2.12,25,56 The peak at 533.5 eV can be ascribed to adsorbed (molecular) H2O (surface hydroxyl-like groups).57 Features near 531.7 eV originate from Pr3+–OH or Ti3+–OH, i.e., the reactant water dissociated on O vacancies (O#). As these species indicate the abundance of O#, they have also been labeled OV in the literature.57–59 In the current case, for the higher Pr amounts, the 531.7 eV peak mostly originates from Pr3+–OH (Fig. 8(a)).57
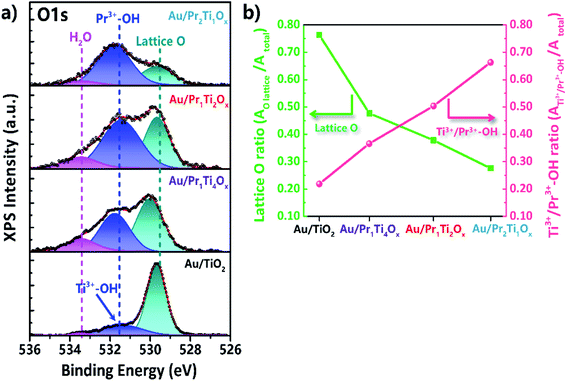 | ||
| Fig. 8 Photoemission (XPS) spectra of (a) O 1s and (b) plots of lattice O and Ti3+/Pr3+–OH ratios (peak area of O lattice/O total or Ti3+/Pr3+–OH/O total peak area). | ||
The ratio of surface oxygen vacancies and lattice O is compared in Fig. 8(b). It can be seen that after adding praseodymium into titanium oxide the O vacancies ratio increased greatly, meanwhile the ratio of lattice O decreased. With Au/Pr2Ti1Ox has the highest O vacancy ratio (0.68) followed by Au/Pr1Ti2Ox (0.50) > Au/Pr1Ti4Ox (0.38) > Au/TiO2 (0.22). The theory study points that O vacancies play a key role in H2O dissociation which is known as the limiting step for WGSR.60 Our catalytic test shows that Au/Pr1Ti2Ox has the highest catalytic activity, however, the Au/Pr1Ti4Ox exhibits much lower activity and the Au/Pr2Ti1Ox has almost no reactivity, although the latter two catalysts also contain a high amount of oxygen vacancies. This indicates other factors such as the chemical environment of oxygen vacancies play a more important role in determining its reactivity. According to Zhou et al. in the mixed oxides such as Ce1−xBixO2−δ the asymmetrical oxygen vacancies will be formed, which prefer to be filled by adsorbed oxygen species, due to a local charge balance or stable coordination for Ce4+.16 More importantly, the filled oxygen in these sites is also more easily to be released due to the asymmetric bonding effect.
The activity of surface O and OH was further investigated by H2-TPR and CO-TPR. The H2 TPR in Fig. 9(a) shows the H2 consumption peak on four catalysts. The reduction peak on Au/Pr1Ti2Ox appears at 88 °C, which is much lower than other samples such as Au/Pr2Ti1Ox at 183 and 310 °C, Au/Pr1Ti4Ox and Au/TiO2 at 123 °C. Moreover, the peak intensity is also much higher than other samples (2.4 times of Au/Pr1Ti4Ox and Au/TiO2). The relatively low T of H2 consumption on Au/Pr1Ti2Ox indicates the easy release of surface O. This can be attributed to two reasons: one is due to the weakening of Pr–O or Ti–O bond in Au/Pr1Ti2Ox caused by the asymmetrical chemical environment, the EXAFS and DFT studies by Dutta et al. show that substitution of Ce by another metal ion (Ti) can create disorder in the crystalline structure, resulting in the formation of weak long M–O bonds, similarly the distortion in Pr1Ti2Ox can also lead to the formation of long M–O bonds; the other one is the weakened O species bond contiguous to Au at the interface can further facilitates the O reduction.
After CO exposure, the CO-TPR (mass 44) in Fig. 9(b) shows that the CO2 desorption peaks can be divided into two groups, the low-temperature group (50–350 °C) and the high-temperature group (350–800 °C), they are accompanied by the evolution of hydrogen in Fig. 9(b) (mass 2). The H2 production can be ascribed to the WGSR from the adsorbed CO reacts with hydroxyl groups on the surface. As can be seen in Fig. 9(b) and (c), in the low-temperature range the amount of CO2 and H2 is also in line with catalytic test with Au/Pr1Ti2Ox is the highest followed with Au/TiO2 > Au/Pr1Ti4Ox > Au/Pr2Ti1Ox. No obvious H2 peak appears at the high-temperature range. Therefore, it could be due to the Au-catalyzed abstraction of the bulk lattice oxygen over oxides support by CO.
As illustrated in Fig. 10 after removing the active O species by CO (in WGSR) the asymmetrical O vacancy will be exposed. The asymmetrical O vacancy is energetically quite unstable tend to adsorb and dissociate H2O more easily compared with other types of O vacancies (like O vacancy clusters). To be noted the experimentally directly distinguish the asymmetrical O vacancy site are difficult, more works are still needed to be done.
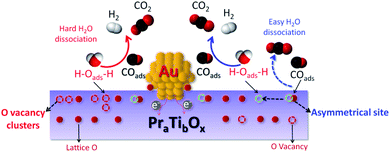 | ||
| Fig. 10 Schematic illustration of the H2O dissociation on the asymmetrical O vacancy site and the following steps for WGSR. | ||
In WGSR, CO will first react with the active surface O species, thereby exposing the asymmetrical oxygen vacancies, and which will absorb water molecular and dissociate it into H and OH groups. The generated OH groups can react with CO, yielding CO2 and H2 (final products of WGSR). The entire pathway is summarized below:
| CO(a) + O (asymmetrical site) → CO2 + O vacancy (asymmetrical) |
| H2O(a) + O vacancy (asymmetrical) → OH(a) + H(a) |
| CO(a) + OH(a) → HOCO(a) |
| HOCO(a) → CO2 + H(a) |
| 2H(a) → H2 |
4. Conclusions
In this work, praseodymia–titania solid solutions with different mixing ratios have been prepared via a sol–gel method. Au/Pr1Ti2Ox exhibits the better reaction rate (0.327 molCO molAu−1 s−1) in comparison to gold-based catalysts reported previously (Table 2).15,45,61–67 The TOFs of Au/Pr1Ti2Ox is as high as 4.02 s−1 at 300 °C and it also exhibits good long-term stability within the 40 h continues test only lost 8% activity (300 °C) in WGSR. The HRTEM and STEM revealed that the Au nanoparticles with the mean size of 3.0 ± 1.2 nm in Au/Pr1Ti2Ox are half embedded in the Pr2Ti1Ox support. By varying the Pr ratio in the mixed oxides, the valence state of the supported Au species (Au+ and Au) and the amount of Ti2+, Pr3+, Pr4+ changed, which corresponds to an electronic interaction of Au and PraTibOx and a valence compensation effect between Ti and Pr, respectively. CO-DRIFT confirmed the adsorption CO on Au and Au–support interfacial sites. The XPS study demonstrates by increasing the amount of Pr doping the number of oxygen vacancies increase, however, don't lead to the corresponding increase of the catalytic activity of Au/CeaPrbOx. This proved that the nature of or chemical environment the vacancy sites plays a more important role in affecting the catalytic activity rather than just their abundance. The H2-TPR confirms the easier removal of O species from Au/Pr1Ti2Ox due to the weakened Pr–O or Ti–O bond by the forming of an asymmetrical chemical environment. The exposed asymmetrical O vacancies due to reduction are more active, play a key role in the H2O dissociation in WGSR. This research provides a new way to design and modulate the active sites in catalysts from the point of adjusting the chemical environment and gives a comprehensive understanding of the structure–function relation of mixed oxides supported Au catalysts.| Catalysts | Au (wt%) | Temp. (°C) | Gas feed composition | Reaction rate (molCO molAu−1 s−1) | Ref. |
|---|---|---|---|---|---|
| Au/TiO2 | 1 | 300 | 2% CO–10% H2O–N2 | 0.077 | This work |
| Au/Pr1Ti4Ox | 1 | 300 | 2% CO–10% H2O–N2 | 0.092 | This work |
| Au/Pr1Ti2Ox | 1 | 300 | 2% CO–10% H2O–N2 | 0.327 | This work |
| Au/Pr2Ti1Ox | 1 | 300 | 2% CO–10% H2O–N2 | 0.022 | This work |
| Au/Pr(OH)x–M | 1 | 350 | 2% CO–10% H2O–N2 | 0.502 | 12 |
| Au/PrOx | 1 | 350 | 2% CO–10% H2O–N2 | 0.024 | 12 |
| Au/CeO2 | 4.7 | 250 | 11% CO–26% H2O–26% H2–7% CO2–He | 0.127 | 24 |
| Au@TiO2−x/ZnO | 2 | 250 | 6% CO–25% H2O–Ar | 0.150 | 25 |
| Au/TiO2 | 2 | 227 | 1% CO–3% H2O–He | 0.030 | 45 |
| Au/CeO2 | 3 | 163 | 4.5% CO–13.5% H2O–He | 0.033 | 61 |
| Au/TiO2 | 2.3 | 120 | 6.8% CO–11% H2O–37.5% H2–8.6% CO2 | 0.011 | 62 |
| Au/α-Mo2C | 2 | 150 | 11% CO–26% H2O–26% H2–7% CO2–N2 | 1.050 | 63 |
| Au/Mo2C | 1.5 | 120 | 7% CO–22% H2O–8.5% CO2–37% H2–Ar | 0.020 | 64 |
| Au/TiO2−x | 1.95 | 200 | 6% CO–25% H2O–Ar | 0.040 | 65 |
| Au/ZrO2–H2 | 3.8 | 210 | 6.25% CO–50% H2O–N2 | 0.405 | 66 |
| Au/CeFeAl | 2.17 | 250 | 4.5% CO–30% H2O–N2 | 0.026 | 67 |
Author contributions
Weixuan Zhao performed the preparation of catalysts, doing the catalysis test. The BET, ICP, TEM and XPS characterizations were performed in Shiyanjia Lab (https://www.shiyanjia.com). Junjie Shi and Weixuan Zhao wrote the manuscript, prepared the figures and analyzed the data. Junjie Shi designed and supervised the project. MingYue Lin and Toru Murayama helped with CO-DRIFTS characterization and analysis. Libo Sun, Xun Sun and Huijuan Su helped modify the manuscript. Caixia Qi involved in the modification of the manuscript and provided great support for the project.Conflicts of interest
The authors declare no conflict of interest.Acknowledgements
Junjie Shi gratefully acknowledges the financial support of the National Science Foundation of China for Young Scholar (21902141) and the Natural Science Foundation of Shandong Province (ZR2018QB006). We also acknowledge the financial supports from the Collaborative Innovation Center of Light Hydrocarbon Transformation and Utilization of Yantai University.References
- A. Puigdollers, P. Schlexer, S. Tosoni and G. Pacchioni, ACS Catal., 2017, 7, 6493–6513 CrossRef.
- E. McFarland and H. Metiu, Chem. Rev., 2013, 113, 4391–4427 CrossRef CAS PubMed.
- I. Wachs and K. Routray, ACS Catal., 2012, 2, 1235–1246 CrossRef CAS.
- J. Sattler, J. Ruiz-Martinez, E. Santillan-Jimenez and B. Weckhuysen, Chem. Rev., 2014, 114, 10613–10653 CrossRef CAS PubMed.
- I. Ro, J. Resasco and P. Christopher, ACS Catal., 2018, 8, 7368–7387 CrossRef CAS.
- D. Stacchiola, S. D. Senanayake, P. Liu and J. A. Rodriguez, Chem. Rev., 2013, 113, 4373–4390 CrossRef CAS PubMed.
- F. Polo-Garzon, Z. Bao, X. Zhang, W. Huang and Z. Wu, ACS Catal., 2019, 9, 5692–5707 CrossRef CAS.
- M. Ganduglia-Pirovano, A. Hofmann and J. Sauer, Surf. Sci. Rep., 2007, 62, 219–270 CrossRef CAS.
- Q. Xiao, Y. Wang, Z. Zhao, C. Pei, S. Chen, L. Gao, R. Mu, Q. Fu and J. Gong, Sci. China: Chem., 2020, 63, 1323–1330 CrossRef CAS.
- P. Sonström, J. Birkenstock, Y. Borchert, L. Schilinsky, P. Behrend, K. Gries, K. Müller, A. Rosenauer and M. Bäumer, ChemCatChem, 2010, 2, 694–704 CrossRef.
- J. Shi, A. Wittstock, C. Mahr, M. Murshed, T. Gesing, A. Rosenauer and M. Bäumer, Phys. Chem. Chem. Phys., 2019, 21, 3278–3286 RSC.
- J. Shi, H. Li, W. Zhao, P. Qi and H. Wang, Catal. Sci. Technol., 2020, 10, 7291–7301 RSC.
- G. Niu, M. Zoellner, T. Schroeder, A. Schaefer, J. Jhang, V. Zielasek, M. Bäumer, H. Wilkens, J. Wollschlager, R. Olbrich, C. Lammers and M. Reichling, Phys. Chem. Chem. Phys., 2015, 17, 24513–24540 RSC.
- H. Wilkens, S. Gevers, S. Röhe, A. Schaefer, M. Bäumer, M. Zoellner, T. Schroeder and J. Wollschläger, J. Phys. Chem. C, 2014, 118, 3056–3061 CrossRef CAS.
- J. Shi, H. Li, A. Genest, W. Zhao, P. Qi, T. Wang and G. Rupprechter, Appl. Catal., B, 2022, 301, 120789 CrossRef CAS.
- K. Yu, D. Lei, Y. Feng, H. Yu, Y. Chang, Y. Wang, Y. Liu, G. Wang, L. Lou, S. Liu and W. Zhou, J. Catal., 2018, 365, 292–302 CrossRef CAS.
- K. Yu, L. Lou, S. Liu and W. Zhou, Adv. Sci., 2020, 7, 1901970 CrossRef CAS PubMed.
- Z. Han, Y. Yang, B. Zhu, M. Ganduglia-Pirovano and Y. Gao, Phys. Rev. Mater., 2018, 2, 035802 CrossRef CAS.
- M. Wolf, C. Castleton, K. Hermansson and J. Kullgren, Front. Chem., 2019, 7, 212 CrossRef CAS PubMed.
- J. Kullgren, M. Wolf, C. Castleton, P. Mitev, W. Briels and K. Hermansson, Phys. Rev. Lett., 2014, 112, 156102 CrossRef CAS PubMed.
- S. Rodriguez, P. Liu, J. Hrbek, J. Evans and M. Pérez, Science, 2007, 318, 1757–1759 CrossRef PubMed.
- X. Fu, L. Guo, W. Wang, C. Ma, C. Jia, K. Wu, R. Si, L. Sun and C. Yan, J. Am. Chem. Soc., 2019, 141, 4613–4623 CrossRef CAS PubMed.
- J. Rodriguez, P. Liu, J. Hrbek, J. Evans and M. Perez, Angew. Chem., Int. Ed., 2007, 46, 1329–1332 CrossRef CAS PubMed.
- Q. Fu, H. Saltsburg and M. Flytzani-Stephanopoulos, Science, 2003, 301, 935–938 CrossRef CAS PubMed.
- N. Liu, M. Xu, Y. Yang, S. Zhang, J. Zhang, W. Wang, L. Zheng, S. Hong and M. Wei, ACS Catal., 2019, 9, 2707–2717 CrossRef CAS.
- L. Sun, J. Xu, X. Liu, B. Qiao, L. Li, Y. Ren, Q. Wan, J. Lin, S. Lin, X. Wang, H. Guo and T. Zhang, ACS Catal., 2021, 11, 5942–5950 CrossRef CAS.
- J. Dong, Q. Fu, Z. Jiang, B. Mei and X. Bao, J. Am. Chem. Soc., 2018, 140, 13808–13816 CrossRef CAS PubMed.
- J. Yang, X. Wang, Y. Qu, X. Wang, H. Huo, Q. Fan, J. Wang, L. Yang and Y. Wu, Adv. Energy Mater., 2020, 10, 2001709 CrossRef CAS.
- X. Wang and L. Yang, Appl. Surf. Sci., 2022, 576, 151839 CrossRef CAS.
- M. Zhu, C. Zhao, X. Liu, X. Wang, F. Zhou, J. Wang, Y. Hu, Y. Zhao, T. Yao, L. Yang and Y. Wu, ACS Catal., 2021, 11, 3923–3929 CrossRef CAS.
- X. Wang and L. Yang, J. Mater. Chem. A, 2022, 10, 1481–1496 RSC.
- J. Yang, Z. Wang, C. Huang, Y. Zhang, Q. Zhang, C. Chen, J. Du, X. Zhou, Y. Zhang, H. Zhou, L. Wang, X. Zheng, L. Gu, L. Yang and Y. Wu, Angew. Chem., Int. Ed., 2021, 60, 22722–22728 CrossRef CAS PubMed.
- C. Huang, G. Li, L. Yang and E. Ganz, ACS Appl. Mater. Interfaces, 2021, 13, 608–621 CrossRef CAS PubMed.
- M. Zhao, B. Song and L. Yang, ACS Appl. Mater. Interfaces, 2021, 13, 26109–26122 CrossRef CAS PubMed.
- J. Shi, C. Mahr, M. Murshed, V. Zielasek, A. Rosenauer, T. Gesing, M. Bäumer and A. Wittstock, Catal. Sci. Technol., 2016, 6, 5311–5319 RSC.
- M. Lin, B. An, N. Niimi, Y. Jikihara, T. Nakayama, T. Honma, T. Takei, T. Shishido, T. Ishida, M. Haruta and T. Murayama, ACS Catal., 2019, 9, 1753–1756 CrossRef CAS.
- M. Lin, C. Mochizuki, B. An, Y. Inomata, T. Ishida, M. Haruta and T. Murayama, ACS Catal., 2020, 10, 9328–9335 CrossRef CAS.
- M. Lin, C. Mochizuki, B. An, T. Honma, M. Haruta, T. Ishida and T. Murayama, J. Catal., 2020, 389, 9–18 CrossRef CAS.
- W. Li, F. Wang, S. Feng, J. Wang, Z. Sun, B. Li, Y. Li, J. Yang, A. Elzatahry, Y. Xia and D. Zhao, J. Am. Chem. Soc., 2013, 135, 18300–18303 CrossRef CAS PubMed.
- T. Andana, M. Piumetti, S. Bensaid, L. Veyre, C. Thieuleux, N. Russo, D. Fino, E. Quadrelli and R. Pirone, Appl. Catal., B, 2018, 226, 147–161 CrossRef CAS.
- L. Jiang, S. Fernandez-Garcia, M. Tinoco, Z. Yan, Q. Xue, G. Blanco, J. Calvino, A. Hungria and X. Chen, ACS Appl. Mater. Interfaces, 2017, 9, 18595–18608 CrossRef CAS PubMed.
- J. Shi, A. Schaefer, A. Wichmann, M. Murshed, T. Gesing, A. Wittstock and M. Bäumer, J. Phys. Chem. C, 2014, 118, 29270–29277 CrossRef CAS.
- J. Shi, C. Mahr, M. Murshed, T. M. Gesing, A. Rosenauer, M. Bäumer and A. Wittstock, Phys. Chem. Chem. Phys., 2017, 19, 8880–8888 RSC.
- N. Ta, J. Liu, S. Chenna, P. Crozier, Y. Li, A. Chen and W. Shen, J. Am. Chem. Soc., 2012, 134, 20585–20588 CrossRef CAS PubMed.
- R. Si, J. Tao, J. Evans, J. Park, L. Barrio, J. Hanson, Y. Zhu, J. Hrbek and J. Rodriguez, J. Phys. Chem. C, 2012, 116, 23547–23555 CrossRef CAS.
- W. Deng and M. Flytzani-Stephanopoulos, Angew. Chem., Int. Ed., 2006, 45, 2285–2289 CrossRef CAS PubMed.
- Y. Zhang, J. Zhang, B. Zhang, R. Si, B. Han, F. Hong, Y. Niu, L. Sun, L. Li, B. Qiao, K. Sun, J. Huang and M. Haruta, Nat. Commun., 2020, 11, 558 CrossRef CAS PubMed.
- T. Murayama and M. Haruta, Chin. J. Catal., 2016, 37, 1694–1701 CrossRef CAS.
- S. Wei, X. Fu, W. Wang, Z. Jin, Q. Song and C. Jia, J. Phys. Chem. C, 2018, 122, 4928–4936 CrossRef CAS.
- C. Buergel, N. Reilly, G. Johnson, R. Mitric, M. Kimble, A. Castleman and V. Bonacic-Kouteckv, J. Am. Chem. Soc., 2008, 130, 1694–1698 CrossRef CAS PubMed.
- C. Stere, J. Anderson, S. Chansai, J. Delgado, A. Goguet, W. Graham, C. Hardacre, S. Taylor, X. Tu, Z. Wang and H. Yang, Angew. Chem., Int. Ed., 2017, 56, 5579–5583 CrossRef CAS PubMed.
- A. Schaefer, S. Gevers, V. Zielasek, T. Schroeder, J. Falta, J. Wollschlager and M. Bäumer, J. Chem. Phys., 2011, 134, 054701 CrossRef CAS PubMed.
- S. Lutkehoff, M. Neumann and A. Slebarski, Phys. Rev. B: Condens. Matter Mater. Phys., 1995, 52, 13808–13811 CrossRef PubMed.
- H. Ogasawara, A. Kotani, R. Potze, G. Sawatzky and B. Thole, Phys. Rev. B: Condens. Matter Mater. Phys., 1991, 44, 5465–5469 CrossRef CAS PubMed.
- D. Wang, J. Huang, F. Liu, X. Xu, X. Fang, J. Liu, Y. Xie and X. Wang, Catal. Today, 2020, 339, 220–232 CrossRef CAS.
- B. Bharti, S. Kumar, H. N. Lee and R. Kumar, Sci. Rep., 2016, 6, 32355 CrossRef CAS PubMed.
- H. Sohn, G. Celik, S. Gunduz, D. Dogu, S. Zhang, J. Shan, F. Tao and U. Ozkan, Catal. Lett., 2017, 147, 2863–2876 CrossRef CAS.
- C. Wen, Y. Zhu, Y. Ye, S. Zhang, F. Cheng, Y. Liu, P. Wang and F. Tao, ACS Nano, 2012, 6, 9305–9313 CrossRef CAS PubMed.
- Z. Liu, T. Duchon, H. Wang, D. Grinter, I. Waluyo, J. Zhou, Q. Liu, B. Jeong, E. Crumlin, V. Matolin, D. Stacchiola, J. Rodriguez and S. Senanayake, Phys. Chem. Chem. Phys., 2016, 18, 16621–16628 RSC.
- K. Sun, M. Kohyama, S. Tanaka and S. Takeda, J. Phys. Chem. C, 2017, 121, 12178–12187 CrossRef CAS.
- F. Vindigni, M. Manzoli, T. Tabakova, V. Idakiev, F. Boccuzzi and A. Chiorino, Phys. Chem. Chem. Phys., 2013, 15, 13400–13408 RSC.
- J. Wang, V. Kispersky, W. Delgass and F. Ribeiro, J. Catal., 2012, 289, 171–178 CrossRef CAS.
- S. Yao, Z. Xiao, Z. Wu, G. Rui, W. Xu, Y. Ye, L. Lin, X. Wen, P. Liu and B. Chen, Science, 2017, 357, 389 CrossRef CAS PubMed.
- K. Sabnis, Y. Cui, M. Akatay, M. Shekhar, W. Lee, J. Miller, W. Delgass and F. Ribeiro, J. Catal., 2015, 331, 162–171 CrossRef CAS.
- P. Yin, J. Yu, L. Wang, J. Zhang, Y. Jie, L. Chen, X. Zhao, H. Feng, Y. Yang, M. Xu, X. Zhang, J. Han, H. Yan and M. Wei, J. Phys. Chem. C, 2021, 125, 20360–20372 CrossRef CAS.
- L. Song, X. Cao and L. Li, ACS Appl. Mater. Interfaces, 2018, 10, 31249–31259 CrossRef CAS PubMed.
- M. Castaño, T. Reina, S. Ivanova, M. Centeno and J. Odriozola, J. Catal., 2014, 314, 1–9 CrossRef.
Footnotes |
| † Electronic supplementary information (ESI) available. See DOI: 10.1039/d1ra08572g |
| ‡ These authors contributed equally to this work. |
| This journal is © The Royal Society of Chemistry 2022 |


