DOI:
10.1039/D1RA08243D
(Paper)
RSC Adv., 2022,
12, 228-240
Effect of ethylenediamine on CMP performance of ruthenium in H2O2-based slurries
Received
10th November 2021
, Accepted 14th December 2021
First published on 21st December 2021
Abstract
With the aggressive scaling of integrated circuits, ruthenium has been proposed as the next generation barrier material to replace the conventional bilayer of tantalum and tantalum nitride due to its properties such as allowing direct copper electrodeposition. In this work, the effect of ethylenediamine (EDA) on the chemical mechanical polishing (CMP) properties of ruthenium in H2O2-based slurries was investigated. The results show that EDA or H2O2 alone has little effect, but the combined use of EDA and H2O2 significantly enhances the removal rate of ruthenium. Subsequently, the mechanism of action of ruthenium removal promoted by EDA was studied by combining CMP experiments, electrochemical experiments and surface chemical characterization methods. It is indicated that EDA molecules react with ruthenium oxide (not ruthenium metal) to generate a large number of complexes, which promotes the dissolution of ruthenium oxides and the corrosion of ruthenium. More importantly, the oxide layers on the ruthenium surface become rough and porous, and can be easily removed by mechanical action during the ruthenium CMP process. Meanwhile, the use of EDA can reduce the electrostatic repulsive force between the SiO2 particles and ruthenium surface in the CMP process, thus further accelerating the ruthenium removal. In order to obtain an adequate removal rate selectivity of ruthenium versus copper, the corrosion inhibitors for copper were added. As a consequence, the removal rate selectivity of 1.13![[thin space (1/6-em)]](https://www.rsc.org/images/entities/char_2009.gif) :
:![[thin space (1/6-em)]](https://www.rsc.org/images/entities/char_2009.gif) 1 was obtained, while also reducing the corrosion potential difference between ruthenium and copper to 17 mV.
1 was obtained, while also reducing the corrosion potential difference between ruthenium and copper to 17 mV.
1. Introduction
Above the 32 nm technology node of integrated circuits, the conventional bilayer of Ta/TaN acts as a barrier layer for copper (Cu) interconnects to prevent copper diffusion, and enhance the adhesion between copper and dielectrics.1–3 With the continuous reduction of technology nodes, the proportion of Ta/TaN in the whole interconnect structure is increasing, resulting in a sharp increase in interconnect resistance and RC delay due to its high resistivity.3,4 On the other hand, the ultrathin tantalum cannot realize conformal deposition in the high aspect ratio trenches, which brings great challenges to the subsequent deposition of the copper seed layer.4 To surmount these problems, ruthenium (Ru) material has attracted widespread attention and has been proposed as the most promising barrier liner. Ruthenium is a chemically stable transition metal with a high melting point (2250 °C), a resistivity (7.1 μΩ cm) lower than that of Ta (13.1 μΩ cm), and excellent adhesion with copper.5–11 More importantly, the continuous copper film can be conformally and directly deposited on the ruthenium surface, while no intermetallic compound is formed between copper and ruthenium.7,9,12,13
Ruthenium, being a chemically stable and hard metal, is difficult to achieve the high removal rate in CMP process. To meet the requirements of efficient ruthenium removal, the researchers screened a number of oxidizers, such as KMnO4 (potassium permanganate), KClO4 (potassium perchlorate), NaIO4 (sodium periodate), K3[Fe(CN)6] (potassium ferricyanide), potassium peroxymonosulfate (oxone), K2S2O8 (potassium persulfate), KIO4 (potassium periodate), (NH4)2S2O8 (ammonium persulphate) and H2O2 (hydrogen peroxide), among which KIO4 and H2O2 receive widespread attention.7–9,12,14–21 H. Cui et al.22studied the effect of various oxidizers on the removal rate of ruthenium from the perspective of surface corrosion and oxidation. The experimental results suggested that the existence of IO4− in the slurries would boost the formation of mechanically soft and porous oxide layers on the ruthenium surface, accelerate the corrosion of ruthenium surface, and greatly improve the removal rate of ruthenium. However, B. C. Peethala et al.7 and J. Cheng23 demonstrated that when KIO4 served as an oxidizer for ruthenium, the remarkable potential gap between ruthenium and copper may bring about serious galvanic corrosion of copper. In contrast, the use of H2O2 could obtain the negligible corrosion potential difference between ruthenium and copper while forming a smooth and dense ruthenium surface.22–24 Turning to the slurries with H2O2 as oxidant, L. Jiang et al.19 reported that the added potassium ion could achieve the higher removal rate of ruthenium. This was mainly because the introduction of potassium ion increased the intensity of the reactions between H2O2 and ruthenium and the mechanical action in CMP process. H. P. Amanapu et al.8 investigated the effect of guanidine carbonate (GC) on ruthenium CMP using H2O2-based slurries, indicating that the increasing removal rate of ruthenium was because GC interacted with ruthenium oxides via the lone pair electrons on its nitrogen atoms to generate complexes. Subsequently, Y. C. Du et al.24 confirmed that guanidine ion (Gnd+) was the main factor for promoting ruthenium removal by comparing several common guanidine salts.
Most research on ruthenium CMP is mainly centered on the ruthenium oxidizers in the last decades of industrial research, but few studies on effective complexing agents for ruthenium. As the most critical chemical additive in polishing slurries, complexing agents can accelerate material removal by chelating metal ions to generate soluble species, especially in the field of barrier CMP.25,26 Ethylenediamine (EDA) containing two amino functional groups has been shown to be used as efficient complexing agents for enhancing the material removal rate in metals CMP.27–29 Liu et al.28 achieved a high copper removal rate of 1899 nm min−1 using the slurries with 100 mM EDA and 0.6% H2O2. Furthermore, H. P. Amanapu et al.8 simply mentioned that when 1 wt% EDA was applied to the pH 9 solution containing 50 mM H2O2 and 5 wt% SiO2, the removal rate of ruthenium on titanium nitride increased from 4 nm min−1 to 30 nm min−1. Unfortunately, the authors did not elaborate on the action mechanism of EDA to boost the ruthenium removal rate. In this study, the eco-friendly H2O2 and EDA were used as oxidizers and complexing agents for ruthenium, respectively. It was confirmed that EDA in the presence of H2O2 could significantly promote the removal rate of ruthenium using CMP experiments. Then, the action mechanism of EDA promoting ruthenium removal was studied by using CMP experiments, electrochemical experiments and surface chemical characterization methods. Summarizing all the above results, the action mechanism of EDA on ruthenium was expressed. Finally, 5-methyl-benzotriazole (MBTA) and sodium dodecyl benzene sulfonate (SDBS) were added to the solutions with H2O2 and EDA to solve the problem about the removal rate selective of ruthenium to copper.
2. Experimental
2.1 Materials
The solutions in this work were prepared with deionized water, silica abrasives (40% purity; JinWei Group Co. Ltd., China) and analytically pure grade chemicals, in which silica abrasives were only used for CMP experiments and Zeta potential measurements. Chemicals including hydrogen peroxide (H2O2; 30% purity), ethylenediamine (C2H8N2; 99.5% purity), ethylenediamine tetraacetic acid (C10H16N2O8; 98% purity), glycine (C2H5NO2; 99% purity), potassium citrate (C6H5K3O7; 99.3% purity), 5-methyl-benzotriazole (C7H7N3, 99.9% purity), sodium dodecyl benzene sulfonate (C12H25SO3Na, 99.97% purity) and nitric acid (as pH adjuster) were obtained from Shanghai Macklin Biochemical Technology Co. Ltd while H2O2 purchased from Jiangtian Chemical Co. Ltd., Tianjin, China.
2.2 CMP experiments
3 inch wafers cut from 12 inch ruthenium blanket wafers (SKW Associates, Inc., USA) were polished on the E460 polisher (Alpsitec Inc., France) with a Politex Reg pad (Dow Chemical Company, USA). The process parameters of CMP were as follows: down pressure of 1.5 psi, slurry flow rate of 300 ml min−1, carrier/platen speeds of 87/93 rpm, and the polishing time of 30 s. The removal rate of ruthenium was calculated by measuring the film thickness before and after CMP using a four-point probe (333 A; Four Dimensions Inc., USA). Each experiment was executed three times, and then averaged it. Also, the zeta potential of slurries was measured with a potential analyzer (NICOMP 380ZLS; PSS Inc.,USA).
2.3 Electrochemical experiments
The corrosion characteristics of ruthenium in the designated solutions were investigated using CHI660E electrochemical workstation obtained from Shanghai Chenhua Instrument Co. Ltd. A three-electrode cell was used to obtain the open circuit potential (Eoc), potentiodynamic polarization and impedance spectroscopy (EIS) data, where ruthenium was employed as working electrode, standard calomel electrode (SCE) was served as reference electrode and platinum was used as counter electrode. Before each measurement, the ruthenium electrode was thoroughly sealed with insulating tape to expose an effective area of 1 cm2, followed by polishing with 2000# sandpaper until its surface was mirror-like, and finally cleaned with deionized water and dried with pressure-air. The open circuit potential (Eoc) was stabilized for approximately 1800 s to get a reliable and credible potential value. Potentiodynamic polarization was measured by employing a scan rate of 5 mV s−1 over the voltage range of Eoc ± 0.3 V. EIS measurements were performed at an open circuit potential by employing the frequency range of 0.01 Hz to 1000 kHz, while an alternating current signal with the amplitude of 5 mV was applied. EIS data was analyzed and modeled by ZsimpWin software. In particular, prior to performing potentiodynamic polarization and EIS measurements, a stable Eoc was required.
2.4 Surface characterization
Before immersion in the solution to be tested, the sample processing method was as follows: 1 × 1 cm samples were cut from a 12 inch ruthenium blanket wafer and soaked in a 25 mM citric acid solution for 10 minutes, followed by rinsing with deionized water and finally dried with pressure-air. The morphological characteristics of the ruthenium soaked in the test solutions for 15 minutes was characterized by atomic force microscopy (AFM; 5600LS, Agilent) and scanning electron microscopy (SEM; Zeiss Sigma 500/VP, Carl Zeiss). The X-ray photoelectron spectroscopy (XPS) device used herein was manufactured by Thermo Scientific and was model number ESCALAB250Xi. After testing, the XPS spectra was analyzed by CasaXPS software and calibrated according to the C1s peak (284.6 eV).
3. Results and discussion
3.1 Dependency of ruthenium RR on H2O2 concentration
The removal rate of ruthenium as a function of H2O2 concentration is present in Fig. 1, where 5 wt% SiO2 is added to the slurries at pH 9. It is important to point out that all solutions without or with SiO2 herein have a pH of 9 to avoid the generation of toxic RuO4 in an acidic environment. It is obvious from Fig. 1 that the removal rate of ruthenium increases as the H2O2 concentration increases from 0 to 0.15 wt%, and reaches the maximum value at 0.15 wt% H2O2. However, the removal rate of ruthenium decreases with the addition of H2O2 of 0.225 wt% or more, revealing that high concentration of H2O2 is not conducive to the ruthenium removal. To investigate the causes of these phenomena, the ruthenium removal mechanism in CMP process must be discussed first, as follows:
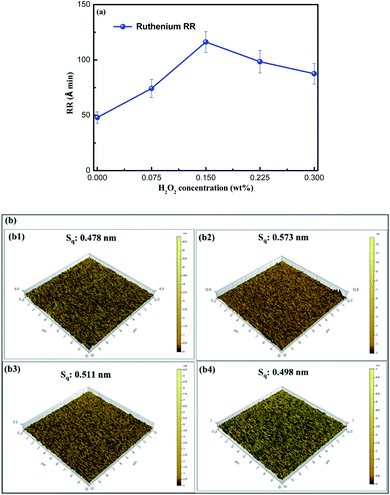 |
| | Fig. 1 (a) The ruthenium RR as a function of H2O2 concentration; (b) 3D AFM micrographs of ruthenium immersed in the following solutions: (b1) 0.075 wt% H2O2 at pH 9, (b2) 0.15 wt% H2O2 at pH 9 and (b3) 0.225 wt% H2O2 at pH 9, (b4) 0.3 wt% H2O2 at pH 9. | |
In alkaline environment, it is generally assumed that ruthenium can react with OH− to generate a series of oxides through eqn (1)–(4).7,12,22,30 In the absence of H2O2, the electrons generated by the oxidation reactions are consumed by the oxygen reduction reaction, as expressed in eqn (5).7,22,30 After adding H2O2 to the alkaline solution, the H2O2 reduction reaction (as shown in eqn (6)) becomes the main cathode reaction, which can expedite the increase of OH− concentration in the solution. Increase of OH− concentration is beneficial to acceleration of the reaction presented in eqn (1)–(4), and thus promoting the generation of assorted oxides. Furthermore, H2O2 can react with ruthenium to generate RuO2·2H2O, as shown in eqn (7).30
| | |
Ru + 3OH− → Ru(OH)3 + 3e−
| (1) |
| | |
Ru + 4OH− → RuO2·2H2O + 4e−
| (2) |
| | |
RuO2·2H2O + 4OH− → RuO42− + 4H2O + 2e−
| (3) |
| | |
RuO2·2H2O + 4OH− → RuO4− + 4H2O + 3e−
| (4) |
| | |
O2 + 2H2O + 2e− → 4OH−
| (5) |
| | |
Ru + 2H2O2 → RuO2·2H2O
| (7) |
In the CMP process, the oxides generated on the ruthenium surface are rapidly abraded by mechanical action, and the exposed fresh surface is continuously oxidized or complexed, thus realizing ruthenium removal. The reason for the higher removal rate of ruthenium at rather low H2O2 concentration may be the formation of a discontinuous oxide layer on the ruthenium surface. However, when the concentration of H2O2 exceeds a certain value, the dense and thick oxide films are generated, resulting in the lower removal rate.24 It can be seen from Fig. 1b that the surface roughness of ruthenium becomes significantly smaller as the concentration of the added H2O2 is more than 0.15 wt%, indicating that the oxide films on the ruthenium surface is denser and smoother in this case. This is the reason why the removal rate of ruthenium shows a decreasing trend when H2O2 concentration is greater than 0.15 wt%.
3.2 Dependency of ruthenium RR on EDA concentration
Regarding the effect of complexing agents, the removal rate of ruthenium from slurries containing ethylenediamine tetraacetic acid (EDTA), glycine (Gly), potassium citrate (CAK) or EDA was tested, as shown in Fig. 2a. Obviously, ethylenediamine exhibited the largest removal rate of ruthenium, which indicated the best performance of ethylenediamine as the complexing agent for ruthenium in the slurry. The removal rate of ruthenium as a function of EDA concentration is present in Fig. 2, where 5 wt% SiO2 is added to the slurries at pH 9. In the presence of 0.15 wt% H2O2, the removal rate of ruthenium increases from 116 Å min−1 to 375 Å min−1 as the EDA concentration increases from 0 to 40 mM. However, it is interesting that, without adding H2O2 into the slurries, the removal rate of ruthenium fluctuates between 48 A min−1 and 67 Å min−1 over the entire EDA concentration range. It can be said that the introduction of EDA to 5 wt% SiO2 did not expedite the ruthenium removal compared to the SiO2 alone. These results suggest that EDA can effectively improve the removal rate of ruthenium, but it must be combined with H2O2. The mechanism by which EDA facilitates ruthenium removal during CMP process will be described in detail below.
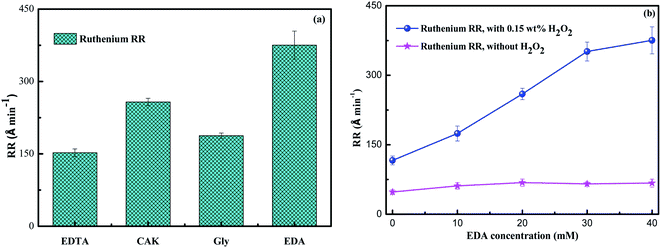 |
| | Fig. 2 (a) The removal rate of ruthenium in the slurries with 5 wt% SiO2, 0.15 wt% H2O2 and 40 mM complexing agent at pH 9; (b) the ruthenium RR as a function of EDA concentration. | |
3.3 Mechanism of ruthenium removal promoted by EDA
Ethylenediamine is a diacidic base with dissociation constants of 6.848 and 9.928.29,31,32 The distribution of H2EDA2+, HEDA+ and EDA, in solutions of different pH values can be calculated by the distribution fraction formula, as presented in Fig. 3, where EDA stands for H2N–CH2–CH2–NH2.
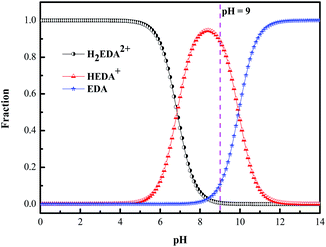 |
| | Fig. 3 Speciation diagram of ethylenediamine in aqueous solution (EDA stands for H2N–CH2–CH2–NH2). | |
3.3.1 Interaction of EDA with SiO2 particles. From Fig. 3, it is observed that, in the solution with pH 9, the main existing form of ethylenediamine is HEDA+. The positively charged HEDA+ will spontaneously adsorb around the negatively charged SiO2 particles through electrostatic action, thereby neutralizing the negative charge on the SiO2 particles surface. For investing in the interaction, zeta potential tests were performed on slurries with 5 wt% SiO2, 0.15 wt% H2O2, various concentrations of EDA and pH 9, as shown in Fig. 4a. With the increase of EDA concentration, the absolute value of zeta potential of slurries decreases, which indicates that the negative charge on the SiO2 particles surface decreases gradually. The neutralization of the negative charge of the SiO2 particles reduces the electrostatic repulsive force between SiO2 abrasives and the negatively charged ruthenium surface (isoelectric point of 4–6), thus strengthening the mechanical action and further accelerating the removal rate of ruthenium.33,34 To validate that the enhancement of mechanical action is not the only factor of promotion of the ruthenium removal, the effect of potassium ion with the same amount of positive charge as HEDA+ on removal rate of ruthenium is illustrated in Fig. 4b. Obviously, the introduction of EDA shows a greater ruthenium removal rate at the same molarity. Complexation reaction of EDA with ruthenium and its oxides will be confirmed in the following experiments.
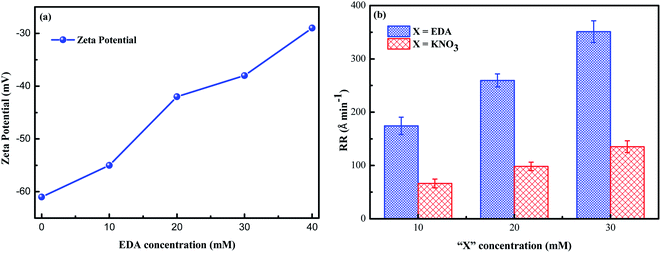 |
| | Fig. 4 (a) Dependency of zeta potential of slurries on EDA concentration; (b) the ruthenium RR as a function of “X” concentration (X stands for EDA or KNO3). | |
3.3.2 Open circuit potential analysis. Open circuit potential represents the potential difference between the working electrode and the reference electrode in the absence of applied current, and can be used to reflect the corrosion or passivation state of working electrode surface. Fig. 5 depicts the Eoc curves of ruthenium in the presence of 0.15 wt% H2O2 and varying concentrations of EDA at pH 9. It is obvious that the Eoc of ruthenium is approximately 0.135 V to 0.205 V (versus SCE) over the entire EDA concentration range. Within the range of Eoc obtained here, Ru, Ru(OH)3, RuO2·2H2O, RuO4− and RuO42− are mainly formed on the ruthenium surface according to Pourbaix diagram of Ru–H2O system.
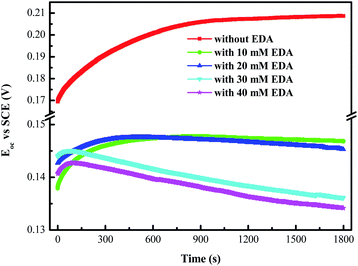 |
| | Fig. 5 Eoc–time curves of ruthenium in the designated EDA concentration. | |
Without adding EDA into the solution, the formation of passivating layer of Ru(OH)3, and RuO2·2H2O (eqn (1), (2) and (7)) brings about the slow and continuous growth of Eoc over time. Moreover, with adding EDA and H2O2, Eoc reaches the maximum value at a certain time and then decreases continuously, which can be explained as follows: the generation of passivating layer of Ru(OH)3 and RuO2·2H2O makes the Eoc increase firstly. However, this layer is likely to be discontinuous because the introduction of EDA promotes the dissolution of partial oxides on the ruthenium surface, resulting in the observed decline of Eoc over time.
3.3.3 Potentiodynamic polarization curves measurements. Potentiodynamic polarization curves performed on ruthenium in a solution are presented in Fig. 6, where the solution consists of 0.15 wt% H2O2, various concentrations of EDA and pH 9. The corresponding parameters of corrosion potential (Ecorr) and corrosion current density (Jcorr) are obtained from Fig. 6 by Tafel method and listed in Table 1.35 It is clear from Table 1 that the Ecorr decreases with increasing EDA concentration, while the Jcorr increases. The decrease of corrosion potential and the increase of corrosion current density indicate that the chemical action of the solution on ruthenium is enhanced and the corrosion rate of ruthenium in the solution is accelerated. Moreover, the anodic curves of ruthenium treated with EDA emerge a weak passivation region, which is probably due to the accumulation of oxides caused by the increase of the anodic current, and the adsorption of HEDA+.
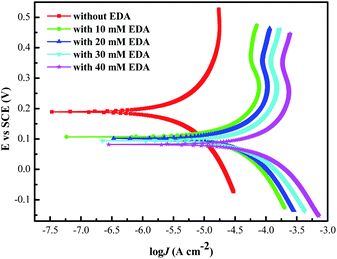 |
| | Fig. 6 Potentiodynamic polarization curves for ruthenium in the designated EDA concentration. | |
Table 1 Corresponding electrochemical parameters of ruthenium obtained with Fig. 6
| EDA (mM) |
Ecorr (V) |
Jcorr (A cm−2) |
| 0 |
0.173 |
5.843 × 10⁻⁶ |
| 10 |
0.107 |
3.451 × 10⁻⁵ |
| 20 |
0.102 |
4.536 × 10⁻⁵ |
| 30 |
0.094 |
6.313 × 10⁻⁵ |
| 40 |
0.082 |
1.111 × 10⁻⁴ |
3.3.4 EIS measurements. EIS tests were introduced to analyze the surface properties and the kinetics of electrode processes for ruthenium. Before analyzing the experimental data of EIS and fitting any theoretical model on them, it is necessary to verify whether these data fulfill the following conditions: causality, linearity and stability. It is generally believed that if the electrochemical system satisfies these conditions, the real part (Zr) and imaginary part (Zi) of the complex impedance (Z) will conform to the Kramers–Kronig Transformation (KKT). The KKT is simply a mathematical relationship, and is specifically expressed as follows:36| |
 | (8) |
| |
 | (9) |
where Zr(ω) and Zi(ω) are functions of the angular frequency ω = 2πf; f refers to frequency; and Zr(∞) represents real part of the impedance extrapolated to infinite frequency. It should be noted that since an analytical expression for Z is not available, the values of Zr and Zi can only be obtained from experimental data over a limited frequency range. Obviously, it can be seen from Fig. 7 that the experimental data are highly coincident with the KKT calculated data, suggesting that the data obtained by this electrochemical system are reliable.36
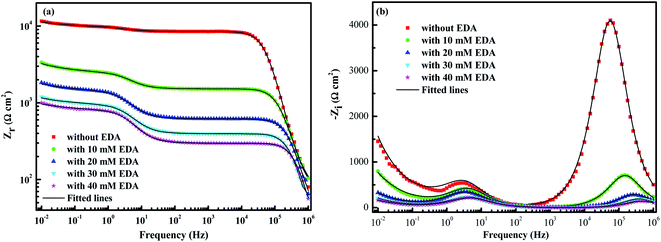 |
| | Fig. 7 Comparison of experimental and KKT calculated data of (a) Zr and (b) Zi. | |
Nyquist and Bode plots for ruthenium electrode dipped to the solutions containing 0.15 wt% H2O2, varying concentrations of EDA and pH 9 are given in Fig. 8. Seeing from Fig. 8a, the Nyquist plots appear as a capacitive arc at both the high and intermediate frequency area, followed by a straight line at low frequency area. Additionally, all Nyquist plots have the same shape, revealing that the introduction of EDA only changes the value of impedance, without affecting other electrochemical properties in the system. Generally, the sum of the diameter of two capacitive arcs is called polarization resistance (Rp).37 The Rp continually decreases with the consecutive addition of EDA content, indicating that added EDA is beneficial to the corrosion of ruthenium. The similar trends can be seen from the phase angle and frequency variations in the Bode plots of Fig. 8b. The impedance modulus (|Z|) at the lowest frequency and the highest phase angle decreases with the increasing concentration of EDA, which further proves that EDA corrodes the ruthenium surface. It is particularly noted that two peaks could be seen from the phase angle curves, which reveals that the impedance spectrum has two time constants and that micropores and cracks may be formed on the surface of the ruthenium electrode.38
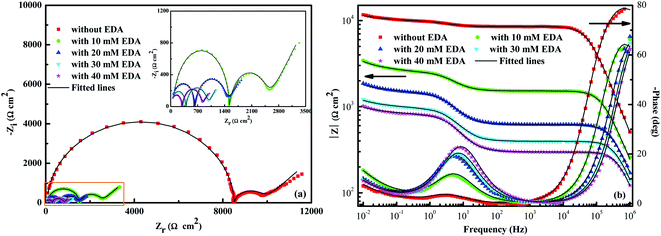 |
| | Fig. 8 Bode plots (a) and Nyquist curves (b) for ruthenium after treatment with different solutions. | |
In order to obtain information about the relevant model for dealing with the EIS data, the Nyquist plots are deeply analyzed, as follows: the first capacitive arc at the high frequency area is caused by the parallel arrangement of film capacitance (Cf) and film resistance (Rf); the second capacitive arc appearing at the intermediate frequency area is characterized by the parallel linkage of the charge transfer resistance (Rct) and double layer capacitance (Cdl); Warburg impedance (W) associated with the diffusion of reactants and products at the interface between electrode and solution is used to characterize the straight line at the low frequency area. Therefore, it can be determined that the electrode process for ruthenium contains two time constants and is influenced by mass transfer process. Moreover, two capacitive arcs that are slightly depressed and the straight line with a slope that deviates by π/4 may be credited with the unevenness or surface roughness of ruthenium electrode, resulting in the replacement of Cf and Cdl by constant phase elements (CPE) to obtain an appropriate equivalent circuit.39 The constant phase elements of Cdl and Cf are denoted by CPEdl and CPEf, respectively. The impedance of a CPE is expressed in following equation:37–39
where
Q means the modulus of CPE,
j is imaginary root, and
n stands for CPE exponent with values between −1 and 1. The specific meaning of CPE varies with
n, which is described as follows: when
n = −1, CPE represents inductance; when
n = 0, it is resistance; when
n = 0.5, it stands for Warburg impedance; when
n = 1, it is ideal capacitance. The impedance of a
W can be presented as:
40–42| |
 | (11) |
where,
σ is taken as Warburg impedance coefficient. Finally,
Fig. 9 shows the resulting equivalent circuit, and the fitted values are shown in
Table 2. The corresponding values of
Cf and
Cdl in the table can be calculated by the following
eqn (10), where
fzim−max is the frequency value at which the imaginary part of the impedance in the Nyquist plots is maximum.
37–39| | |
C = Q(2πfzim−max)n−1
| (12) |
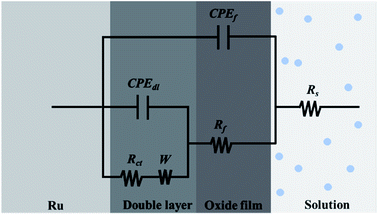 |
| | Fig. 9 The electrical equivalent circuit used to fit the EIS data. | |
Table 2 Fitted impedance parameters of ruthenium obtained with EEC
| EDA (mM) |
Rs (Ω cm2) |
Rf (Ω cm2) |
Rct (Ω cm2) |
Rp (kΩ cm2) |
Cf (nF cm−2) |
nf |
Cdl (μF cm−2) |
ndl |
W (μΩ−1 cm−2 s0.5) |
| 0 |
85.30 |
8451 |
1316 |
9767 |
0.34 |
0.98 |
35.89 |
0.94 |
1.82 |
| 10 |
68.41 |
1454 |
972 |
2426 |
0.73 |
0.98 |
38.02 |
0.88 |
3.70 |
| 20 |
30.30 |
598 |
832 |
1430 |
0.96 |
0.98 |
51.68 |
0.87 |
8.75 |
| 30 |
13.77 |
382 |
560 |
942 |
1.10 |
0.99 |
62.35 |
0.87 |
13.60 |
| 40 |
9.90 |
288 |
513 |
801 |
1.24 |
1 |
63.01 |
0.88 |
17.70 |
As can be seen from Table 2, Rf, Rct and the sum of both (Rp) decrease with the augmenting content of EDA. This observation suggests that the addition of EDA significantly weakens the resistance of the solution to corrosion of ruthenium and increases the active sites of ruthenium dissolution reaction, thereby accelerating the chemical dissolution of ruthenium and its oxides. In addition, the values of Cf and Cdl show an increasing trend as the EDA concentration increases, and the specific reason can be explained by the following expression:37–39
| |
 | (13) |
| |
 | (14) |
where
S means the effective contact area between electrode and solution,
F represents the Faraday constant
, d represents the thickness of electric double layer, and
ε0 and
ε represent the permittivity constants of air and the electric double layer, respectively. Therefore, the increase of
Cf and
Cdl could be attributed to the expansion of effective contact area (
S) attributed by the destruction of the dense oxide layers on the ruthenium surface by EDA molecules. In addition, the thinning of the oxide layers on the ruthenium surface caused by EDA complexation may also provoke the growth of
Cf and
Cdl.
The increase of W indicates that the presence of EDA accelerates the diffusion of corrosion ions to the ruthenium surface, and also enhances the diffusion of soluble ruthenium complexes from the ruthenium surface to the solution. For further detailed qualitative analysis, the Warburg impedance coefficient σ that is associated with the electrolyte diffusion behavior can be obtained the Randles curves (Zr or Zi against ω−1/2) in Fig. 10a and Fig. 10b.42 In general, the lower the value of σ is, the easier it is for the electrolyte to diffuse into the solution through the pores in the oxide films. The slope of Zr against ω−1/2 in Fig. 10a is regarded as σ because of the higher degree of linear fitting. Seeing from Fig. 10c, σ decreases with the augmenting concentrations of EDA. Increase in σ means a growth in the number of the ions permeated the oxide layers, which can be interpreted as a more porous, coarser and thinner oxide films on the ruthenium surface resulting from an increased corrosion rate using EDA. The rough and porous nature of oxide films will then be demonstrated by surface morphology measurement.
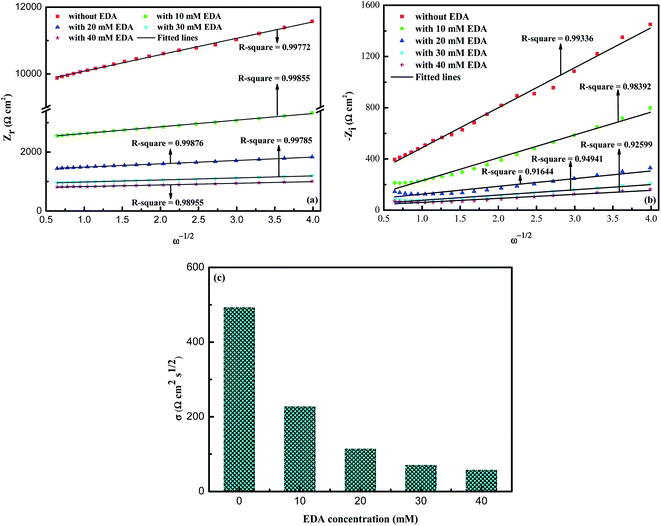 |
| | Fig. 10 The Randles curves ((a) Zr against ω−1/2, (b) Zi against ω−1/2) were obtained using the low-frequency region data of the Nyquist diagram in Fig. 6c. (c) Relationship between σ and the concentration of EDA. | |
3.3.5 Surface morphology measurements. SEM observations were utilized to assess the surface morphology of ruthenium soaked in aggressive solutions. Fig. 11 depicts the SEM micrographs of ruthenium in certain solutions: (a) deionized water (blank sample); (b) 0.15 wt% H2O2 at pH 9; (c) 0.15 wt% H2O2 and 30 mM EDA at pH 9. It is clear that from Fig. 11a, when only immersed in deionized water without any corrosive ions, the ruthenium surface is remarkably smooth and not attacked, and clearly shows crystal grains with a diameter of about 30 nm. However, an increase in surface roughness is evident when ruthenium is immersed in a solution with H2O2 (Fig. 11b), which is usually accompanied by the formation of porous and rough oxides. A considerably deteriorated and roughed surface results from further addition of EDA to the solution containing H2O2 (Fig. 11c). This is because of the strong complexation of EDA, the oxide films on ruthenium surface cannot effectively frustrate attack with aggressive ions in the corrosive environments, resulting in the acceleration of the corrosion of ruthenium.
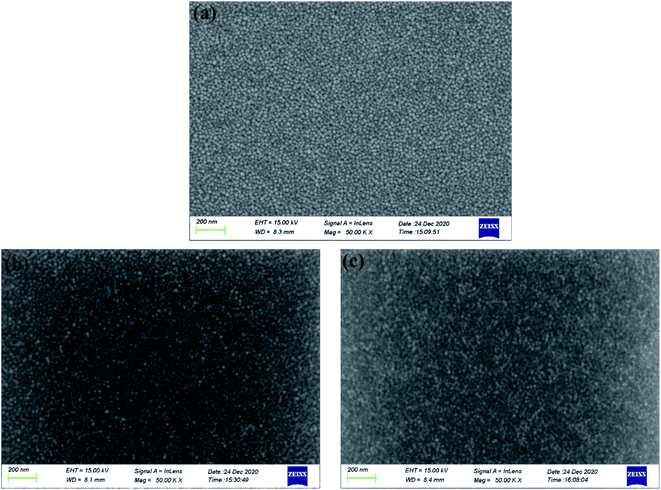 |
| | Fig. 11 SEM micrographs of ruthenium in certain solutions: (a) deionized water (blank sample); (b) 0.15 wt% H2O2 at pH 9; (c) 0.15 wt% H2O2 and 30 mM EDA at pH 9. | |
Due to the lack of quantitative information of surface roughness in SEM images, AFM, which can distinguish the changes of surface morphology at the atomic level and calculate the surface roughness of the samples, was employed to further investigate the surface topography of ruthenium dipped in different corrosive solutions. 3D AFM micrographs and corresponding height profiles of ruthenium surface immersed in solutions without and with H2O2 or EDA are illustrated as Fig. 12. From the 3D micrograph in Fig. 12c, it should be observed that when H2O2 and EDA are present in the solution simultaneously, the ruthenium surface is heavily corroded, which provokes the generation of bumpy and rough surface with deep and large pits and presents the maximum surface roughness (Sq = 1.24 nm), which is the result of the corrosive attack of EDA with strong complexation. The height profile in Fig. 12f also exhibits the same phenomenon, with a peak–valley difference (PV) of 7.52 nm, which is also the largest among the three samples. It is remarkable that when H2O2 is added alone (Fig. 12b and e), both the value of the surface roughness and peak–valley difference are slightly increased compared with the blank sample (Fig. 12a and d), which may be correlated with the formation of the rough and porous oxide layers by H2O2 oxidation. This observation is consistent with the electrochemical and SEM results, indicating that the synergistic effect of H2O2 and EDA can accelerate the corrosion of ruthenium, thereby improving the removal rate.
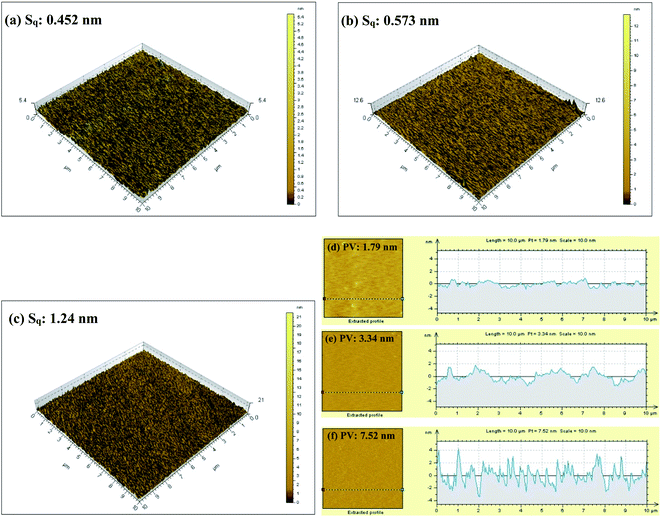 |
| | Fig. 12 3D AFM micrographs and corresponding height profiles of ruthenium immersed in (a and d) deionized water, (b and e) 0.15 wt% H2O2 at pH 9 and (c and f) 0.15 wt% H2O2 and 30 mM EDA at pH 9. | |
3.3.6 XPS measurements. XPS tests of ruthenium samples with different treatments were carried out to investigate the chemical composition of oxide layer on ruthenium surface in the absence and presence of EDA. Fig. 13 displays the fitted results of XPS spectra on the ruthenium surface after immersion in a solution with and without EDA, and the detailed analysis results of Ru(3d) are shown in Table 3. The Ru(3d) spectra of the ruthenium surface presents five peaks, including Ru peak at about 280.2 eV (3d5/2) and 284.4 eV (3d3/2), RuO2·2H2O peak at about 281.0 eV (3d5/2) and 285.3 eV (3d3/2) and RuO3 peak at about 282.5 eV (3d5/2).12,43,44 It should be noted that the absence of Ru(OH)3 on the ruthenium surface may be credited with the oxidation of Ru(OH)3 into RuO2·2H2O under the action of oxidizer.12 Furthermore, it is considered that RuO3 exists on the bulk-phase of RuO2·2H2O.12 Therefore, the oxides covering the ruthenium surface are mainly RuO2·2H2O and RuO3. From the results shown in Table 3, it can be seen that the content of the oxides on the ruthenium surface is reduced after immersion in the solution containing H2O2 and EDA. Combined with the results of electrochemical and surface morphology, it can be reasonably inferred that EDA may mainly interact with ruthenium oxides and can effectively facilitate the dissolution of ruthenium oxides. This may also explain why the addition of EDA to the solution without H2O2 in Fig. 2b cannot effectively improve the removal rate of ruthenium, which is mainly due to the extremely low content of oxides on the ruthenium surface in the absence of H2O2. In addition, a peak located at 399.2 eV in the N(1s) spectra of Fig. 13b may be ascribed to the nitrogen atoms of EDA adsorbed on the ruthenium surface.29
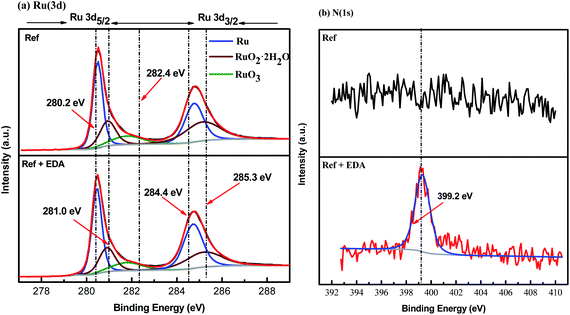 |
| | Fig. 13 (a) Ru(3d) and (b) N(1s) spectra of ruthenium after dipping into Ref solutions without or with 30 mM EDA (Ref: 0.15 wt% H2O2 at pH 9). | |
Table 3 The XPS results of Ru(3d) obtained with Fig. 13
| EDA (mM) |
Ru (%) |
RuO2·2H2O (%) |
RuO3 (%) |
| 0 |
47.52 |
38.11 |
14.37 |
| 30 |
58.89 |
29.46 |
11.65 |
3.4 Action mechanism of EDA on ruthenium
Summarizing all the above results, the action mechanism of EDA on ruthenium is expressed, as presented in Fig. 14. Ruthenium can react with OH− to generate a series of oxides, such as RuO2·2H2O and RuO3, when a solution has a pH of 9. It should be mentioned here that the oxidation of ruthenium is a gradual process, including Ru(OH)3, etc. transitional oxidation states. Moreover, these oxides can be slowly dissolved and converted to RuO4− and RuO42− species under the action of OH−. The increase of OH− concentration in solution after adding H2O2 promotes the formation of ruthenium oxides, resulting in an oxide layer consisting of RuO2·2H2O and RuO3 on the ruthenium surface, as presented in Fig. 14a. When EDA is present in solution with H2O2, EDA interacts with ruthenium oxides via the lone pair electrons on its nitrogen atoms to generate a number of complexes, thus facilitating the dissolution of the oxides on the ruthenium surface. More importantly, the ruthenium surface is severely corroded and illustrates rough and porous, as depicted in Fig. 14b. Finally, the oxides generated on the ruthenium surface are rapidly abraded by mechanical action during the ruthenium CMP process of Fig. 14c. Additionally, the addition of EDA can reduce the zeta potential for slurries, thereby reducing the electrostatic repulsive force between the SiO2 particles and ruthenium surface, enhancing the mechanical action and further accelerating the ruthenium removal.
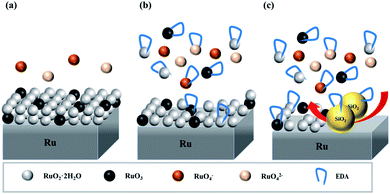 |
| | Fig. 14 Schematic diagram of action mechanism of EDA on ruthenium. (a) H2O2; (b) H2O2 and EDA; (c) ruthenium CMP. | |
3.5 Removal rate selectivity
In order to achieve planarization during barrier CMP, copper dishing, which is the height difference of a copper with respect to the adjacent oxides, must be controlled.45–49 This would require that the removal rate of barrier material is greater than that of copper. Only in this way can the dishing defects caused by the copper overburden CMP step be corrected, the residual copper be removed, and the surface non-uniformity of the patterned wafer be controlled.49 Fig. 15 presents the removal rate for ruthenium and copper obtained using the slurries with various components (the specific information of slurries is embodied in the title of Fig. 15) and shows the removal rate selectivity for ruthenium to copper in the corresponding slurries. It should be pointed out that in this experiment, the EDA concentration is selected as 30 mM for ensuring the stability of the slurries with SiO2 particles and the fastest removal rate of ruthenium. Compared with slurry A, the addition of EDA in slurry B improves the removal rate of ruthenium, but the removal rate of copper is remarkably higher than that of ruthenium. On this basis, the corrosion inhibitor combination for copper in another study50 is added (as shown in slurry C), and successfully adjust the removal rate selectivity to 1.13![[thin space (1/6-em)]](https://www.rsc.org/images/entities/char_2009.gif) :
:![[thin space (1/6-em)]](https://www.rsc.org/images/entities/char_2009.gif) 1.
1.
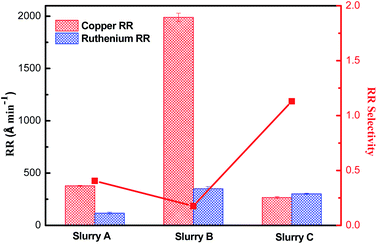 |
| | Fig. 15 The removal rate of ruthenium and copper treated with slurry A (Ref :5 wt% SiO2 + 0.15 wt% H2O2 at pH 9), slurry B (Ref + 30 mM EDA) and slurry C (Ref + 30 mM EDA + 100 ppm MBTA + 300 ppm SDBS). | |
3.6 Evaluation of galvanic corrosion
Galvanic corrosion refers to the phenomenon that when two metals contact each other or communicate through other electrolyte solutions, the metal with a lower potential is corroded preferentially.7,30,51,52 Since the standard electrode potentials of copper and ruthenium are 0.337 V and 0.45 V (versus SHE), respectively, the Cu/Ru interface is prone to galvanic corrosion, which leads to the accelerated corrosion of copper during the ruthenium barrier CMP.30 It is generally considered that the galvanic corrosion can be effectively controlled only when the corrosion potential difference (ΔEcorr) is less than 20 mV. Fig. 16 illustrates the potentiodynamic polarization plots of ruthenium and copper for different solutions. Obviously, in the absence of a corrosion inhibitor of copper, the ΔEcorr between ruthenium and copper is negligible compared to potassium periodate and potassium periodate as oxidizers for ruthenium. MBTA and SDBS were also introduced to acquire a satisfactory removal rate selectivity, at which the ΔEcorr between copper and ruthenium is 17 mV.
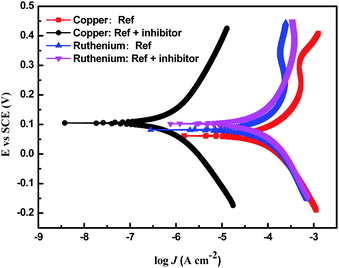 |
| | Fig. 16 The potentiodynamic polarization plots of copper and ruthenium for different solutions, where the inhibitor consists of 100 ppm MBTA and 300 ppm SDBS (Ref: 0.15 wt% H2O2 + 30 mM EDA at pH 9). | |
4. Conclusion
The removal rate of ruthenium in SiO2-based slurries comprised of EDA, H2O2 or both at pH 9 was investigated. It was demonstrated that the single use of EDA or H2O2 had limited effect on improving the removal rate of ruthenium, but the combination of EDA and H2O2 evidently facilitated the ruthenium removal, revealing that the formation of oxides was a key step, and EDA mainly reacted with oxides on ruthenium surface. Next, by exploring the effect of potassium ion with the same positive charge as HEDA+ (the main forms of EDA in pH 9) on removal rate of ruthenium, it was verified that the enhancement of mechanical action was not the main factor. Then, the results of electrochemical experiments, surface morphology measurements and XPS measurements showed that EDA could facilitate the dissolution of ruthenium oxides, thus facilitating the corrosion of ruthenium and forming a rough and porous oxide layer on the ruthenium surface. It was likely to be a large number of complexes formed by the interaction of the lone pair electrons on nitrogen atoms of EDA with ruthenium oxides. The rough and porous oxide layers were rapidly removed by mechanical action of SiO2 particles during the ruthenium CMP process. Finally, the removal rate selectivity of 1.13![[thin space (1/6-em)]](https://www.rsc.org/images/entities/char_2009.gif) :
:![[thin space (1/6-em)]](https://www.rsc.org/images/entities/char_2009.gif) 1 and the corrosion potential difference of 17 mV were attained by adding MBTA and SDBS to the solution with EDA and H2O2.
1 and the corrosion potential difference of 17 mV were attained by adding MBTA and SDBS to the solution with EDA and H2O2.
Author contributions
Yi Xu: conducting research, conceptualization of data, analysis and interpretation of data, writing-original draft preparation; Tengda Ma: conducting research, acquisition of data; Yuling Liu: review & editing; Baimei Tan: conceptualization, supervision, resources, project administration, writing-reviewing and editing; Shihao Zhang: investigation; Yazhen Wang: investigation; Guoqiang Song: experimental instrument test.
Conflicts of interest
There are no conflicts to declare.
Acknowledgements
This paper was supported by the Major National Science and Technology Special Projects (No. 2016ZX02301003-004-007), the Natural Science Foundation, China (No. 61704046), the Hebei Natural Science Foundation Project (No. F2018202174, F2021202009), and the Key Laboratory of Electronic Materials and Devices of Tianjin, China.
References
- J. C. Tsao, C. P. Liu and Y. L. Wang, et al., Controlling Ta phase in Ta/TaN bilayer by surface pre-treatment on TaN, J. Phys. Chem. Solids, 2008, 69(2–3), 501–504 CrossRef CAS.
- Q. Xie, X. P. Qu and J. J. Tan, et al., Superior thermal stability of Ta/TaN bi-layer structure for copper metallization, Appl. Surf. Sci., 2006, 253(3), 1666–1672 CrossRef CAS.
- M. Darmi, L. Cherif and J. Benallal, et al., Integrated Circuit Conception: A Wire Optimization Technic Reducing Interconnection Delay in Advanced Technology Nodes, Electronics, 2017, 6(4), 78 CrossRef.
- S. K. Natarajan, C. L. Nies and M. Nolan, Ru passivated and Ru doped ε-TaN surfaces as a combined barrier and liner material for copper interconnects: a first principles study, J. Mater. Chem. C, 2019, 7(26), 7959–7973 RSC.
- R. Chan, T. N. Arunagiri and Y. Zhang, et al., Diffusion studies of copper on ruthenium thin film: A plateable copper diffusion barrier, Electrochem. Solid-State Lett., 2004, 7(8), G154 CrossRef CAS.
- O. Chyan, T. N. Arunagiri and T. Ponnuswamy, Electrodeposition of copper thin film on ruthenium: a potential diffusion barrier for Cu interconnects, J. Electrochem. Soc., 2003, 150(5), C347 CrossRef CAS.
- B. C. Peethala, D. Roy and S. V. Babu, Controlling the galvanic corrosion of copper during chemical mechanical planarization of ruthenium barrier films, Electrochem. Solid-State Lett., 2011, 14(7), H306 CrossRef CAS.
- H. P. Amanapu, K. V. Sagi and L. G. Teugels, et al., Role of guanidine carbonate and crystal orientation on chemical mechanical polishing of ruthenium films, ECS J. Solid State Sci. Technol., 2013, 2(11), P445 CrossRef CAS.
- Z. Wang, J. Zhou and C. Wang, et al., Role of ammonium ions in colloidal silica slurries for Ru CMP, ECS J. Solid State Sci. Technol., 2019, 8(4), P285 CrossRef CAS.
- R. Bernasconi and L. Magagnin, Ruthenium as Diffusion Barrier Layer in Electronic Interconnects: Current Literature with a Focus on Electrochemical Deposition Methods, J. Electrochem. Soc., 2018, 166(1), D3219 CrossRef.
- A. Shukla, S. N. Victoria and R. Manivannan. A Review on Chemical Mechanical Planarization of Barrier Layer Metals[C]//Key Engineering Materials. Trans Tech Publications Ltd, 2021, vol. 882, pp. 171–180 Search PubMed.
- J. Cheng, T. Wang and L. Jiang, et al., Surface characteristics of ruthenium in periodate-based slurry during chemical mechanical polishing, Appl. Surf. Sci., 2015, 351, 401–409 CrossRef CAS.
- Y. S. Chou, S. C. Yen and K. T. Jeng, Fabrication of ruthenium thin film and characterization of its chemical mechanical polishing process, Mater. Chem. Phys., 2015, 162, 477–486 CrossRef CAS.
- K. V. Sagi, H. P. Amanapu and S. R. Alety, et al., Potassium permanganate-based slurry to reduce the galvanic corrosion of the Cu/Ru/TiN barrier liner stack during CMP in the BEOL interconnects, ECS J. Solid State Sci. Technol., 2016, 5(5), P256 CrossRef CAS.
- K. Yadav, M. Ramachandran and S. N. Victoria, Electrochemical Characterization of Ruthenium Using Potassium Bromate as Oxidizer for Titania-Based CMP Slurry, ECS Trans., 2018, 85(6), 59 CrossRef CAS.
- I. K. Kim, B. G. Cho and J. G. Park, et al., Effect of pH in Ru slurry with sodium periodate on Ru CMP, J. Electrochem. Soc., 2009, 156(3), H188 CrossRef CAS.
- C. Wang, J. Zhou and C. Luo, et al., Synergist effect of potassium periodate and potassium persulfate on improving removal rate of Ruthenium during chemical mechanical polishing, J. Mater. Sci. Eng. B, 2020, 262, 114764 CrossRef CAS.
- C. Wang, C. Wang and H. Li, et al., Effect of UV Radiation on Oxidation for Ru CMP, ECS J. Solid State Sci. Technol., 2021, 10(3), 034007 CrossRef CAS.
- L. Jiang, Y. He and Y. Li, et al., Effect of ionic strength on ruthenium CMP in H2O2-based slurries, Appl. Surf. Sci., 2014, 317, 332–337 CrossRef CAS.
- K. Yadav, R. Manivannan and S. N. Victoria, Electrochemical characterization of ruthenium dissolution and chemical mechanical polishing in hydrogen peroxide based slurries, Mater. Today: Proc., 2019, 18, 1220–1228 CAS.
- M. Liu, D. Yin and B. Tan, et al., Toward Understanding the Adsorption And Inhibition Mechanism of Cu-MBTA Passivation Film on Copper Surface: A Combined Experimental and DFT Investigation, Electron. Mater. Lett., 2021, 17(1), 109–118 CrossRef CAS.
- H. Cui, J. H. Park and J. G. Park, Effect of oxidizers on chemical mechanical planarization of ruthenium with colloidal silica based slurry, ECS J. Solid State Sci. Technol., 2012, 2(1), P26 CrossRef.
- J. Cheng, T. Wang and X. Lu, Galvanic corrosion inhibitors for Cu/Ru couple during chemical mechanical polishing of Ru, ECS J. Solid State Sci. Technol., 2016, 6(1), P62 CrossRef.
- Y. Du, C. Wang and J. Zhou, et al., Effect of Guanidinium Ions on Ruthenium CMP in H2O2-Based Slurry, ECS J. Solid State Sci. Technol., 2017, 6(8), P521 CrossRef CAS.
- L. Hu, G. Pan and Y. Xu, et al., The effect of hydroxyethylidene diphosphonic acid on the chemical mechanical polishing of cobalt in H2O2 based alkaline slurries, ECS J. Solid State Sci. Technol., 2020, 9(3), 034007 CrossRef.
- L. Hu, X. Zhang and H. Wang, et al., Experimental and density functional theory study of complexing agents on cobalt dissolution in alkaline solutions, Electrochim. Acta, 2021, 375, 137977 CrossRef CAS.
- G. Lim, T. Kim and J. Lee, et al., The roles of complexing agents on Copper CMP, Thin Film Materials, Processes, and Reliability, 2003, 100, 266 Search PubMed.
- P. Liu, X. Lu and Y. Liu, et al., Chemical mechanical planarization of copper using ethylenediamine and hydrogen peroxide based slurry[M]//Advanced Tribology, Springer, Berlin, Heidelberg, 2009, pp. 908–911 Search PubMed.
- H. Wu, L. Jiang and X. Zhong, et al., Exploring the role of− NH2 functional groups of ethylenediamine in chemical mechanical polishing of GCr15 bearing steel, Friction, 2021, 9(6), 1673–1687 CrossRef CAS.
- M. C. Turk, S. E. Rock and H. P. Amanapu, et al., Investigation of percarbonate based slurry chemistry for controlling galvanic corrosion during CMP of ruthenium, ECS J. Solid State Sci. Technol., 2013, 2(5), P205 CrossRef CAS.
- U. B. Patri, S. Aksu and S. V. Babu, Role of the functional groups of complexing agents in copper slurries, J. Electrochem. Soc., 2006, 153(7), G650 CrossRef CAS.
- L. S. Selwyn and V. Argyropoulos, Removal of chloride and iron ions from archaeological wrought iron with sodium hydroxide and ethylenediamine solutions, Stud. Conserv., 2005, 50(2), 81–100 CrossRef.
- T. P. Luxton, M. J. Eick and K. G. Scheckel, Characterization and dissolution properties of ruthenium oxides, J. Colloid Interface Sci., 2011, 359(1), 30–39 CrossRef CAS PubMed.
- S. Ardizzone, A. Daghetti and L. Franceschi, et al., The point of zero charge of hydrous RuO2, Colloids Surf., 1989, 35(1), 85–96 CrossRef CAS.
- E. McCafferty, Validation of corrosion rates measured by the Tafel extrapolation method, Corros. Sci., 2005, 47(12), 3202–3215 CrossRef CAS.
- A. Sadkowski, Unusual electrochemical immittance spectra with negative resistance and their validation by Kramers–Kronig transformation, Solid State Ionics, 2005, 176(25–28), 1987–1996 CrossRef CAS.
- X. Zhang, L. Hu and C. Li, et al., Exploring combined effect of nitrilotriacetic acid and inhibitor on copper surface in alkaline solution: Insights from experiments and molecular dynamics simulation studies, J. Mol. Liq., 2021, 328, 115502 CrossRef CAS.
- B. Tan, S. Zhang and H. Liu, et al., Insights into the inhibition mechanism of three 5-phenyltetrazole derivatives for copper corrosion in sulfuric acid medium via experimental and DFT methods, J. Taiwan Inst. Chem. Eng., 2019, 102, 424–437 CrossRef CAS.
- Y. Qiang, S. Zhang and B. Tan, et al., Evaluation of Ginkgo leaf extract as an eco-friendly corrosion inhibitor of X70 steel in HCl solution, Corros. Sci., 2018, 133, 6–16 CrossRef CAS.
- T. Hong, Y. H. Sun and W. P. Jepson, Study on corrosion inhibitor in large pipelines under multiphase flow using EIS, Corros. Sci., 2002, 44(1), 101–112 CrossRef CAS.
- C. Fonseca and M. A. Barbosa, Corrosion behaviour of titanium in biofluids containing H2O2 studied by electrochemical impedance spectroscopy, Corros. Sci., 2001, 43(3), 547–559 CrossRef CAS.
- W. Hou, F. He and Z. Liu, Characterization methods for sulfate ions diffusion coefficient in calcium sulphoaluminate mortar based on AC impedance spectroscopy, Constr. Build. Mater., 2021, 289, 123169 CrossRef CAS.
- J. Y. Shen, A. Adnot and S. Kaliaguine, An ESCA study of the interaction of oxygen with the surface of ruthenium, Appl. Surf. Sci., 1991, 51(1–2), 47–60 CrossRef CAS.
- J. Stojadinović, L. Mendia and D. Bouvet, et al., Electrochemically controlled wear transitions in the tribocorrosion of ruthenium, Wear, 2009, 267(1–4), 186–194 CrossRef.
- C. S. Liu, C. L. Chang and C. H. Yu, Copper chemical-mechanical-polishing (CMP) dishing, U.S. Pat., 6010962, 2000-1-4 Search PubMed.
- L. Jiang, Y. He and X. Niu, et al., Synergetic effect of benzotriazole and non-ionic surfactant on copper chemical mechanical polishing in KIO4-based slurries, Thin Solid Films, 2014, 558, 272–278 CrossRef CAS.
- J. Cheng, T. Wang and H. Mei, et al., Synergetic effect of potassium molybdate and benzotriazole on the CMP of ruthenium and copper in KIO4-based slurry, Appl. Surf. Sci., 2014, 320, 531–537 CrossRef CAS.
- L. Hu, G. Pan and H. Wang, et al., The synergistic inhibitory effect and density functional theory study of 2, 2’-[[(Methyl-1H-benzotriazol-1-yl) methyl] imino] bisethanol and potassium oleate on copper in H2O2 based alkaline slurries, Colloids Surf., A, 2020, 603, 125275 CrossRef CAS.
- H. Nishizawa, H. Nojo and A. Isobe, Fundamental study of chemical–mechanical polishing slurry of cobalt barrier metal for the next-generation interconnect process, Jpn. J. Appl. Phys., 2010, 49(5S2), 05FC03 Search PubMed.
- Y. Xu, B. Tan and L. Hu, et al., Synergetic Effect of 5-Methyl-1H-Benzotriazole and Sodium Dodecyl Benzene Sulfonate on CMP Performance of Ruthenium Barrier Layer in KIO4-Based Slurry, ECS J. Solid State Sci. Technol., 2020, 9(10), 104005 CrossRef CAS.
- K. Maruyama, M. Shiohara and K. Yamada, et al., Galvanic corrosion control in chemical mechanical polishing of Cu interconnects with ruthenium barrier metal film, Jpn. J. Appl. Phys., 2009, 48(4S), 04C022 Search PubMed.
- J. Cheng, J. Pan and T. Wang, et al., Micro-galvanic corrosion of Cu/Ru couple in potassium periodate (KIO4) solution, Corros. Sci., 2018, 137, 184–193 CrossRef CAS.
|
| This journal is © The Royal Society of Chemistry 2022 |
Click here to see how this site uses Cookies. View our privacy policy here.  Open Access Article
 *ab,
Shihao Zhangab,
Yazhen Wangab and
Guoqiang Songab
![[thin space (1/6-em)]](https://www.rsc.org/images/entities/char_2009.gif) :
:![[thin space (1/6-em)]](https://www.rsc.org/images/entities/char_2009.gif) 1 was obtained, while also reducing the corrosion potential difference between ruthenium and copper to 17 mV.
1 was obtained, while also reducing the corrosion potential difference between ruthenium and copper to 17 mV.


![[thin space (1/6-em)]](https://www.rsc.org/images/entities/char_2009.gif) :
:![[thin space (1/6-em)]](https://www.rsc.org/images/entities/char_2009.gif) 1.
1.

![[thin space (1/6-em)]](https://www.rsc.org/images/entities/char_2009.gif) :
:![[thin space (1/6-em)]](https://www.rsc.org/images/entities/char_2009.gif) 1 and the corrosion potential difference of 17 mV were attained by adding MBTA and SDBS to the solution with EDA and H2O2.
1 and the corrosion potential difference of 17 mV were attained by adding MBTA and SDBS to the solution with EDA and H2O2.


