 Open Access Article
Interplay of piezoresponse and magnetic behavior in Bi0.9A0.1FeO2.95 (A = Ba, Ca) and Bi0.9Ba0.05Ca0.05FeO2.95 co-doped ceramics
G. Mangamma a,
B. K. Dasa,
B. Ramachandranb,
M. S. Ramachandra Raob and
T. N. Sairam
 *a
*a
aMaterials Science Group, Indira Gandhi Centre for Atomic Research & Homi Bhabha National Institute, Kalpakkam, Tamil Nadu 603102, India
bDepartment of Physics, Nano Functional Materials Technology and MSRC, Indian Institute of Technology Madras, Chennai, 600036, Tamil Nadu, India. E-mail: sairamtn@gmail.com
First published on 18th January 2022
Abstract
Extensive piezoresponse force microscopy (PFM) and magnetic force microscopy (MFM) measurements in conjunction with piezoresponse spectroscopy have been carried out on pellets of Bi0.9A0.1FeO2.95 (A = Ba, Ca) and Bi0.9Ba0.05Ca0.05FeO2.95 co-doped ceramic samples in order to characterize their ferroelectric and magnetic nature and correlate the findings with our recent far-infrared spectroscopic studies on these samples. We are able to clearly discern the switching behavior of the 71° and 109° ferroelectric domains as distinct from that of the 180° domains in both pristine and Ba-doped bismuth ferrite samples. While substitution of Ba at the Bi site in bismuth ferrite does not affect the ferroelectric and magnetic properties to a great extent, Ca-doped samples show a decrease in their d33 values with a concomitant increase in their magnetic behavior. These results are in agreement with the findings from our far-infrared studies.
1 Introduction
BiFeO3 is a room temperature multiferroic that has a rhombohedrally distorted perovskite structure with the R3c space group. It undergoes a transition from the paraelectric to ferroelectric phase at a Curie temperature of 1100 K,1 accompanied by the onset of the polarization along the 〈111〉pc pseudo cubic (pc) direction because of the stereochemical activity of the lone-pair electrons over Bi3+ ions leading to polar atomic displacements along that direction and anti-phase tilting of the adjacent FeO6 octahedra.2,3 Increased interest in the ferroelectric property of this material is due to the high value of spontaneous polarization (Ps) (∼90 μC cm−2) predicted through ab initio calculations.3,4 Experimentally observed values of Ps are ∼ 40 μC cm−2 in bulk ceramic form5 and about 90−150 μC cm−2 in thin film form.6,7 The magnetic structure of this compound is replete with a host of magnetic interactions:2,8 it exhibits G-type antiferromagnetism and a spiral spin arrangement with Néel temperature TN = 647 K. This antiferromagnetic spin structure itself arises from a superexchange (SE) interaction between the neighboring spins of Fe ions mediated via oxygen atoms. In addition, antisymmetric exchange between the neighboring spins gives rise to Dzyaloshinskii–Moriya (DM) interaction, while an interaction between the crystal field and the orbital magnetic moment results in single ion anisotropy (SIA). Competition between the DM and superexchange interactions leads to a canted spin structure.9 In the case of BiFeO3, these canted spin structure forms an array in a regular fashion over a distance of 62 nm along the 〈10![[1 with combining macron]](https://www.rsc.org/images/entities/char_0031_0304.gif) 〉pc direction, which is known as spin cycloid. The average magnetic moment over the spin cycloid is found to be zero as each spin has its mirror image in the cycloidal spin arrangement (see Fig. 6). Therefore, the macroscopic magnetization of BiFeO3 gets hampered by cycloidal spin arrangement.
〉pc direction, which is known as spin cycloid. The average magnetic moment over the spin cycloid is found to be zero as each spin has its mirror image in the cycloidal spin arrangement (see Fig. 6). Therefore, the macroscopic magnetization of BiFeO3 gets hampered by cycloidal spin arrangement.
It is desirable to achieve suppression of the spin-cycloid in BiFeO3 at room temperature to pave way for enhanced magnetic properties. This can be realized through chemical substitution,10–17 inducing strain in thin films,18–21 high magnetic fields,22–27 hydrostatic pressure28–30 and finite size effects.31–36 Of these, aliovalent doping controls the chemistry of the material and often could result in increased chemical pressure that would work similar to applying hydrostatic pressure externally. To this end, we have synthesized Ba-, Ca- and Ba/Ca co-doped samples. Our recent infrared reflectance and low frequency Raman studies37 on these Ba, Ca and Ba–Ca co-doped samples to monitor the behavior of their spin wave excitation (SWE) spectra, revealed that Ca-doped BiFeO3 sample showed a near-complete suppression of the SWEs. From our recent magnetic studies, the ceramic BiFeO3 sample was found to develop weak ferromagnetic order at low-temperature.38,39 This improvement in the magnetic property was understood through the destruction of the cycloidal spin structure driven by an increase in single ion anisotropy and anharmonicity of the spin cycloid,40 as was evidenced from the direct observation of a partial suppression of the spin wave excitations from our far-infrared reflectance measurements at low temperature.41 A similar mechanism could be at play in the doped BiFeO3 system as well. In order to gain a better understanding, we have, in this work, directly studied the ferroelectric and magnetic properties of these doped samples through piezoresponse force microscopy (PFM) and magnetic force microscopy (MFM). Using the phase and ‘mag’ (short for magnitude) images from the PFM data, it is found that Ba-doped sample retains ferroelectricity, while the Ca-doped sample shows weakened ferroelectric properties. In contrast, MFM studies revealed enhanced magnetism for the Ca doped sample as compared to the pristine sample. These results corroborate the conclusions from our IR studies. In addition, the studies on Bi0.9A0.1FeO2.95 (A = Ba, Ca) revealed that Ca and the Ba/Ca co-doped sample show improved magnetic and magnetoelectric properties.42,43 This is also evident through the near-complete suppression of spin wave excitations observed in our far-infrared data on Ca-doped and co-doped samples brought about by the destruction of the spin cycloid via doping.37
Here, we present the results of extensive piezoelectric force microscopy (PFM) and magnetic force microscopy (MFM) studies that we carried out on Bi0.9A0.1FeO2.95 (A = Ba, Ca). All the samples were found to have piezoelectric response. We have acquired mag and phase images for all the samples. The obtained symmetric loops (phase and mag) due to switching of electric polarization suggest the ferroelectric behavior of the sample. From MFM measurements, the Ca-doped BiFeO3 sample among all is found to have improved magnetic properties as compared to its pristine counterpart.
2 Experimental
On doping with Ca and Ba in BiFeO3, a structural transition from rhombohedral to orthorhombic crystal structure is seen for the dopant concentration, x ≥ 0.1.44 Hence, a dopant concentration of 10% is chosen for our studies in order to retain the rhombohedral phase, as in pristine BiFeO3. Ceramic samples of BiFeO3 (BFO), Bi0.9Ba0.1FeO2.95 (BBFO), Bi0.9Ba0.05Ca0.05FeO2.95 (BBCFO) and Bi0.9Ca0.1FeO2.95 (BCFO) were synthesized through modified sol–gel method. Citric acid (C6H8O7), taken in a molar ratio of 1![[thin space (1/6-em)]](https://www.rsc.org/images/entities/char_2009.gif) :
:![[thin space (1/6-em)]](https://www.rsc.org/images/entities/char_2009.gif) 1 with metal nitrates, was first dissolved in a solvent of 100 ml distilled water and ethanol. Iron nitrate and bismuth nitrate with a molar ratio of 1
1 with metal nitrates, was first dissolved in a solvent of 100 ml distilled water and ethanol. Iron nitrate and bismuth nitrate with a molar ratio of 1![[thin space (1/6-em)]](https://www.rsc.org/images/entities/char_2009.gif) :
:![[thin space (1/6-em)]](https://www.rsc.org/images/entities/char_2009.gif) 1.05 were dissolved in the above solution and thoroughly mixed following which 5 ml of nitric acid and 5 ml of hydrogen peroxide were added to the solution with constant stirring. Then the solution was refluxed for 2 hours at 90 °C to form a gel, which was dried at 300 °C for 1 hour to get bismuth ferrite precursor in powder form. The obtained powder was calcined at 600 °C for one hour and the sintered at 850 °C to get the desired phase pure sample as confirmed from X-ray diffraction (XRD) measurements. Phase purity of the samples was confirmed through powder X-ray diffraction.44 These samples were pelletized into disc form having a radius of 10 mm and thickness of 1 to 2 mm. These pellets were then sintered at 850 °C for 6 hours. The density of the sintered pellet was found to be greater than 90% of the theoretical density. After this, these pellets were polished to mirror finish using diamond paste and then cleaned with acetone. Post polishing, the pellets were heated at 400 °C for 4 hours in order to remove any surface residual stress that may have been generated due to the mechanical polishing process. The high quality of the samples were also established from the infrared reflectance spectra of these samples,37,39 wherein we could observe all the allowed phonon modes (4A1 + 9E) corresponding to the rhombohedral phase, with no trace of any impurity phase. From Rietveld refinement of the X-ray diffraction patterns of these samples, a reduction of unit cell volume is observed in all the doped samples compared to the pristine sample.44 To mention specifically in terms of changes in local structure, Fe–O1 and Fe–O2 bond lengths as well as Fe1–O–Fe2 bond angle are all found to decrease in the case of the doped samples.37 The ΔV/V values of the doped samples with respect to the pristine sample are as follows: BBFO: −1.22%; BBCFO: −1.23% and BCFO: −2.08%. Thus, the BCFO sample is found to have the least unit cell volume, Fe–O bond lengths and bond angle. Moreover, the different types of magnetic interactions present in bismuth ferrite are expected to get influenced by this doping-induced increase in chemical pressure. Piezoresponse force microscopy (PFM) images of pristine and doped BFO samples were acquired using a scanning probe microscope (SPM) (NT-MDT, NTEGRA, Russia). An electrically conductive tip (A diamond-like carbon coated stiff cantilever (100 × 35 × 2 μm) having a stiffness constant k = 12 N m−1 with resonance frequency = 250 kHz) is employed. An ac bias voltage was used for measuring the piezoelectric response in the contact mode in PFM measurements. The amplitude (also called ‘mag’) of the cantilever deflection is directly proportional to the strength of the piezoresponse. The ‘phase’ part of the signal represents the orientation of the piezoelectric domains.45,46 Piezoresponse spectroscopy experiments were carried out in a voltage range of +20 to −20 V to see the ferroelectric switching behavior of each sample.
1.05 were dissolved in the above solution and thoroughly mixed following which 5 ml of nitric acid and 5 ml of hydrogen peroxide were added to the solution with constant stirring. Then the solution was refluxed for 2 hours at 90 °C to form a gel, which was dried at 300 °C for 1 hour to get bismuth ferrite precursor in powder form. The obtained powder was calcined at 600 °C for one hour and the sintered at 850 °C to get the desired phase pure sample as confirmed from X-ray diffraction (XRD) measurements. Phase purity of the samples was confirmed through powder X-ray diffraction.44 These samples were pelletized into disc form having a radius of 10 mm and thickness of 1 to 2 mm. These pellets were then sintered at 850 °C for 6 hours. The density of the sintered pellet was found to be greater than 90% of the theoretical density. After this, these pellets were polished to mirror finish using diamond paste and then cleaned with acetone. Post polishing, the pellets were heated at 400 °C for 4 hours in order to remove any surface residual stress that may have been generated due to the mechanical polishing process. The high quality of the samples were also established from the infrared reflectance spectra of these samples,37,39 wherein we could observe all the allowed phonon modes (4A1 + 9E) corresponding to the rhombohedral phase, with no trace of any impurity phase. From Rietveld refinement of the X-ray diffraction patterns of these samples, a reduction of unit cell volume is observed in all the doped samples compared to the pristine sample.44 To mention specifically in terms of changes in local structure, Fe–O1 and Fe–O2 bond lengths as well as Fe1–O–Fe2 bond angle are all found to decrease in the case of the doped samples.37 The ΔV/V values of the doped samples with respect to the pristine sample are as follows: BBFO: −1.22%; BBCFO: −1.23% and BCFO: −2.08%. Thus, the BCFO sample is found to have the least unit cell volume, Fe–O bond lengths and bond angle. Moreover, the different types of magnetic interactions present in bismuth ferrite are expected to get influenced by this doping-induced increase in chemical pressure. Piezoresponse force microscopy (PFM) images of pristine and doped BFO samples were acquired using a scanning probe microscope (SPM) (NT-MDT, NTEGRA, Russia). An electrically conductive tip (A diamond-like carbon coated stiff cantilever (100 × 35 × 2 μm) having a stiffness constant k = 12 N m−1 with resonance frequency = 250 kHz) is employed. An ac bias voltage was used for measuring the piezoelectric response in the contact mode in PFM measurements. The amplitude (also called ‘mag’) of the cantilever deflection is directly proportional to the strength of the piezoresponse. The ‘phase’ part of the signal represents the orientation of the piezoelectric domains.45,46 Piezoresponse spectroscopy experiments were carried out in a voltage range of +20 to −20 V to see the ferroelectric switching behavior of each sample.
MFM studies were carried out using a silicon probe, whose tip is coated with magnetic cobalt chromium (CoCr). The tip having a radius of 25–35 nm and resonant frequency of 40 kHz has a nominal coercivity of 0.04 T, magnetic moment of 10−13 emu and stiffness constant of 2.8 N m−1. The tip detects the magnetic interactions between the tip and the sample, which are then used to image the spatial distribution of magnetic fields and thus reconstruct the magnetic structure of the sample. During the measurement, the MFM tip is well lifted off from the sample surface in such a way that the magnetic forces (long range) and the atomic forces (short range) between the tip and sample surface can be distinguished from each other. MFM operates in this non contact mode, where the resonance frequency of the tip is in the range of 10–100 kHz. MFM maps the phase and the resonant frequency during the scanning of sample surface at a constant height. A repulsive magnetic force between the tip and sample surface shifts the resonance frequency to higher value and there is an increase in the phase shift resulting in brighter contrast, while an attractive magnetic force shifts the resonance curve to lower frequency and there is a decrease in the phase shift resulting in dark contrast. Here, MFM studies were carried out in dual pass mode. In the first pass, the tip is in contact mode to elucidate topography, whereas in the second pass the tip is kept at a constant height and follows the contours of the topography line to map the phase.47
3 Results and discussion
3.1 Pristine BiFeO3 ceramic pellet
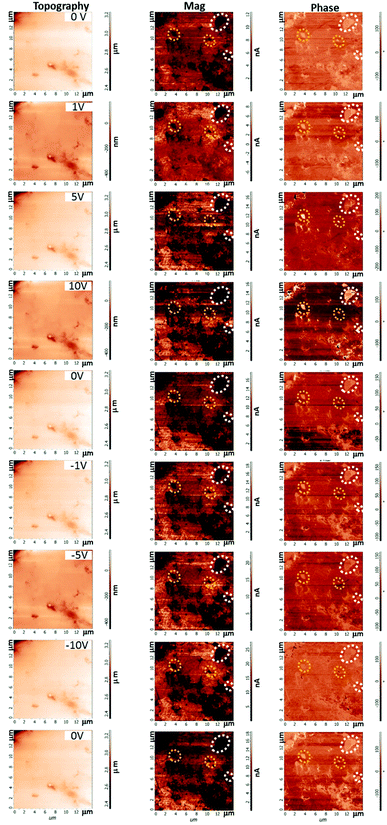
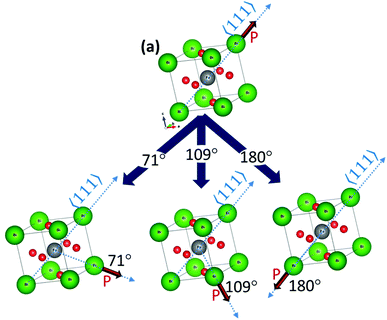
Further, the evolution of the piezoelectric domains have been followed with respect to applied negative dc voltage, where we could find correlated changes. Thus, the domains highlighted by yellow loops undergo switching at an applied dc voltage of 5 V, whereas the domains highlighted by white loops undergo switching at an applied dc voltage of 10 V. Correlations observed in PFM images are described further in relation to different possible switching angles. In the rhombohedral BiFeO3, there are three possible switching of ferroelectric domains, which are at an angle 71°, 109° and 180° with the polarization direction along 〈111〉pc pseudo cubic direction48,49 as shown in Fig. 2. As our sample is polycrystalline, the ferroelectric domains are randomly oriented. The underlying principle and the phenomenon of switching a ferroelectric domain in BiFeO3 through applying electrical energy are as follows.48
1. The applied electrical energy needs to overcome the energy barrier associated with polarization and stress energy of the ferroelectric domain and its surrounding domains.
2. Larger the applied electric field, larger is the switching angle i.e., the domain with larger switching angle requires ample amount of electrical energy for switching as the polarization vector undergoes a larger rotation. Whereas the smaller switching angle domain needs lesser amount of electrical energy as the polarization vector rotates through a smaller angle. Therefore, as we go from 71°–109°–180°-ferroelectric domains, the applied electrical energy needed for switching also increases accordingly.
3. The stress energy associated with a switched domain depends on switching angle for that domain. The 180°-switched domain is free from residual stress as the lattice distortion is same for initial and final state of 180° switching, while 109° and 180°-switched domains are associated with additional stress.
Therefore, the domains which showed switching at 5 V can be assigned to either 71° or 109°-type of ferroelectric domain as it requires lesser electrical energy to switch. Whereas those domains that undergo switching at 10 V are 180°-type of ferroelectric domains as they require relatively more electrical energy to switch.
3.1.2.1 Calculation of piezoelectric coefficient (d33). The piezoelectric coefficient of a material is a measure of response to applied electric field. Here, the longitudinal piezoelectric response is denoted as ‘d33’, where both electric field and piezoelectric response are in z-direction. The d33 value has been calculated by using the piezoresponse force spectroscopy corresponding to Vdc = 0 V. In a typical PFM, the modulation voltage Vac, which is applied between the tip and the ferroelectric material, leads to a vertical displacement of the tip. Since the tip is in mechanical contact with the sample surface, it precisely follows the piezo force from the sample surface. In the present study, the applied voltage on the microcrystals generates deformation i.e., elongation or contraction of the microcrystal. The piezoelectric coefficient d33 has been calculated by using the formula:50
| d33 = ΔSz/Ez | (1) |
| d33 = ΔSz/Ez | (2) |
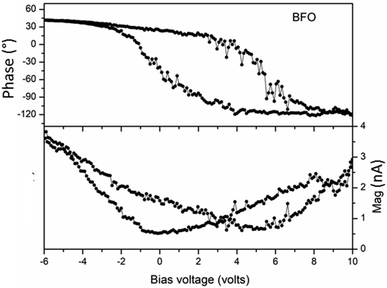
In PFM measurements, the magnitude of the tip vibration measured by the lock-in amplifier technique gives information on the piezoelectric strain. Therefore, the piezoelectric coefficient, d33, can be determined by using the formula as described in eqn (2). The value of d33 determined over a number of polar domains was found to be 70–80 pm V−1. In Table 1, we have listed the reported d33 values of BiFeO3 in various forms of sample and compared with the value obtained from the present study. The obtained d33 value is close to the reported value for polycrystalline BiFeO3 sample.5
Further, we have analyzed the ferroelectric behavior of the doped samples through PFM measurements to understand the doping effect on ferroelectric behavior.
3.2 BiFeO3:Ba2+ ceramic pellet
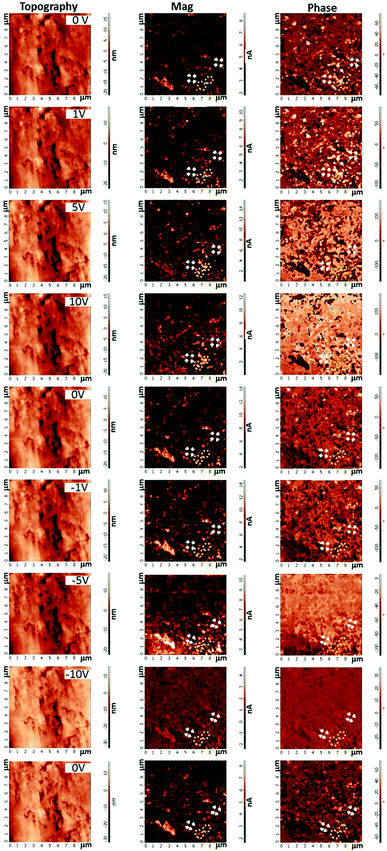
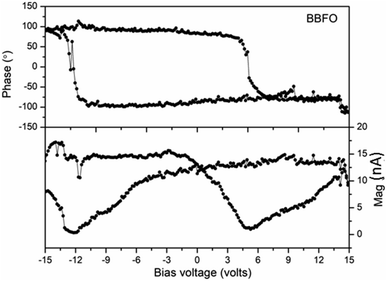
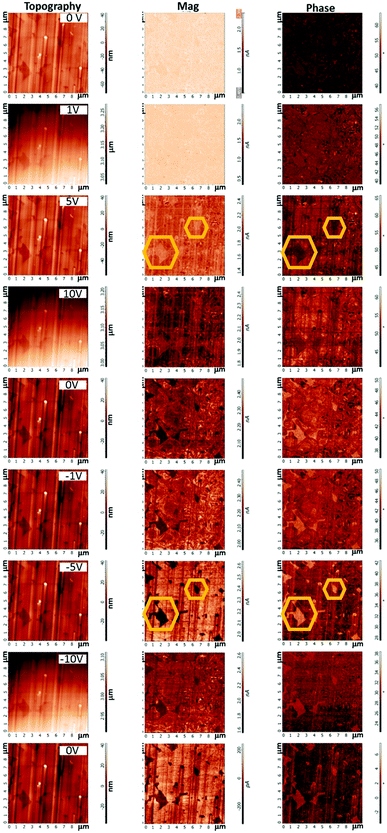
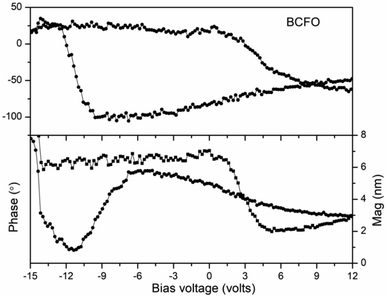
Next, we have followed their evolution with respect to applied positive and negative dc voltages to understand the switching behavior in this sample. It is clearly noticed that the observed piezoelectric domains show switching behavior through the reversing of the applied dc voltage. This gives evidence of the ferroelectric behavior in the sample. We have specifically followed a few selected ferroelectric domains (see the domains highlighted with loops) with respect to applied dc voltage. The domains highlighted by yellow colored loops show switching at 5 V and thus these are either 71° or 109°-ferroelectric domains, whereas the domains shown by white loops show switching at 10 V and hence, these domains are 180°-ferroelectric domains.
Ferroelectric nature of the Ba-doped sample is further confirmed through piezoresponse force spectroscopy, discussed below.
The piezoelectric coefficient, d33, has been determined by using the formula as described in eqn (2). The d33 value determined over a number of polar domains was found to be 70–80 pm V−1, which is similar to the d33 value observed in the pristine sample. Although, the lone pair over Bi3+ ion is responsible for the ferroelectric property, it is seen that 10% Ba doping at Bi site has not hampered the ferroelectric property of BiFeO3. This may be due to the larger ionic radius of Ba2+ ion compared to that of Bi3+ ion, which helps in preserving the ferroelectric property.
3.3 Ba and Ca co-doped BiFeO3
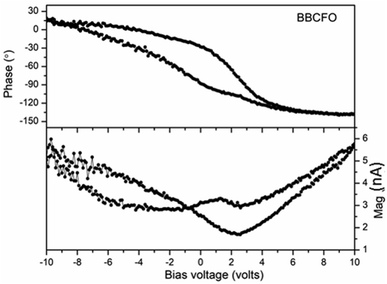
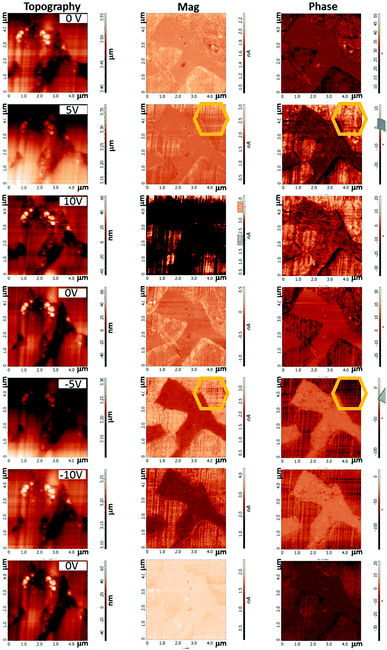
The piezoelectric coefficient, d33, of the co-doped sample determined by using eqn (2), was found to be in the range of 15–20 pm V−1. This shows that the ferroelectric property is substantially weakened in the co-doped sample. Since we have already seen that Ba doping at Bi3+ site does not hamper ferroelectricity much, the main reason for the reduction of the ferroelectric property in the co-doped sample is mainly because of the substitution of 5% Ca2+ ion at Bi3+ site.
3.4 BiFeO3:Ca2+ ceramic pellet
From the PFM measurements, the studied samples are all found to be ferroelectric to different degrees. In particular, Ca2+ doping at Bi3+ site of BiFeO3 significantly reduced its ferroelectric property, as a result of the simultaneous reduction of sample density and grain size.44 However Ba2+ doping doesn't alter the ferroelectric property, which is due to the larger ionic radius of Ba2+ ion compared to that of Bi3+. It should be noted here that all the investigated samples were sintered under same heat treatment conditions and for the same duration.
3.5 MFM studies
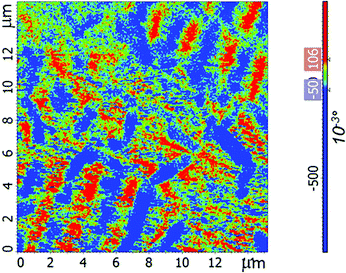
The magnetic properties of both the pristine and the doped samples have been investigated through magnetic force microscopy (MFM) measurements. First we have investigated the magnetic behavior of a hard disk through MFM studies and then compared with the magnetic properties of the studied samples. In the MFM phase image of the hard disk (Fig. 10), the magnetic domains, which get magnetized in perpendicularly upward and downward directions, are shown by red and blue colored fringes, respectively, while the magnetic domains which get magnetized along the plane of the hard disk, are shown in green color.We were able to acquire MFM images of the pristine BFO sample and the 10% Ca-doped sample, which are displayed in Fig. 11a and c, respectively. From the phase image of the pristine sample, we were able to get distinct magnetic domains. From the line profile of the corresponding phase image, the maximum magnitude of the phase deflection is found to be ∼0.1°, which gives clear indication of the existence of magnetic domains in the pristine sample. Thus, these MFM data point towards a weak magnetic behavior of the sample. On the other hand, we have clearly noticed bright and dark fringes in the phase image of BCFO sample shown in Fig. 11e. The dark and bright fringes are represented by the magnetic domains magnetized along upward and downward direction of the sample surface. Moreover, the line profile of the corresponding phase image also show clear evidence of the magnetic domains, as the magnitude of the phase deflection of BCFO is ∼0.2°. These observations point to an enhanced magnetism in BCFO sample. This also correlates well with the observed suppression of SWEs in BCFO sample from the infrared measurements indicating improvement in the magnetic property on account of a significant increase in single ion anisotropy.37
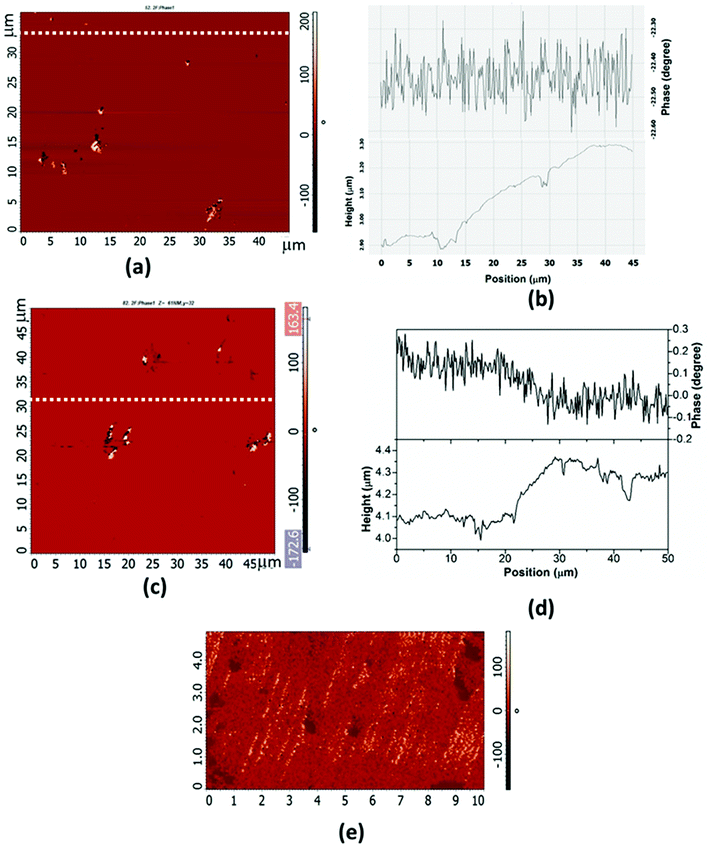 | ||
| Fig. 11 (a) MFM image and (b) the corresponding line profile of phase and height BFO sample at y = 35 μm. (c) MFM image and (d) the corresponding line profile of phase and height BCFO sample at y = 32 μm. (e) Expanded region of Fig. 11c showing bright and dark fringes. | ||
4 Conclusion
Piezoelectric and magnetic force microscopy studies have been carried out on both pristine and doped BiFeO3 samples. From the PFM measurements, the distributions of piezoelectric domains are observed in all the studied samples. Moreover, the phase and mag loops of the studied samples obtained from piezoresponse force spectroscopy show switching, saturation and hysteresis behavior. The d33 value is calculated from mag loop which is found to be 70–80 pm/V for pristine BiFeO3. We have found that the d33 values decrease noticeably from the pristine BiFeO3 case to the Ca-doped case. Concomitantly, the MFM studies on these samples show improved magnetic property for the Ca-doped BiFeO3 as compared to the pristine sample. These results are in complete agreement with our infrared results, where a suppression of the SWE modes leading to enhanced magnetism in Ca-doped BiFeO3 was observed.Conflicts of interest
There are no conflicts of interest to declare.Acknowledgements
Authors would like to thank Dr G. Amarendra and Dr Sandip Dhara for their constant support.References
- B. Ramachandran and M. S. R. Rao, Low temperature magnetocaloric effect in polycrystalline BiFeO3 ceramics, Appl. Phys. Lett., 2009, 95, 142505 CrossRef.
- J.-G. Park, M. D. Le, J. Jeong and S. Lee, Structure and spin dynamics of multiferroic BiFeO3, J. Phys.: Condens. Matter., 2014, 26, 433202 CrossRef PubMed.
- P. Ravindran, R. Vidya, A. Kjekshus, H. Fjellvåg and O. Eriksson, Theoretical investigation of magnetoelectric behavior in BiFeO3, Phys. Rev. B: Condens. Matter Mater. Phys., 2006, 74, 224412 CrossRef.
- J. Neaton, C. Ederer, U. Waghmare, N. Spaldin and K. Rabe, First-principles study of spontaneous polarization in multiferroic BiFeO3, Phys. Rev. B: Condens. Matter Mater. Phys., 2005, 71, 014113 CrossRef.
- V. Shvartsman, W. Kleemann, R. Haumont and J. Kreisel, Large bulk polarization and regular domain structure in ceramic BiFeO3, Appl. Phys. Lett., 2007, 90, 172115 CrossRef.
- R. Zeches, M. Rossell, J. Zhang, A. Hatt, Q. He, C.-H. Yang, A. Kumar, C. Wang, A. Melville and C. Adamo, A strain-driven morphotropic phase boundary in BiFeO3, Science, 2009, 326, 977 CrossRef CAS PubMed.
- A. J. Hatt, N. A. Spaldin and C. Ederer, Strain-induced isosymmetric phase transition in BiFeO3, Phys. Rev. B: Condens. Matter Mater. Phys., 2010, 81, 054109 CrossRef.
- C. Xu, B. Xu, B. Dupé and L. Bellaiche, Magnetic interactions in BiFeO3: A first-principles study, Phys. Rev. B: Condens. Matter Mater. Phys., 2019, 99, 104420 CrossRef CAS.
- I. Sosnowska and A. K. Zvezdin, Origin of the long period magnetic ordering in BiFeO3, J. Magn. Magn. Mater., 1995, 140–144, 167–168 CrossRef CAS.
- J. Gebhardt and A. M. Rappe, Doping of BiFeO3: A comprehensive study on substitutional doping, Phys. Rev. B: Condens. Matter Mater. Phys., 2018, 98, 125202 CrossRef CAS.
- S. Gupta, M. Pal, M. Tomar, R. Guo, A. Bhalla and V. Gupta, Ferroelectric and magnetic domain mapping of magneto-dielectric Ce doped BiFeO3 thin films, J. Alloys Compd., 2021, 882, 160698 CrossRef CAS.
- D. V. Karpinsky, M. V. Silibin, A. V. Trukhanov, A. L. Zhaludkevich, T. Maniecki, W. Maniukiewicz, V. Sikolenko, J. A. Paixão and V. A. Khomchenko, A correlation between crystal structure and magnetic properties in co-doped BiFeO3 ceramics, J. Phys. Chem. Solids, 2019, 126, 164 CrossRef CAS.
- F. S. Jesús, A. M. Bolarín-Miro, C. A. Cortes-Escobedo, A. Barba-Pingarron and F. Pedro-García, Enhanced ferromagnetic and electric properties of multiferroic BiFeO3 by doping with Ca, J. Alloys Compd., 2020, 824, 153944 CrossRef.
- T. Wang, S.-H. Song, Q. Ma, M.-L. Tan and J.-J. Chen, Highly improved multiferroic properties of Sm and Nb co-doped BiFeO3 ceramics prepared by spark plasma sintering combined with sol–gel powders, J. Alloys Compd., 2019, 795, 60 CrossRef CAS.
- I. Makoed, V. Prigodich, K. Yanushkevich, A. Zhivulko, V. Zhivulko, A. Galias, O. Demidenko and D. Krivchenya, Effect of Co-Doping on Magnetic Properties of Bismuth Ferrite, Acta Phys. Pol., A, 2020, 137, 985 CrossRef CAS.
- A. Molaka, D. K. Mahato and A. Z. Szeremet, Synthesis and characterization of electrical features of bismuth manganite and bismuth ferrite: effects of doping in cationic and anionic sublattice: Materials for applications, Prog. in Cryst. Growth and Charact.of Mats., 2018, vol. 64, p. 1 Search PubMed.
- H. Yamamoto, T. Kihara, K. Oka, M. Tokunaga, K. Mibu and M. Azuma, Spin Structure Change in Co-Substituted BiFeO3, J. Phys. Soc. Jpn., 2016, 85, 064704 CrossRef.
- Z. V. Gareeva, K. A. Zvezdin, A. P. Pyatakov and A. K. Zvezdin, Novel type of spin cycloid in epitaxial bismuth ferrite films, J. Magn. Magn. Mater., 2019, 469, 593 CrossRef CAS.
- S. R. Burns, O. Paull, J. Juraszek, V. Nagarajan and D. Sando, The Experimentalist’s Guide to the Cycloid, or Noncollinear Antiferromagnetism in Epitaxial BiFeO3, Adv. Mater., 2020, 32, 2003711 CrossRef CAS PubMed and references therein..
- F. Bai, J. Wang, M. Wuttig, J. Li, N. Wang, A. P. Pyatakov, A. Zvezdin, L. Cross and D. Viehland, Destruction of spin cycloid in (111) c-oriented BiFeO3 thin films by epitiaxial constraint: enhanced polarization and release of latent magnetization, Appl. Phys. Lett., 2005, 86, 032511 CrossRef.
- G. A. Gomez-Iriarte, C. Labre, L. A. S. de Oliveira and J. P. Sinnecker, Pure phase BiFeO3 thin films sputtered over Si: A new route towards high magnetization, J. Magn. Magn. Mater., 2018, 460, 83 CrossRef CAS.
- S. Huang, F. Hong, Z. Xia, F. Yang, X. Zhang, G. Xiao, Y. Song, D. Jiang, H. Deng, Z. Ouyang, J. Wang, Z. Tian, J. Han, L. Yao, A. Forget, D. Colson and Z. Cheng, Multiferroic behavior from synergetic response of multiple ordering parameters in BiFeO3 single crystal under high magnetic field up to 50 Tesla, J. Appl. Phys., 2020, 127, 044101 CrossRef CAS.
- S. Kawachi, S. Miyahara, T. Ito, A. Miyake, N. Furukawa, J. Yamaura and M. Tokunaga, Direct coupling of ferromagnetic moment and ferroelectric polarization in BiFeO3, Phys. Rev. B, 2019, 100, 140412–1 CrossRef.
- M. Tokunaga, M. Akaki, T. Ito, S. Miyahara, A. Miyake, H. Kuwahara and N. Furukawa, Magnetic control of transverse electric polarization in BiFeO3, Nat. Commun., 2015, 6, 5878 CrossRef CAS PubMed.
- U. Nagel, R. S. Fishman, T. Katuwal, H. Engelkamp, D. Talbayev, H. Taek Yi, S.-W. Cheong and T. Room, Terahertz Spectroscopy of Spin Waves in Multiferroic BiFeO3 in High Magnetic Fields, Phys. Rev. Lett., 2013, 110, 257201 CrossRef CAS PubMed.
- R. S. Fishman, Field dependence of the spin state and spectroscopic modes of multiferroic BiFeO3, Phys. Rev. B: Condens. Matter Mater. Phys., 2013, 87, 224419 CrossRef.
- M. Tokunaga, M. Azuma and Y. Shimakawa, High-field study of multiferroic BiFeO3, J. Phys.: Conf. Ser., 2010, 200, 012206 CrossRef.
- J. Buhot, C. Toulouse, Y. Gallais, A. Sacuto, R. de Sousa, D. Wang, L. Bellaiche, M. Bibes, A. Barthélémy, A. Forget, D. Colson, M. Cazayous and M.-A. Measson, Driving spin excitations by hydrostatic pressure in BiFeO3, Phys. Rev. Lett., 2015, 115, 267204 CrossRef CAS PubMed.
- D. P. Kozlenko, A. A. Belik, A. V. Belushkin, E. V. Lukin, W. G. Marshall, B. N. Savenko and E. Takayama-Muromachi, Antipolar phase in multiferroic BiFeO3 at high pressure, Phys. Rev. B: Condens. Matter Mater. Phys., 2011, 84, 094108 CrossRef.
- R. Haumont, P. Bouvier, A. Pashkin, K. Rabia, S. Frank, B. Dkhil, W. A. Crichton, C. A. Kuntscher and J. Kreisel, Effect of high pressure on multiferroic BiFeO3, Phys. Rev. B: Condens. Matter Mater. Phys., 2009, 79, 184110 CrossRef.
- E. Ramos, A. Cardona-Rodriguez, D. Carranza-Celis, R. Gonzalez-Hernandez, D. Muraca and J. G. Ramírez, Strain-controlled ferromagnetism in BiFeO3 nanoparticles, J. Phys.: Condens. Matter, 2020, 32, 185703 CAS.
- I. Aupiais, P. Hemme, M. Allen, A. M. Scida, X. Lu, C. Ricolleau, Y. Gallais, A. Sacuto, S. S. Wong, R. de Sousa and M. Cazayous, Impact of the surface phase transition on magnon and phonon excitations in BiFeO3 nanoparticles, Appl. Phys. Lett., 2020, 116, 172903 CrossRef.
- W. Li, F. Wang, G. Fu, Z. Ren and G. Han, Ferroelectric Polarization Induced Selective Growth of BiFeO3 Nanocrystals with a Remarkable Ferromagnetism, Eur. J. Inorg. Chem., 2019, 1945 CrossRef.
- N. A. Lomanova, V. V. Panchuk, V. G. Semenov, I. V. Pleshakov, M. P. Volkov and V. V. Gusarov, Bismuth orthoferrite nanocrystals: magnetic characteristics and size effects, Ferroelectrics, 2020, 569, 240 CrossRef CAS.
- J. Bertinshaw, R. Maran, S. J. Callori, V. Ramesh, J. Cheung, S. A. Danilkin, W. T. Lee, S. Hu, J. Seidel and N. Valanoor, Direct evidence for the spin cycloid in strained nanoscale bismuth ferrite thin films, Nat. Commun., 2016, 7, 12664 CrossRef CAS PubMed.
- J. Landers, S. Salamon, M. Escobar Castillo, D. Lupascu and H. Wende, Mossbauer study of temperature-dependent cycloidal ordering in BiFeO3 nanoparticles, Nano Lett., 2014, 14, 6061 CrossRef CAS PubMed.
- B. K. Das, T. N. Sairam, R. Balakrishnan and M. R. Rao, Chemical pressure induced near-complete suppression of spin-wave excitations in Bi0. 9A0. 1FeO2. 95 (A= Ba, Ca), J. Phys. D: Appl. Phys., 2020, 53, 495302 CrossRef.
- B. Ramachandran and M. R. Rao, Low temperature magnetocaloric effect in polycrystalline BiFeO3 ceramics, Appl. Phys. Lett., 2009, 95, 142505 CrossRef.
- B. K. Das, B. Ramachandran, A. Dixit, M. R. Rao, R. Naik, A. Sathyanarayana, T. N. Sairam and G. Amarendra, Emergence of two-magnon modes below spin-reorientation transition and phonon-magnon coupling in bulk BiFeO3: An infrared spectroscopic study, J. Alloys Compd., 2020, 154754 CrossRef CAS.
- J. Jeong, M. D. Le, P. Bourges, S. Petit, S. Furukawa, S.-A. Kim, S. Lee, S. W. Cheong and J.-G. Park, Temperature-Dependent Interplay of Dzyaloshinskii-Moriya Interaction and Single-Ion Anisotropy in Multiferroic BiFeO3, Phys. Rev. Lett., 2014, 113, 107202 CrossRef PubMed.
- B. K. Das, T. N. Sairam, R. Balakrishnan and M. S. R. Rao, Single-ion anisotrpy driven splitting of spin wave resonances in BiFeO3 at low temperature, J. Phys.: Condens. Matter, 2020, 32, 405701 CrossRef CAS PubMed.
- B. Ramachandran, A. Dixit, R. Naik, G. Lawes and M. Ramachandra Rao, Dielectric relaxation and magneto-dielectric effect in polycrystalline Bi0.9Ca0.1FeO2.95, Appl. Phys. Lett., 2012, 100, 252902 CrossRef.
- R. Balakrishnan, A. Dixit, R. Naik and M. S. R. Rao, Enhancement in electrical and magnetodielectric properties of Ca-and Ba-doped BiFeO3 polycrystalline ceramics, J. Am. Ceram. Soc., 2018, 101, 782–788 CrossRef CAS.
- B. Ramachandran, A. Dixit, R. Naik, G. Lawes and M. Ramachandra Rao, Weak ferromagnetic ordering in Ca doped polycrystalline BiFeO3, J. Appl. Phys., 2012, 111, 023910 CrossRef.
- S. V. Kalinin and D. A. Bonnell, Imaging mechanism of piezoresponse force microscopy of ferroelectric surfaces, Phys. Rev. B: Condens. Matter Mater. Phys., 2002, 65, 124508 CrossRef.
- R. K. Vasudevan, S. Jesse, Y. Kim, A. Kumar and S. V. Kalinin, Spectroscopic imaging in piezoresponse force microscopy: New opportunities for studying polarization dynamics in ferroelectrics and multiferroics, MRS Commun., 2012, 2, 61–73 CrossRef CAS.
- O. Kazakova, R. Puttock, C. Barton, H. Corte-León, M. Jaafar, V. Neu and A. Asenjo, Frontiers of magnetic force microscopy, J. Appl. Phys., 2019, 125, 060901 CrossRef.
- Y. Jin, X. Lu, J. Zhang, Y. Kan, H. Bo, F. Huang, T. Xu, Y. Du, S. Xiao and J. Zhu, Studying the Polarization Switching in Polycrystalline BiFeO3 Films by 2D Piezoresponse Force Microscopy, Sci. Rep., 2015, 5, 12237 CrossRef CAS PubMed.
- S. Baek and C. Eom, Reliable polarization switching of BiFeO3, Philos. Trans. R. Soc., A, 2012, 370, 4872–4889 CrossRef CAS PubMed.
- A. Gruverman and S. V. Kalinin, Piezoresponse force microscopy and recent advances in nanoscale studies of ferroelectrics, J. Mater. Sci., 2006, 41, 107–116 CrossRef CAS.
- S. Wu, J. Zhang, X. Liu, S. Lv, R. Gao, W. Cai, F. Wang and C. Fu, Micro-area ferroelectric, piezoelectric and conductive properties of single BiFeO3 nanowire by scanning probe microscopy, Nanomaterials, 2019, 9, 190 CrossRef CAS PubMed.
- J. Zhao, H. Lu, J. Sun and B. Shen, Thickness dependence of piezoelectric property of ultrathin BiFeO3 films, Phys. B, 2012, 407, 2258–2261 CrossRef CAS.
- Y. Chu, T. Zhao, M. Cruz, Q. Zhan, P. Yang, L. Martin, M. Huijben, C.-H. Yang, F. Zavaliche and H. Zheng, Ferroelectric size effects in multiferroic BiFeO3 thin films, Appl. Phys. Lett., 2007, 90, 252906 CrossRef.
- J. M. Vila-Fungueiriño, A. Gómez, J. Antoja-Lleonart, J. Gázquez, C. Magén, B. Noheda and A. Carretero-Genevrier, Direct and converse piezoelectric responses at the nanoscale from epitaxial BiFeO3 thin films grown by polymer assisted deposition, Nanoscale, 2018, 10, 20155–20161 RSC.
| This journal is © The Royal Society of Chemistry 2022 |

