
 Open Access Article
 This Open Access Article is licensed under a Creative Commons Attribution-Non Commercial 3.0 Unported Licence
Ultrasensitive flower-like TiO2/Ag substrate for SERS detection of pigments and melamine†
Weiye Yang abc,
Quanhong Ouabc,
Chenyan Liabc,
Mingming Chengabc,
Weijun Liabc and
Yingkai Liu*abc
abc,
Quanhong Ouabc,
Chenyan Liabc,
Mingming Chengabc,
Weijun Liabc and
Yingkai Liu*abc
aYunnan Key Laboratory of Opto-Electronic Information Technology, Yunnan Normal University, Kunming 650500, China
bCollege of Physics and Electronic Information, Yunnan Normal University, Kunming 650500, China
cKey Laboratory of Advanced Technique & Preparation for Renewable Energy Materials, Ministry of Education, Yunnan Normal University, Kunming 650500, China. E-mail: liuyingkai99@163.com
First published on 2nd March 2022
Abstract
TiO2 flower like nanomaterials (FLNMs) are fabricated via a hydrothermal method and Ag nanoparticles (NPs) are deposited via electron beam evaporation. Several biological pigments (CV, R6G and RhB) are selected as target molecules to investigate their surface enhanced Raman scattering (SERS) property. The results demonstrate ultrasensitivity and high reproducibility. They reveal that the limit of detection (LOD) is 4.17 × 10⁻¹⁶ M and the enhancement factor (EF) is 2.87 × 10¹⁰ for CV, and the LOD is 5.01 × 10⁻¹⁶ M and 7.94 × 10⁻¹⁴ M for R6G and RhB, respectively. To assess the reproducibility on TiO2/Ag FLNMs SERS substrates, they are tested with 1.0 × 10⁻¹³ M of CV, 1.0 × 10⁻¹³ M of R6G and 1.0 × 10⁻¹¹ M of RhB, respectively. The relative standard deviations (RSD) are less than 12.93%, 13.52% and 11.74% for CV, R6G and RhB, respectively. In addition, we carry out melamine detection and the LOD is up to 7.41 × 10⁻¹⁰ M, which is over 1000 times lower than the severest standards in the world. Therefore, the obtained TiO2 FLNMs have potential application in detecting illegal food additives.
1. Introduction
Surface enhanced Raman scattering (SERS) has become an ultrasensitive and attractive spectroscopic technology in recent decades, which has generated great attention due to its nondestructive testing properties and high sensitivity. Generally, it is employed in the bioscience and medical fields, and analytical chemistry.1–3 In actual application, SERS substrates are critical for detecting chemical molecules, not only high SERS performance, but also low cost and better reproducibility is demanded for a convenient SERS substrate.4 Furthermore, as a general analysis technique, the operation should be simpler. Traditional substrates are focused on precious metals such as Au and Ag with morphologies of nanoparticles (NPs), nanocubes, nanorods, nanostars and core–shell NPs.5,6 Due to their high cost, the semiconductor SERS substrates7 have attracted significant attention, such as TiO2, ZnO, CdS, CuO, SiO2 and ZnS, etc.8–14TiO2 is a typical semiconductor material. It has been applied to environmental protection and solar energy due to its photocatalytic performance, chemical ability, and non-toxic property.15 Among these applications, TiO2 nanoparticles (NPs) have been reported as active SERS substrates. The enhancement produced by TiO2 NPs has been ascribed to charge-transfer mechanisms such as TiO2-to-molecule and molecule-to-TiO2 transfers.16 In particular, Ag is considered to be one of the most excellent candidates for SERS application due to its highly plasmonic properties. Ag NPs not only supply surface plasmon resonance, but also interact with the incident laser to form electrons and holes between the substrate and the precious metal to enhance SERS performance. It is a high-efficiency strategy to deposit Ag NPs on the surface of TiO2 for the generation of electrons and holes. Therefore, it is clearly that TiO2 decorated by Ag NPs would be an excellent candidate for SERS substrate.17
Pigments, as crystal violet (CV), Rhodamine 6G (R6G) and Rhodamine B (RhB) are stable organic contaminants which have been widely used in various textile, pharmaceutical industries and aquacultures. Unfortunately, the inevitable pollution that discharged into drinking water are mutagenic and toxigenic/teratogenic towards living organisms, which can give rise to the increasing morbidities of tumor and cancer growth in bacteria, fishes, and mammalian cells.18 Melamine is a triazine nitrogen organic compound and is deliberately mingled in milk and dairy drinks, which poses a major threat to food safety.19 There are various methods to detect pigments and melamine, such as high performance liquid chromatography (HPLC),20 liquid chromatography tandem mass spectrometry (LC-MS/MS),21 gas chromatography.22 However, these traditional techniques are either complicated or low detection efficiency, high skill for operators. Compared with traditional methods, SERS technologies establish a simpler operation, convenient, and high sensitive technology in the future.
In this work, a newly SERS substrate is composed of TiO2 flower like nanomaterials (FLNMs) and Ag NPs, TiO2 FLNMs are prepared via a hydrothermal method and Ag NPs are deposited via the electron beam evaporation. It is used to detect pigment (CV, R6G and RhB) and melamine. This proposed SERS substrates achieve ultrasensitivity and high reproducibility. The results show that the proposed SERS method has a great potential for detection of illegal food additives with ultralow concentrations.
2. Methods and experimental section
2.1 Reagents and instruments
Ti films (99.999% purity) are purchased from Haiyuan Aluminum Corporation, hydrofluoric acid (HF, 40 wt%) is supplied by Tianjin feng chuan chemical reagent Corporation, crystal violet (CV), Rhodamine 6G (R6G) and Rhodamine B (RhB) are supplied by Sinopharm Chemical Reagent Corporation, melamine is purchased from Maklin Corporation. All experimental water is deionized water with the resistance of 18.2 MΩ. All reagents are analytical grade and used as received.The sample morphology is characterized by scanning electron microscope (SEM, Quanta FEG 250, FEI, USA) and its microstructure is further explored by transmission electron microscopy (TEM, JEOL 2010, Japan). X-ray diffraction (XRD, Ultima IV Rigaku, Japan) is used to verify phase of substrates. X-ray photoelectron spectroscopy (XPS, Thermo fisher Scientific, USA) is performed to reveal chemical valence states and chemical composition. The SERS signal is acquired from a confocal Raman spectrometer (Andor, England).
2.2 Preparation of TiO2 FLNMs
TiO2 FLNMs are prepared by a hydrothermal reaction between Ti film and HF solution according to the previous work.23 The preparation of TiO2/Ag FLNMs is followed our previous studies.24The mainly process is as follows: firstly, Ti films (3 cm × 1 cm) are treated by a basic procedure of decontamination. Then, Ti films and 10 mmol HF 60 mL are transferred into a 100 mL Teflon autoclave, maintaining at the temperature of 110 °C for 6 h. After that, Ti films are rinsed with deionized water. Finally, TiO2 films are dried at 80 °C and the resultant sample is obtained. The general reaction equations are as follows.
| Ti + 6HF → H2TiF6 + 2H2↑ | (1) |
| H2TiF6 + 4H2O → Ti(OH)4 + 6HF | (2) |
| Ti(OH)4 → TiO2 + 2H2O | (3) |
2.3 Preparation of TiO2/Ag FLNMs
Ag NPs are deposited on the surface of TiO2 FLNMs by electron beam evaporation. Evaporation rate is 0.1 Å s−1 and the thickness of Ag NPs is 6 nm (Fig. S1†). Thus, we obtain TiO2/Ag FLNMs.2.4 SERS measurement
Generally, the probe molecules are dropped on a substrate and then dry before SERS detection. Moreover, the coffee ring during the drying make the probe molecules uniformly distribute, led to poor reproducibility.25,26 To alleviate this drawback, improving the detection efficiency and the uniformity of Raman signal, SERS test is examined in aqueous solution. First, TiO2/Ag FLNMs films are immersed in the prepared solution for 3 h to achieve adsorption equilibrium. Then SERS substrate is put into a home-made quartz slot (15 mm × 15 mm × 1 mm) containing the corresponding solution covered with the cover glass. The SERS measurements are carried out with a confocal microscopy Raman spectrometer system. During SERS examination, the excitation laser is 532 nm. A 50× microscope objective is selected and 1200 (L mm−1) grating is used. The acquisition time is 10 s and the accumulation number is three.3. Results and discussion
3.1 Structure and morphology
The morphology is firstly characterized by scanning electron microscope (SEM), SEM images of TiO2 FLNMs are displayed in Fig. 1(a and b). Obviously, it shows that TiO2 comprise abundant flower-like aggregates and have almost the same morphology. The size of TiO2 FLNMs are around 0.9–1.7 μm (Fig. 1(e)). Fig. 1(c and d) portray SEM images of TiO2/Ag FLNMs covered with Ag NPs with diameter of about 20–60 nm (Fig. 1(f)).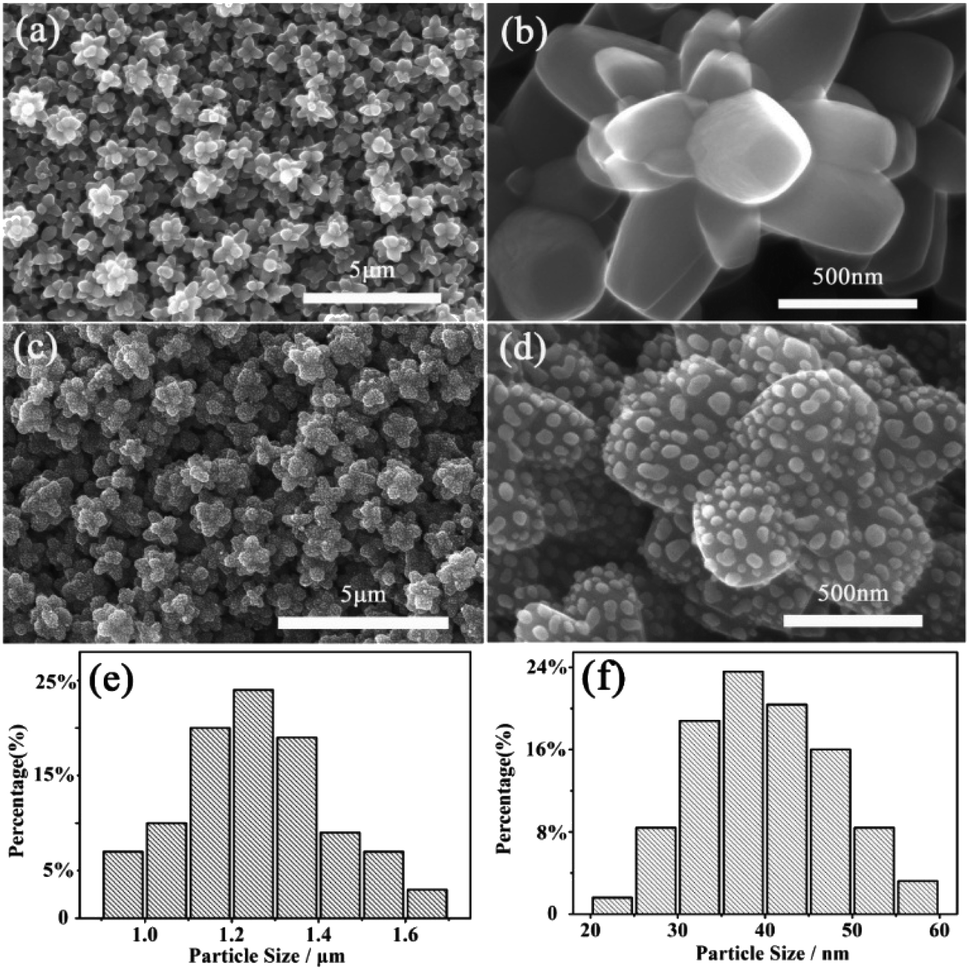 | ||
| Fig. 1 SEM images of the samples. (a and b) TiO2 FLNMs at low and high magnifications, respectively; (c and d) TiO2/Ag FLNMs at low and high magnifications, respectively. (e and f) Particle size distribution histograms of TiO2 FLNMs and Ag NPs, respectively. | ||
To further investigate structure of TiO2/Ag FLNMs, The microstructures are analyzed by Transmission Electron Microscope (TEM) (Fig. 2(a)). It reveals that the surface of the flower like TiO2 material is covered with Ag NPs. Fig. 2(b) is a high-resolution TEM (HRTEM) images of TiO2 FLNMs. The lattice fringes between nearby planes is 0.237 nm, corresponding to the (004) plane of anatase TiO2. Fig. 2(c) is HRTEM image of the Ag NPs. The fringe spacing is 0.204 nm, matched with the (200) plane of the cubic Ag. From SEM images and TEM images, TiO2/Ag FLNMs are formed.
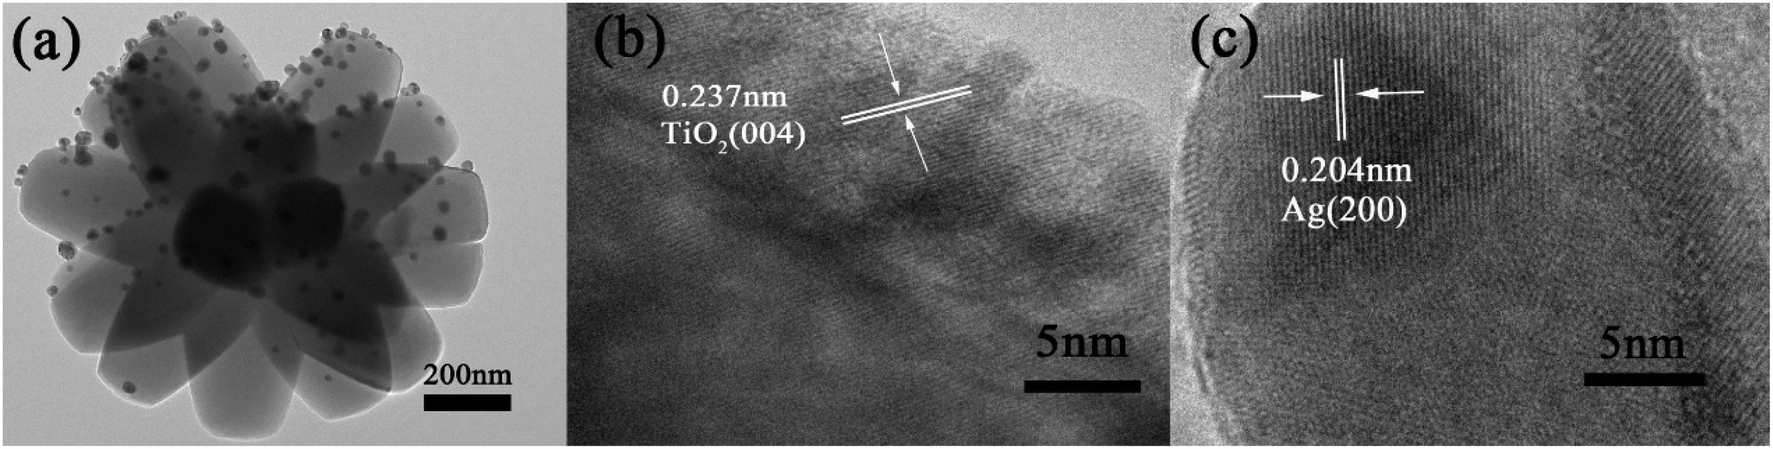 | ||
| Fig. 2 TEM and HRTEM images of TiO2/Ag FLNMs. (a) TEM images; (b) HRTEM of TiO2; (c) HRTEM of Ag NP. | ||
The crystal phase structure of TiO2 FLNMs and TiO2/Ag FLNMs are further demonstrated by X-ray diffraction (XRD). Test conditions: X-ray source is a Cu-Kα1 target (λ = 1.5406 Å), the scanning angle range of 2θ was 10–80°, the voltage was 40 kV, the current is 35 mA, the step size was 0.02°, and the scanning speed is 0.25 s. All diffraction peaks in Fig. 3 are indexed to tetragonal structure TiO2 with lattice parameters of a = 3.785 Å, b = 3.785 Å, c = 9.514 Å (JCPDS No. 21-1272). The diffraction peaks are sharp, indicating high crystalline.
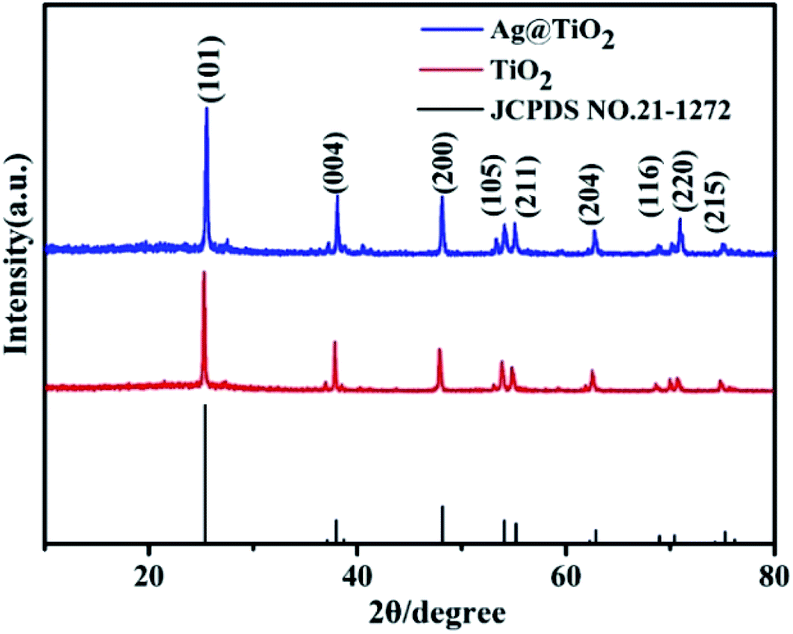 | ||
| Fig. 3 XRD pattern of TiO2 FLNMs and TiO2/Ag FLNMs. | ||
The diffraction angles 2θ located at 25.28°, 37.80°, 48.05°, 53.89°, 55.06°, 62.88°, 68.76°, 70.31° and 75.03° are ascribed to the (101), (004), (200), (105), (211), (204), (116), (220) and (215) planes of anatase TiO2. The blue curve belongs to the TiO2/Ag FLNMs. No diffraction peaks of Ag are observed, probably because the ultrathin of deposited Ag film and low content.
3.2 XPS spectrum
X-ray photoelectron spectroscopy (XPS) is employed to analyze the elemental composition and chemical states of TiO2/Ag FLNMs, as denoted in Fig. 4. In order to acquire accurate binding energy, the C 1s at 284.5 eV is utilized as the calibration. Fig. 4(a) displays the full scan XPS spectrum. It indicates that TiO2/Ag FLNMs include Ti, O, C, F and Ag elements. F element originates from the residual of HF through the hydrothermal reaction. The peak at 684.1 eV belongs to F− absorbed on the surface of TiO2.27 Fig. 4(b) reveals the XPS bands for Ti 2p region. The peaks at 458.6 and 464.3 eV are assigned to Ti 2p3/2 and Ti 2p1/2, respectively, suggesting the presence of Ti4+ ions.28 Fig. 4(c) is XPS band of O 1s. The characteristic peak of O 1s is included of two peaks fitted by Gaussian equation (Avantage, Thermo Fisher Scientific, USA). The peak located at 530. 8 eV comes from the O–Ti bonding, and the peak at 532.8 eV is ascribed to O2 adsorption. XPS band of Ag 3d is shown in Fig. 4(d). The peaks at 367.3 and 373.3 eV are belonged to Ag 3d5/2 and Ag 3d3/2, respectively, revealing that Ag is deposited on the surface of the TiO2 FLNMs.29 These results demonstrate the successfully preparation of TiO2/Ag FLNMs.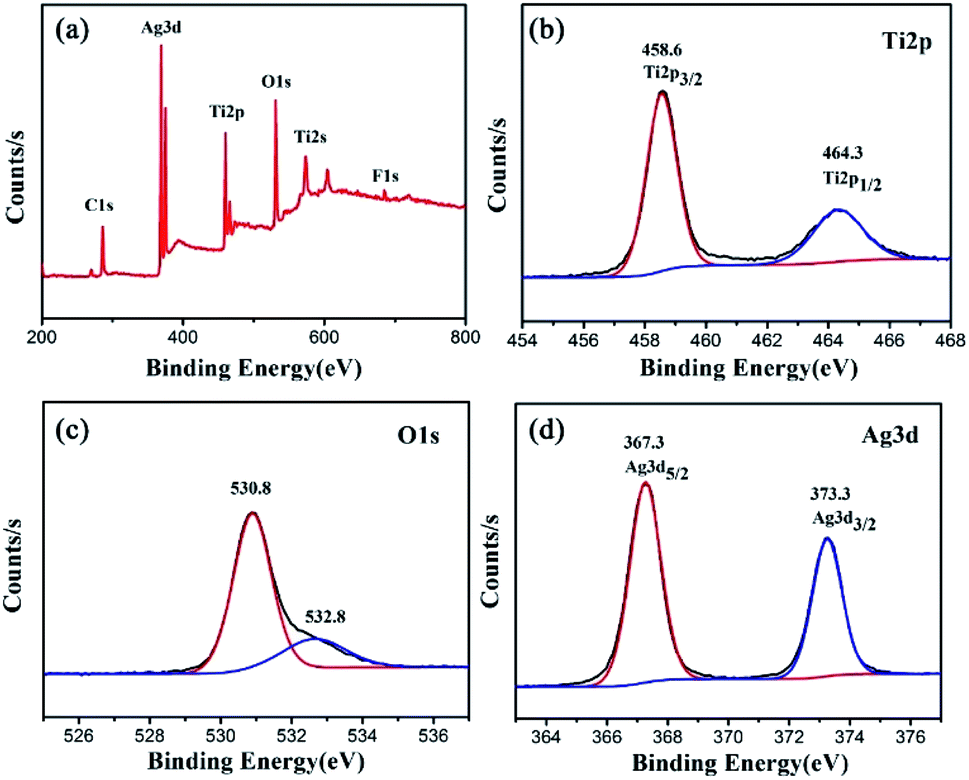 | ||
| Fig. 4 XPS analyzation of TiO2/Ag FLNMs. (a) Survey scan; (b) Ti 2p; (c) O 1 s; (d) Ag 3d. | ||
3.3 SERS applications
Pigments (CV, R6G and RhB) have been worldwide applications and as a biological stain, fungicide in medicine, food additives and aquaculture. However, it is a strong carcinogen and clastogene. On the other hand, melamine is a cheap and easily accessible organic compound which is commonly used for dairy drinks throughout the world. These drugs recently have been restricted for use in the European Union, the United States, China, and many other countries. Because of their low cost high efficiency and easy accessibility, they are still illegally used. Therefore, sensitive detection of pigments and melamine is very promising for health and safety applications.30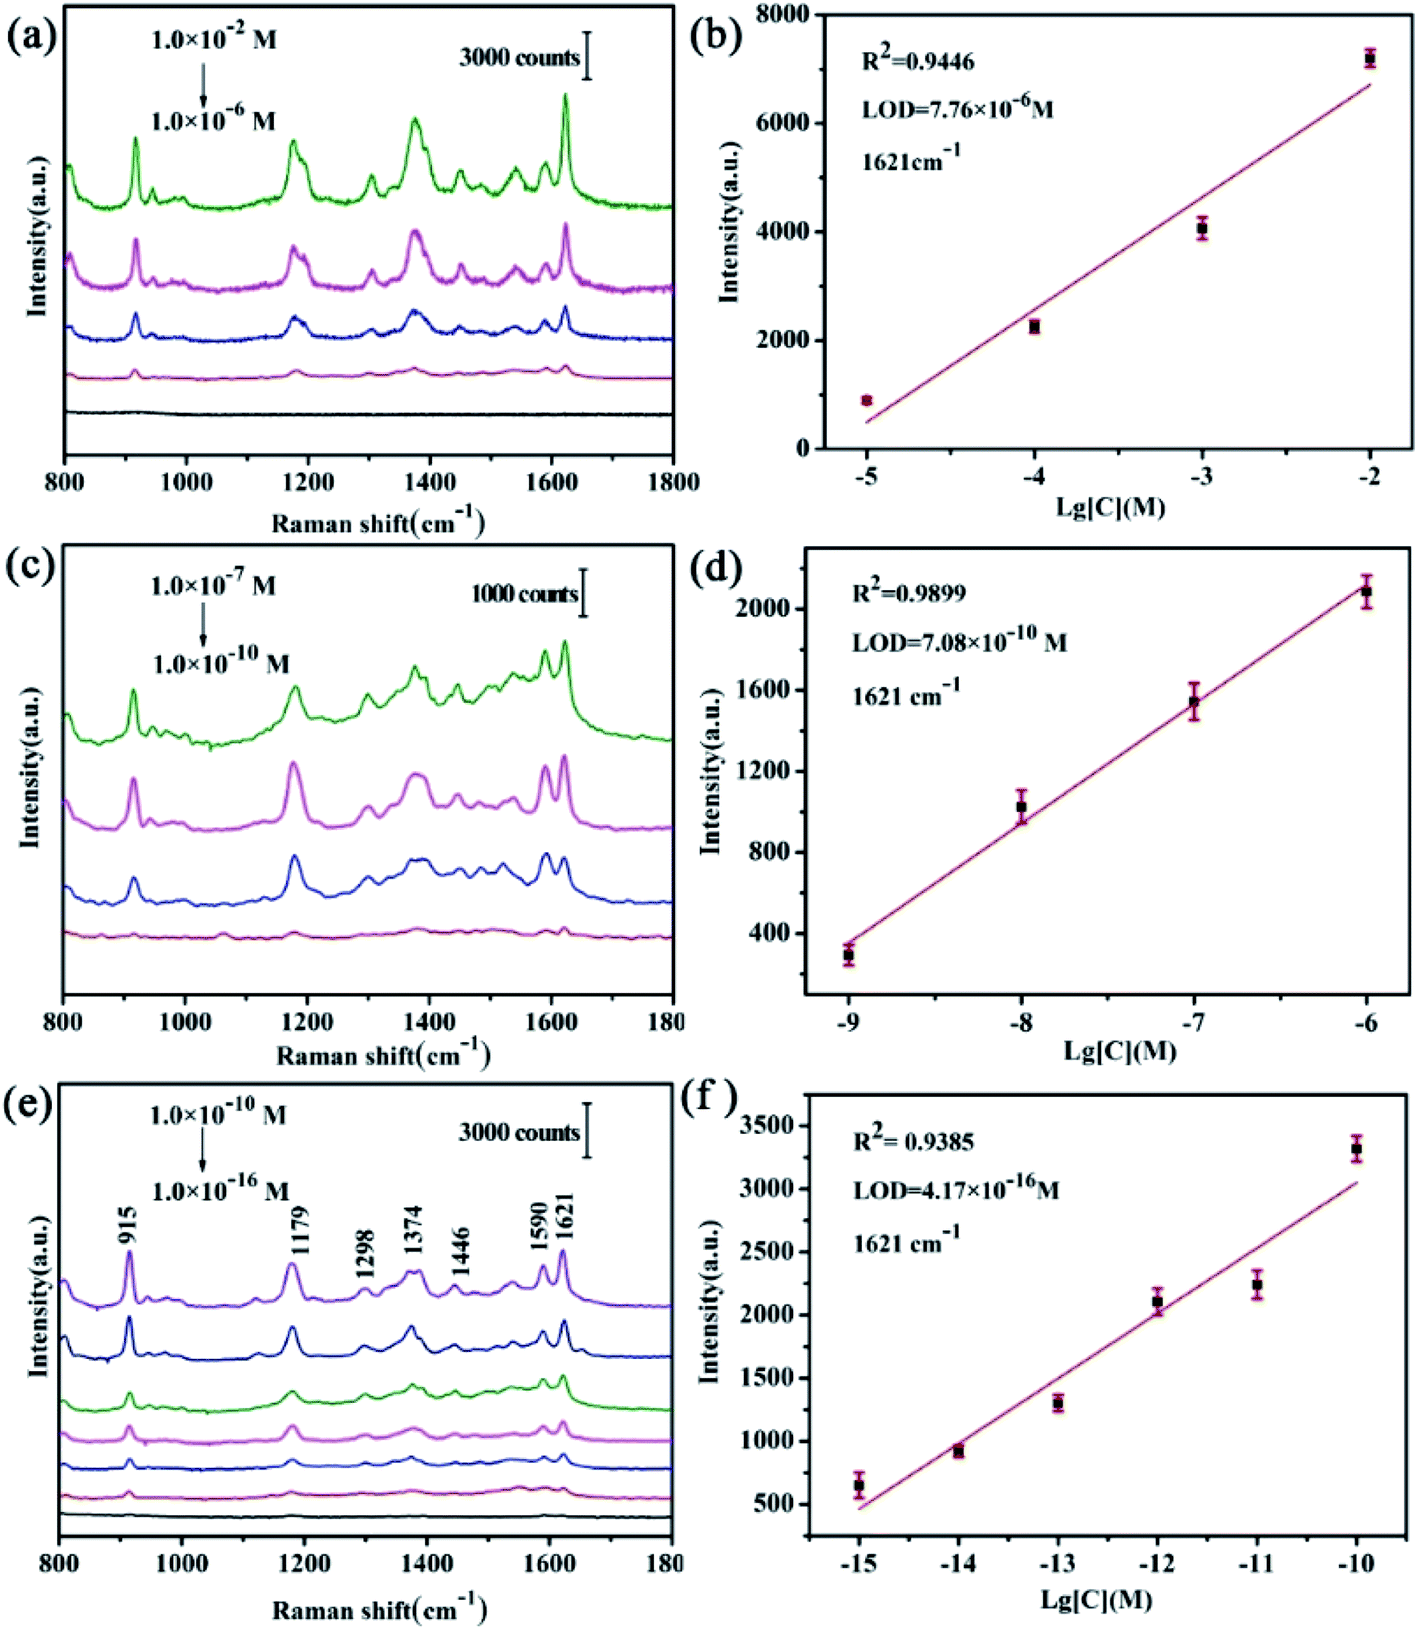 | ||
| Fig. 5 Raman spectra of CV with various concentrations on TiO2 FLNMs, Ag NPs, TiO2/Ag FLNMs, respectively, (a) TiO2 FLNMs; (b) the linear fit of the peak at 1621 cm−1 versus CV concentrations with TiO2 FLNMs; (c) Ag NPs; (d) the linear fit of the peak at 1621 cm−1 versus CV concentrations with Ag NPs; (e) TiO2/Ag FLNMs; (f) the linear fit of the peak at 1621 cm−1 versus CV concentrations with TiO2/Ag FLNMs. | ||
The representative peaks of CV molecules with different concentrations are displayed in Fig. 5(e). The peak at 915 cm−1 is assigned to ring skeletal vibrational mode.32 The peak at 1179 cm−1 rooted from C–H plane bending mode33 and the band at 1374 cm−1 is attributed to C–N stretching mode.34 The other peaks at 1590, 1621 cm−1 are the C–C stretching modes35 and the band at 1120 cm−1 originates from the C–H out of plane bending vibration.36 All peaks are consistent with the characteristic peaks of CV.
The enhancement factor (EF) is another critical parameter for SERS. In order to assess EF of TiO2/Ag FLNMs, the peak at 1621 cm−1 for CV is used to evaluate EF according to the equation defined as:24,37–39
| EF = ISERSCRS/IRSCSERS | (4) |
Now we return to assess reproducibility on the TiO2/Ag FLNMs. Three-dimensional (3D) SERS signals of CV at 1.0 × 10⁻¹³ M are acquired from 30 random spots in Fig. 6(a). It shows that excellent reproducibility achieved. The relative standard deviations (RSDs) of the characteristic peaks at 915, 1179, and 1621 cm−1 are 12.93%, 11.36%, and 4.71%, respectively in Fig. 6(b, c and d). All RSDs are less than 13%, implying that TiO2/Ag FLNMs substrates get high reproducibility. The reasons for high reproducibility of TiO2/Ag FLNMs substrate can explained as follows: firstly, TiO2/Ag FLNMs are uniform and the Ag NPs equally spread on the surface of FLNMs. On the other hand, CV molecules are adsorbed before test, making CV concentration uniform on the surface of TiO2/Ag FLNMs. TiO2/Ag FLNMs would be promising substrate for practical applications.
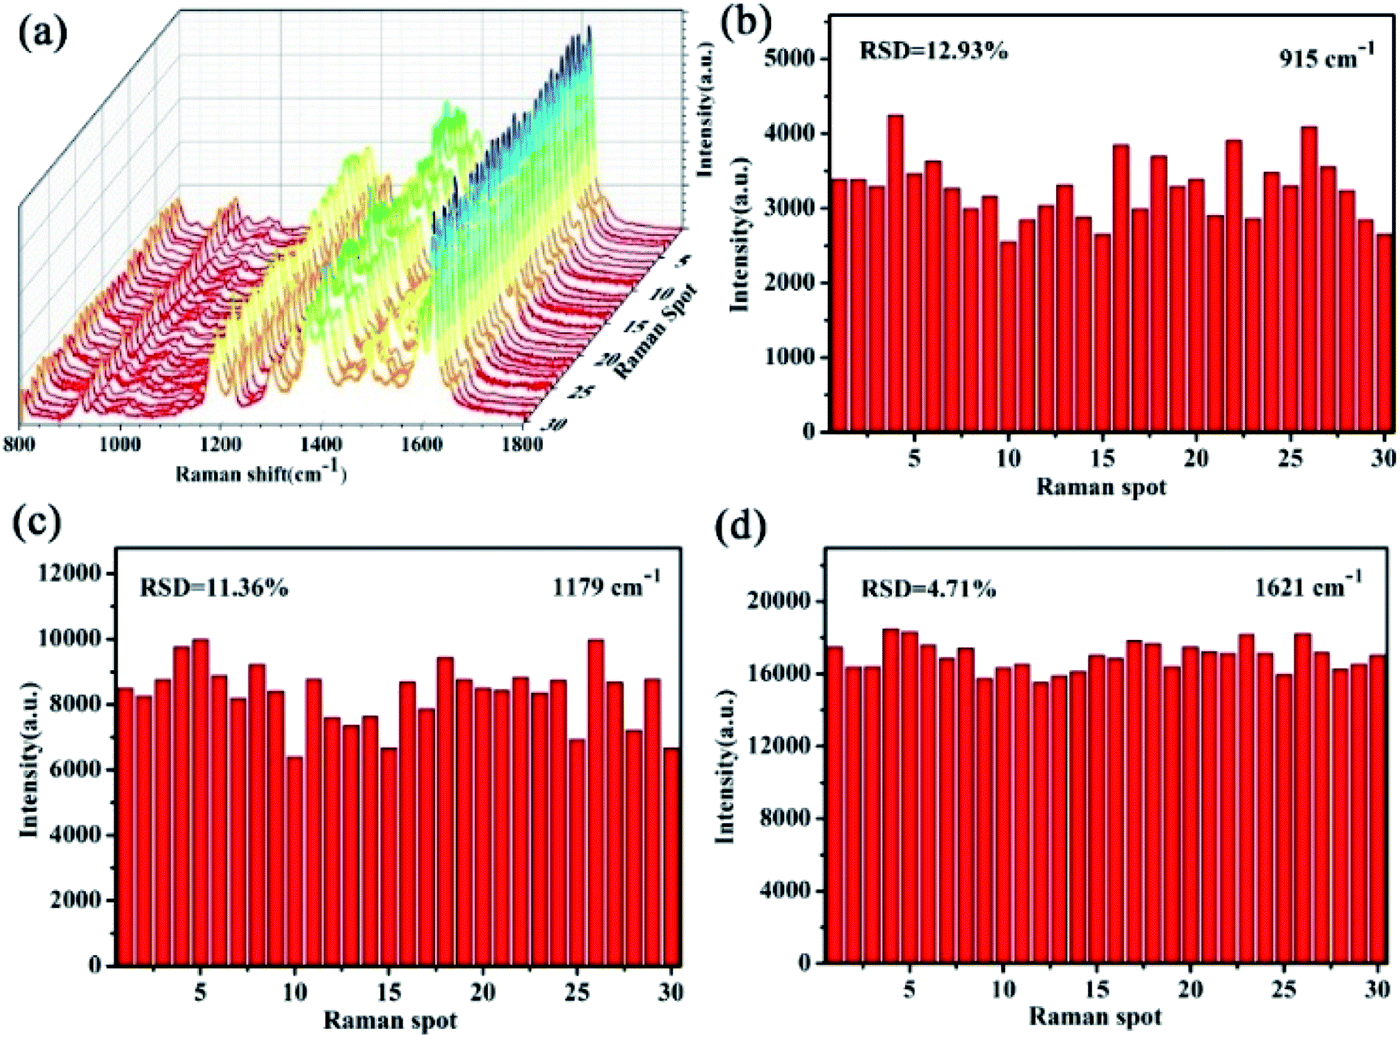 | ||
| Fig. 6 (a) 3D Raman spectra of 10−13 M CV molecules at 30 randomly spots on the TiO2/Ag FLNMs; (b–d) RSDs values of the selected peaks at 915, 1179, and 1621 cm−1, respectively. | ||
Fig. S2(a)† shows SERS signals of R6G with different concentrations on TiO2/Ag FLNMs substrates. The intensity of the peak at 1650 cm−1 versus logarithmic concentration of R6G for TiO2/Ag FLNMs substrates is illustrated in Fig. S2(b).† The LODs is 5.01 × 10⁻¹⁶ M. 3D SERS signals of R6G at 1.0 × 10⁻¹³ M are acquired from 30 random spots in Fig. S3(a).† It shows that excellent reproducibility achieved. The RSDs of the characteristic peaks at 1188, 1364, and 1650 cm−1 are 13.52%, 13.50%, and 3.64%, respectively in Fig. S3(b, c and d).†
Fig. S4(a)† shows SERS signals of RhB with different concentrations on TiO2/Ag FLNMs substrates. The intensity of the peak at 1650 cm−1 versus logarithmic concentration of RhB for TiO2/Ag FLNMs substrates is illustrated in Fig. S4(b).† The LODs is 7.94 × 10⁻¹⁴ M. 3D SERS signals of RhB at 1.0 × 10⁻¹¹ M are acquired from 30 random spots in Fig. S5(a).† It shows that excellent reproducibility achieved.
The RSDs of the characteristic peaks at 1362, 1510, and 1650 cm−1 are 11.49%, 11.74%, and 4.16%, respectively in Fig. S5(b, c and d).†
![[thin space (1/6-em)]](https://www.rsc.org/images/entities/char_2009.gif) log[C] (R2 = 0.9479) within the range of from 1.0 × 10⁻⁴ to 1.0 × 10⁻⁹ M. LOD is assessed to be 7.41 × 10⁻¹⁰ M in Fig. 7(b). Up to now, it is the lowest detection limit.43–45 The limit of melamine in food is 2.5 ppm for non-infant formula products and 1 ppm for infant milk products46 in China. The strictest standard in the world should be 0.15 ppm in liquid infant formulas proposed by the Codex Alimentarius Commission in 2012.47 Therefore, LOD on the TiO2/Ag FLNMs is over 1000 times lower than the severest standard in the world. Compared with other substrates, their LODs are listed in Table 1. It demonstrates that the proposed TiO2/Ag FLNMs possess the lowest LOD. It can be extended to food safety monitoring.
log[C] (R2 = 0.9479) within the range of from 1.0 × 10⁻⁴ to 1.0 × 10⁻⁹ M. LOD is assessed to be 7.41 × 10⁻¹⁰ M in Fig. 7(b). Up to now, it is the lowest detection limit.43–45 The limit of melamine in food is 2.5 ppm for non-infant formula products and 1 ppm for infant milk products46 in China. The strictest standard in the world should be 0.15 ppm in liquid infant formulas proposed by the Codex Alimentarius Commission in 2012.47 Therefore, LOD on the TiO2/Ag FLNMs is over 1000 times lower than the severest standard in the world. Compared with other substrates, their LODs are listed in Table 1. It demonstrates that the proposed TiO2/Ag FLNMs possess the lowest LOD. It can be extended to food safety monitoring.
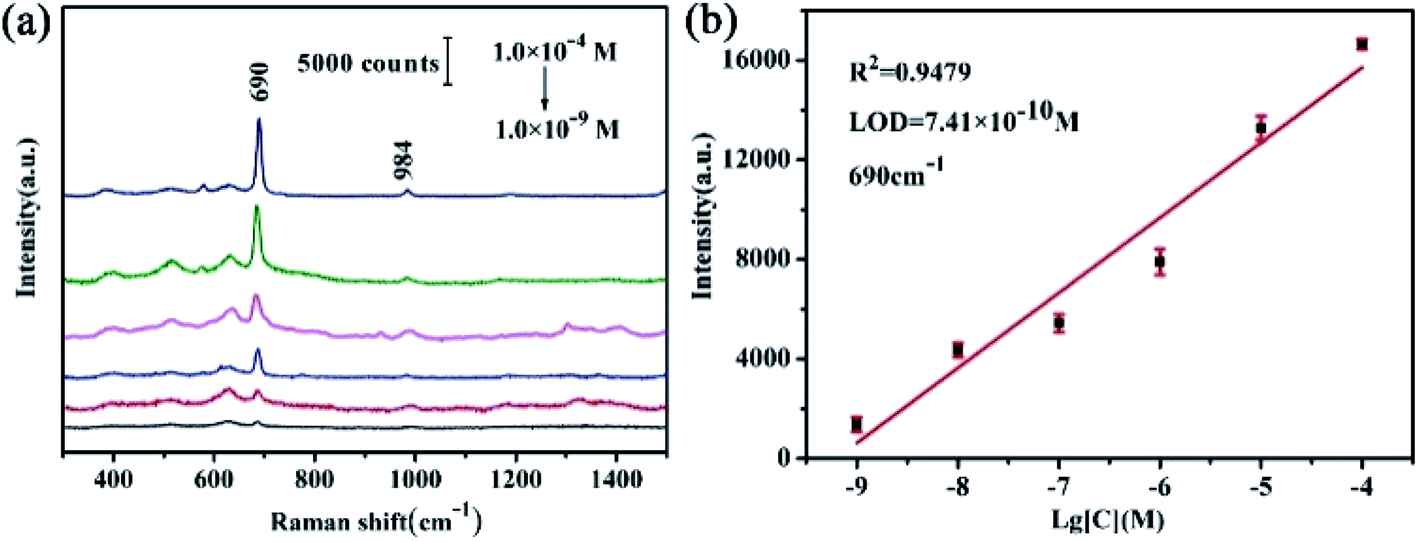 | ||
| Fig. 7 (a) SERS signals with different concentrations of the melamine on the TiO2/Ag FLNMs substrates; (b) the linear fit of the peak at 690 cm−1 versus melamine concentrations on the TiO2/Ag FLNMs. | ||
To examine the reproducibility of SERS signals on TiO2/Ag FLNMs, 3D SERS signals of melamine solution are acquired from 30 random spots with concentration of 1.0 × 10⁻⁷ M in Fig. 8(a). It reveals that prominent reproducibility is achieved, which is consistent with the SERS intensity at the characteristic peak.
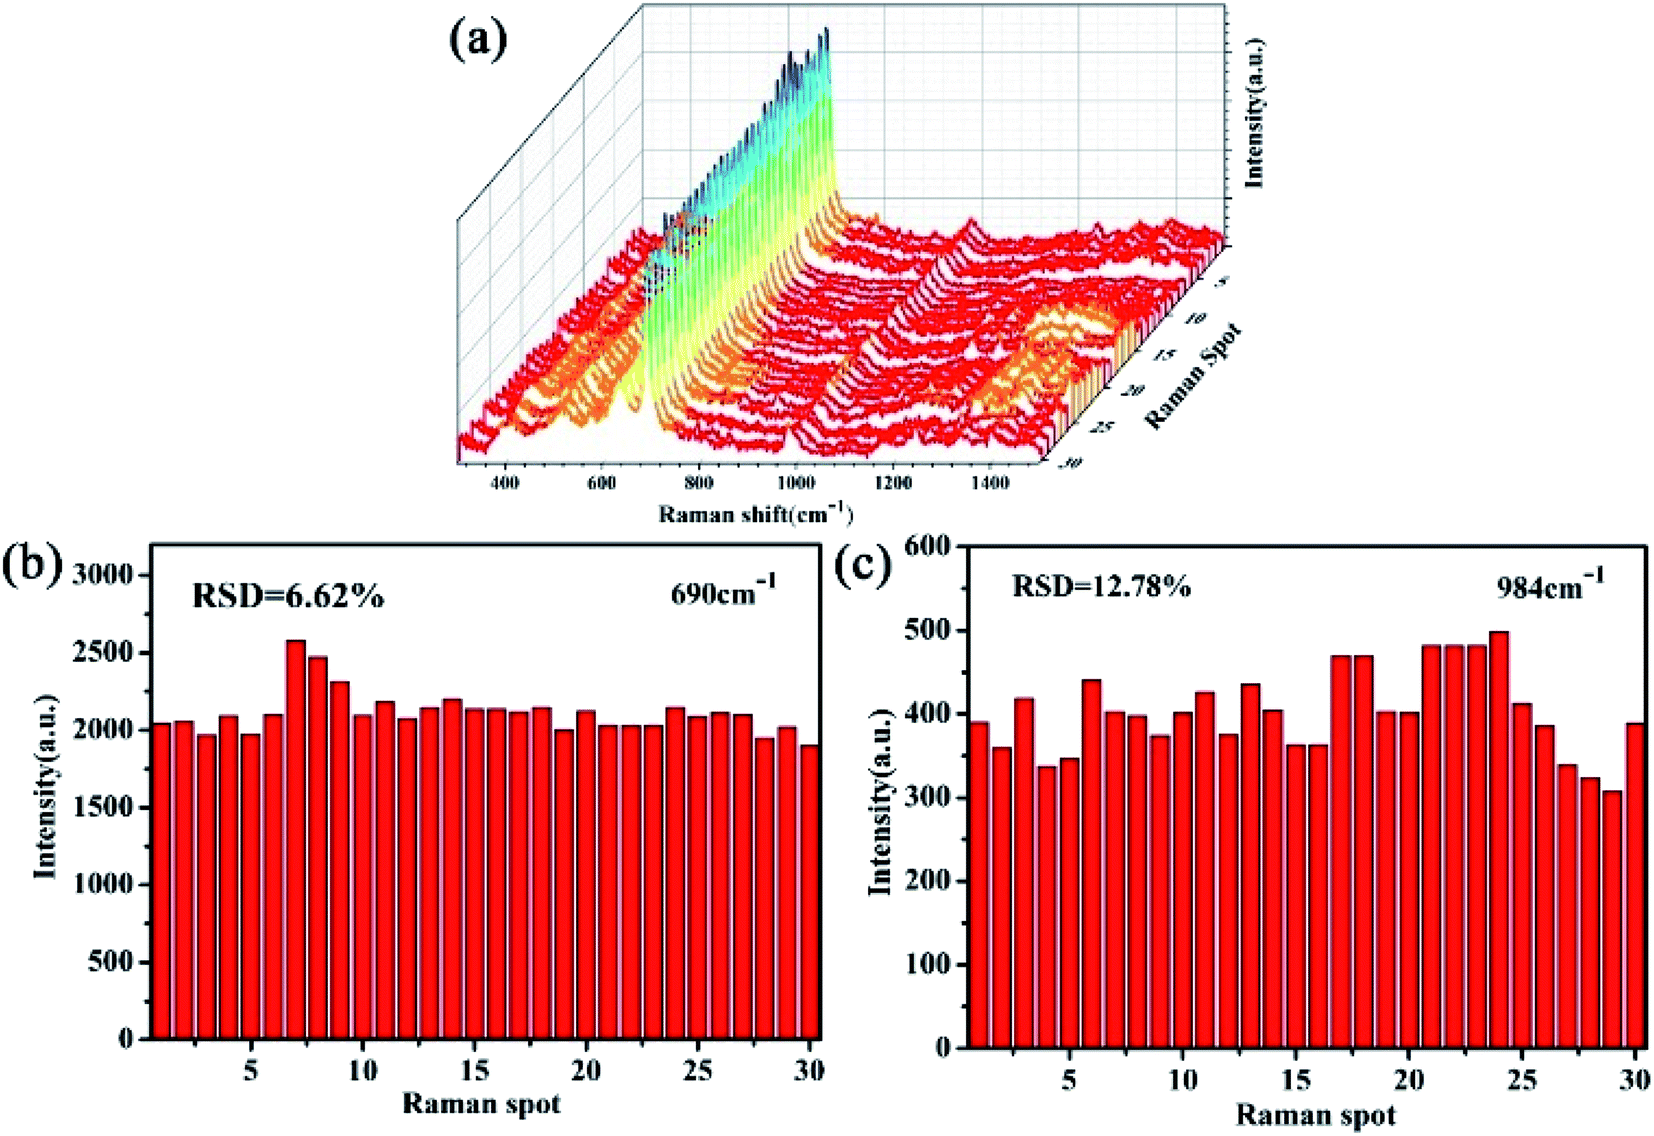 | ||
| Fig. 8 (a) 3D Raman spectra of 10−7 M melamine molecules at 30 random spots on the TiO2/Ag FLNMs; (b and c) RSDs of the selected peaks at 690 and 984 cm−1, respectively. | ||
The RSDs at peak 690 and 984 cm−1 are 6.62%, 12.78%, respectively (Fig. 8(b and c)). All the RSDs values are less than 12.78%, indicating TiO2/Ag FLNMs substrates have high reproducibility.
3.4 Mechanism
SERS mechanism is usually governed by electromagnetic enhancement mechanism (EM) and charge-transfer mechanism (CT).17,50 Compared with molecular adsorption, EM enhancement more depends on the structure of the substrate, being nonselective enhancement. Meanwhile, CT enhancement not only depends on the structure of the substrate but also on the molecular adsorption due to the electron transfer between substrate and molecule, improving the enhancement effect and exhibiting selective for the adsorbed molecules.51,52 The reasons for TiO2/Ag FLNMs' high SERS performance are as follows: firstly, as a principal factor, TiO2 FLNMs have high uniform morphology for attaining remarkable SERS enhancement. Secondly, the surface-deposited Ag NPs supply high SERS enhancement effect in visible light region. Thirdly, with immersing procedure, the probe molecule adsorbed on the substrates completely, which is more avail to TiO2-to-molecule charge transfer. The SERS enhancement of TiO2/Ag FLNMs is synergetic contribution of the EM effect of Ag NPs and the CT effect of TiO2-to-molecule, finite difference time domain (FDTD) simulations and the charge-transfer (CT) mechanism have been proved in our previous work.24 As a result, it is reasonable that TiO2/Ag FLNMs gain high SERS performance.4. Conclusions
In this work, TiO2/Ag FLNMs are synthesized by the hydrothermal reaction and electron beam evaporation. Pigments (CV, R6G, RhB) and melamine are employed for testing SERS performance and the corresponding LOD reach 4.17 × 10⁻¹⁶ M, 5.01 × 10⁻¹⁶ M, 7.94 × 10⁻¹⁴ M and 7.41 × 10⁻¹⁰ M, respectively. The LOD of melamine on the TiO2/Ag FLNMs is over 1000 times lower than the most severe standards in the world. The RSD are less than 12.93%, 13.52%, 11.74% and 12.78% for CV, R6G, RhB and melamine, respectively. The high sensitivity and reproducibility demonstrate that the TiO2/Ag FLNMs have a great potential application in food safety. It paves a new way for developing excellent performance SERS substrates.Author contributions
Yingkai Liu guided the experiments and revised the paper; Quanhong Ou supplied help for SERS measurement; Mingming Cheng, Weijun Li and Chenyan Li supplied help for data analysis; Weiye Yang performed the design, fabrication a testing of the device, analyzed the data and wrote the paper. All authors have read and agreed to the published version of the manuscript.Conflicts of interest
There are no conflicts to declare.Acknowledgements
This work was supported by the National Natural Science Foundation of China (Grant No. 11764046 and 11764047); Zunyi science and technology bureau (ZSKHHZZ-2019-5).References
- J. N. Anker, W. P. Hall, O. Lyandres, N. C. Shah, J. Zhao and R. P. Van Duyne, Nat. Mater., 2008, 7, 442–453 CrossRef CAS PubMed.
- J. Zheng, A. L. Jiao, R. H. Yang, H. M. Li, J. S. Li, M. L. Shi, C. Ma, Y. Jiang, L. Deng and W. H. Tan, J. Am. Chem. Soc., 2012, 134, 19957–19960 CrossRef CAS PubMed.
- C. X. Zhang, L. Su, Y. F. Chan, Z. L. Wu, Y. M. Zhao, H. J. Xu and X. M. Sun, Nanotechnology, 2013, 24, 335501 CrossRef PubMed.
- B. H. Zhang, H. S. Wang, L. H. Lu, K. L. Ai, G. Zhang and X. L. Cheng, Adv. Funct. Mater., 2008, 18, 2348–2355 CrossRef CAS.
- W. E. Smith, Chem. Soc. Rev., 2008, 37, 955–964 RSC.
- I. Yoon, T. Kang, W. Choi, J. Kim, Y. Yoo, S. W. Joo, Q. H. Park, H. Ihee and B. Kim, J. Am. Chem. Soc., 2009, 131, 758–762 CrossRef CAS PubMed.
- A. Musumeci, D. Gosztola, T. Schiller, N. M. Dimitrijevic, V. Mujica, D. Martin and T. Rajh, J. Am. Chem. Soc., 2009, 131, 6040–6041 CrossRef CAS PubMed.
- C. W. Cheng, B. Yan, S. M. Wong, X. L. Li, W. W. Zhou, T. Yu, Z. X. Shen, H. Y. Yu and H. J. Fan, ACS Appl. Mater. Interfaces, 2010, 2, 1824–1828 CrossRef CAS PubMed.
- C. Y. Li, C. X. Yang, W. J. Li, M. M. Cheng and Y. K. Liu, Nano, 2020, 15, 2050122 CrossRef CAS.
- C. X. Yang, C. Qing, Q. J. Wang, X. J. Zhang, J. Lou and Y. K. Liu, Sens. Actuators, B, 2020, 304, 127218 CrossRef CAS.
- N. D. Jayram, S. Sonia, P. S. Kumar, L. Marimuthu, Y. Masuda, D. Mangalaraj, N. Ponpandian, C. Viswanathan and S. Ramakrishna, RSC Adv., 2015, 57, 46229–46239 RSC.
- N. D. Jayram, D. Aishwarya, S. Sonia, D. Mangalaraj, P. S. Kumar and G. M. Rao, J. Colloid Interface Sci., 2016, 477, 209–219 CrossRef CAS PubMed.
- R. Purbia, P. D. Nayak and S. Paria, Nanoscale, 2018, 27, 12970–12974 RSC.
- M. Ramuthai, S. Habibuddin, S. Sonia, N. D. Jayram, K. D. A. Kumar, M. Shkir, H. Algarni and S. Alfaify, J. Mater. Sci.: Mater. Electron., 2021, 22, 26596–26607 CrossRef.
- S. F. Zhang, X. D. Yang, Y. H. Numata and L. Y. Han, Energy Environ. Sci., 2013, 6, 1443–1464 RSC.
- A. I. López-Lorente, R. A. Picca, J. Izquierdo, C. Kranz, B. Mizaikoff, C. Di Franco, S. Cárdenas, N. Cioffi, G. Palazzo and A. Valentini, Microchim. Acta, 2018, 185, 1–9 CrossRef PubMed.
- H. Fang, C. X. Zhang, L. Liu, Y. M. Zhao and H. J. Xu, Biosens. Bioelectron., 2015, 64, 434–441 CrossRef CAS PubMed.
- Y. Tian, H. Zhang, L. L. Xu, M. Chen and F. Chen, Opt. Lett., 2018, 43, 635–638 CrossRef CAS PubMed.
- J. M. Zhang, S. C. Qu, L. S. Zhang, A. W. Tang and Z. G. Wang, Spectrochim. Acta, Part A, 2011, 79, 625–630 CrossRef CAS PubMed.
- G. Venkatasami and J. R. John Jr, Anal. Chim. Acta, 2010, 665, 227–230 CrossRef CAS PubMed.
- M. S. Filigenzi, B. Puschner, L. S. Aston and R. H. Poppenga, J. Agric. Food Chem., 2008, 56, 7593–7599 CrossRef CAS PubMed.
- B. Puschner, R. H. Poppenga, L. J. Lowenstine, M. S. Filigenzi and P. A. Pesavento, J. Vet. Diagn. Invest., 2007, 19, 616–624 CrossRef PubMed.
- M. Liu, L. Y. Piao, W. M. Lu, S. T. Ju, L. Zhao, C. L. Zhou, H. L. Li and W. J. Wang, Nanoscale, 2010, 2, 1115–1117 RSC.
- W. Y. Yang, J. Q. Tang, Q. H. Ou, X. Q. Yan, L. Liu and Y. K. Liu, ACS Omega, 2021, 6(41), 27271–27278 CrossRef CAS PubMed.
- E. Avci and M. Culha, RSC Adv., 2013, 3, 17829–17836 RSC.
- X. Lin, W. L. J. Hasi, X. T. Lou, S. Lin, F. Yang, B. S. Jia, D. Y. Lin and Z. W. Lu, RSC Adv., 2014, 4, 51315–51320 RSC.
- J. H. Pan, X. Zhang, A. J. Du, D. D. Sun and J. O. Leckie, J. Am. Chem. Soc., 2008, 130, 11256–11257 CrossRef CAS PubMed.
- C. Y. Jimmy, J. Y. Yu, W. K. Ho, Z. T. Jiang and L. Z. Zhang, Chem. Mater., 2002, 14, 3808–3816 CrossRef.
- X. Y. Li, G. X. Zhu, L. S. Xiao, Y. J. Liu, Z. Y. Ji, X. P. Shen, L. R. Kong and S. A. Shah, J. Alloys Compd., 2019, 773, 40–49 CrossRef CAS.
- W. Ahmed, O. Demirtas, I. M. Ozturk and A. Bek, ACS Appl. Nano Mater., 2020, 3, 6766–6773 CrossRef CAS.
- D. Vernardou, M. Apostolopoulou, D. Louloudakis, N. Katsarakis and E. Koudoumas, J. Colloid Interface Sci., 2014, 424, 1–6 CrossRef CAS PubMed.
- Y. Yokota, K. Ueno and H. Misawa, Small, 2011, 7, 252–258 CrossRef CAS PubMed.
- B. W. Yang, Z. M. Liu, Z. Y. Guo, W. Zhang, M. M. Wan, X. C. Qin and H. Q. Zhong, Appl. Surf. Sci., 2014, 316, 22–27 CrossRef CAS.
- J. J. Yu, M. Z. Shen, S. Y. Liu, F. Li, D. P. Sun and T. H. Wang, Appl. Surf. Sci., 2017, 406, 285–293 CrossRef CAS.
- Y. Z. Zhou, J. P. Huang, W. D. Shi, Y. Li, Y. Y. Wu, Q. Q. Liu, J. Zhu, N. Zhao, L. L. Zhang, J. Yang and X. N. Cheng, Appl. Surf. Sci., 2018, 457, 1000–1008 CrossRef CAS.
- J. Q. Tang, C. Y. Zeng, Y. Q. Wang, Z. W. Lin and S. Q. Man, Plasmonics, 2015, 10, 563–568 CrossRef CAS.
- D. Shao, S. Bi, R. Zhao, X. Y. Sun, X. Li and J. F. Yu, Sens. Actuators, B, 2020, 307, 127644 CrossRef.
- K. K. Xu, J. Opt., 2018, 20, 024014 CrossRef.
- J. M. Zhang, S. C. Qu, L. S. Zhang, A. W. Tang and Z. G. Wang, Spectrochim. Acta, Part A, 2011, 79, 625–630 CrossRef CAS PubMed.
- Z. Kartal and A. Yavuz, J. Mol. Struct., 2018, 1155, 171–183 CrossRef CAS.
- D. Li, D. Y. Lv, Q. X. Zhu, H. Li, H. Chen, M. M. Wu, Y. F. Chai and F. Lu, Food Chem., 2017, 224, 382–389 CrossRef CAS PubMed.
- N. E. Mircescu, M. Oltean, C. Vasile and N. Leopold, Vib. Spectrosc., 2012, 62, 165–171 CrossRef CAS.
- B. Nie, Y. Luo, J. Shi, L. Gao and G. T. Duan, Sens. Actuators, B, 2019, 301, 127087 CrossRef CAS.
- J. M. Li, Y. Yang and D. Qin, J. Mater. Chem. C, 2014, 2, 9934–9940 RSC.
- R. Wang, Y. Xu, R. J. Wang, C. Y. Wang, H. Z. Zhao, X. Q. Zheng, X. Liao and L. Cheng, Microchim. Acta, 2017, 184, 279–287 CrossRef CAS.
- C. M. Gu, T. Lan, H. C. Shi and Y. Lu, Anal. Chem., 2015, 87, 7676–7682 CrossRef CAS PubMed.
- H. Y. Zou, K. L. Xu, Y. Y. Feng and B. Liang, Food Anal. Methods, 2015, 8, 740–748 CrossRef.
- Y. Sun, X. D. Zhai, Y. W. Xu, C. Liu, X. B. Zou, Z. H. Li, J. Y. Shi and X. W. Huang, Food Control, 2021, 122, 107772 CrossRef CAS.
- D. Sun, F. H. Cao, H. M. Wang, S. L. Guan, A. L. Su, W. Q. Xu and S. P. Xu, Sens. Actuators, B, 2021, 327, 128943 CrossRef CAS.
- A. Otto, J. Raman Spectrosc., 2005, 36, 497–509 CrossRef CAS.
- X. Jiang, Y. L. Chen, J. Du, X. L. Li, Y. Shen, M. Yang, X. X. Han, L. B. Yang and B. Zhao, J. Raman Spectrosc., 2018, 49, 1257–1264 CrossRef CAS.
- Y. Zhou, J. Chen, L. Zhang and L. B. Yang, Eur. J. Inorg. Chem., 2012, 19, 3176–3182 CrossRef.
Footnote |
| † Electronic supplementary information (ESI) available. See DOI: 10.1039/d1ra08128d |
| This journal is © The Royal Society of Chemistry 2022 |