
 Open Access Article
 This Open Access Article is licensed under a Creative Commons Attribution-Non Commercial 3.0 Unported Licence
Metal–organic framework bearing new viologen ligand for ammonia and Cr2O72− sensing†
Baili Zhu,
Yunpeng Jin,
Jingying Chu,
Minghui Zuo and
Shuxin Cui *
*
Heilongjiang Key Laboratory of Photoelectric Functional Materials, College of Chemistry and Chemical Engineering, Mudanjiang Normal University, Mudanjiang 157011, People's Republic of China. E-mail: cuisx981@163.com
First published on 1st March 2022
Abstract
Three anionic metal–organic frameworks (MOFs) {[Zn3(BTEC)2(H2O)(4-BCBPY)]·(H2O)}n (1–3) (BTEC4− = 1,2,4,5-benzenetetracarboxylic acid anion, 4-BCBPY2+ = 1,1′-bis(4-cyanobenzyl)-4,4′-bipyridinium dication) were synthesized in the reaction of 1,2,4,5-benzenetetracarboxylic acid with different metal salts such as ZnNO3, ZnCl2, and ZnSO4, under solvothermal conditions in the presence of 1,1′-bis(4-cyanobenzyl)-4,4′-bipyridinium chloride. Single crystal X-ray diffraction analysis shows that compounds 1, 2 and 3 have MOF structures based on binuclear metal building units, which are connected by two protonated BTEC4− ligands and three zinc ions, and the viologen cation 4-BCBPY2+ is located in the channel to achieve charge balance. Compounds 1, 2 and 3 have good photosensitivity, respond to sunlight, UV light and blue ray, and turn blue. The D–A distance and π–π stacking distance of the discolored samples (1P, 2P and 3P) changed. In addition, the three compounds showed visible color changes to ammonia vapor, rapidly changing from white to blue. At the same time, the three compounds exhibited fluorescence quenching to ammonia vapor and Cr2O72−. It is further proved that compounds 1, 2 and 3 are fluorescent sensors with a low detection limit (for Cr2O72−: 10−5 M) and high sensitivity for ammonia vapor and Cr2O72−. It was found that photochromic behavior, ammonia sensing properties can be tuned by the nature of metal salts.
Introduction
Under the action of external stimuli (light, heat, electricity, chemistry, etc.), stimulus response materials that exhibit changes in properties such as discoloration or emission characteristics are the basis for many applications in catalysis, sensors, and biomedicine.1–6 Because of its wide application in molecular devices such as optical switches and sensors, it has aroused great interest. Among various materials, metal–organic frameworks (MOFs) composed of inorganic and organic have unlimited diversity and are very responsive materials. As an attractive platform for responsive material design, MOFs can be functionalized through metal-based joints, structures and pores. Or, by using the synergistic effect between these components, the hybrid crystal network can theoretically endow various response characteristics, and become an excellent material with a variety of stimulus response capabilities.1,7–13 Anionic MOFs with a negatively charged skeleton are a sub-category of MOFs and have unique applications in gas adsorption, sensors, fluorescent probes, and so on.14–164,4′-Bipyridine and its derivatives (viologen and its derivatives) are a typical electron-deficient substance with a strong tendency to carry out electron transfer (ET) and induce energy transfer (EnT). Therefore, it can be used as a multifunctional response structural unit to play a huge role in light/thermochromic materials, sensors and host–guest compounds.5,10,17–27 In various stimulus response systems, viologen-based MOFs are due to the ET coloring mechanism between the donor (D) and acceptor (A) units. It exhibits the advantages of better fatigue resistance, better stability and ease of preparation. At the same time, MOFs designed based on viologen have advantages in chemical sensing/switching and other fields, and their response characteristics can be adjusted by the organization of the D–A block.1,2,14,15,17,28–36
Ammonia (NH3) is an important industrial raw material with a wide range of uses, but it is also a highly toxic chemical. And even at low concentrations, there is a certain degree of toxicity.11,25,37,38 On the other hand, although Cr2O72− is widely used in industry, it has carcinogenic effects on the human body and is an environmental pollutant.11,33,39,40 Therefore, it is particularly important and urgent to design a sensor for detecting ammonia and Cr2O72−. Our interest lies in the use of different metal salts of the same metal to synthesize anionic MOFs and explore the differences in their properties.41 And several MOFs are applied to the field of ammonia and Cr2O72− discoloration or fluorescence detection.42,43 Compared with the traditional method, the color change detection method can directly observe the color change with the naked eye, and intuitively observe the response of MOFs to external stimuli. The fluorescence detection method has the advantages of simple operation, fast response speed, and easy detection. Both methods are very effective detection methods. In this paper, 1,1′-bis(4-cyanobenzyl)-4,4′-bipyridinium chloride (4-BCBPY·2Cl) is used as a positively charged cation ligand, which has the good electron-accepting ability. And using 1,2,4,5-benzenetetracarboxylic acid (H4BTEC) with excellent coordination ability and Zn(NO3)2·6H2O, ZnCl2 and ZnSO4·7H2O in the presence of 1,1′-bis(4-cyanobenzyl)-4,4′-bipyridinium chloride to synthesize three new multi-response anionic MOFs {[Zn3(BTEC)2(H2O)(4-BCBPY)]·H2O}n (1–3). Compounds 1, 2 and 3 have good photosensitivity, respond to sunlight, UV light and blue ray, and turn blue. The D–A distance and π–π stacking distance of the discolored samples (1P, 2P and 3P) changed. At the same time, the three compounds all show a response to ammonia vapor, and the transition from white to blue can be observed with the naked eye. It is worth noting that compounds 1, 2 and 3 have proved to be excellent fluorescence sensors for Cr2O72− and ammonia vapor. They can detect Cr2O72− at lower concentrations (10−5 M). It was also found that metal salts can affect photochromic behavior, ammonia sensing properties.
Experimental
Materials and methods
The preparation of 4-BCBPY·2Cl is as described in Scheme S1.† The 1H NMR spectrum and 13C NMR spectrum were shown in Fig. S1 and S2.† Other reagent grade chemicals are obtained from commercial sources and can be used without further purification. Elemental analysis adopts Vario El III CHNOS elemental analyzer. Infrared spectra were recorded with PerkinElmer Frontier™ spectrometer on 4000–400 cm−1 KBr beads. The UV-vis diffuse reflectance spectrum of the solid powder was measured at room temperature with Shimadzu UV-2600 UV-vis Spectrophotometer. On the Rigaku Ultima IV-185 diffractometer, a powder X-ray diffraction (PXRD) pattern with a 2θ range of 10°–50° was collected by Cu-Kα radiation (λ = 1.54056 Å). The PXRD pattern was simulated by X-ray single crystal diffraction data with Mercury Version 1.4.2 software. The electron spin resonance (ESR) spectrum was recorded on the JEOL JES FA200 electron spin resonance paramagnetic spectrometer. On the Tarsus TG 209 F3 Thermogravimetric Analyzer, thermogravimetric analysis was performed from room temperature to 550 °C at a heating rate of 10 °C min−1. Hitachi F-7000 Fluorescence Spectrophotometer was used to record the fluorescence spectrum.Synthesis of 1
Zn(NO3)2·6H2O (0.015 g, 0.05 mmol), H4BTEC (0.010 g, 0.04 mmol) and 4-BCBPY·2Cl (0.014 g, 0.03 mmol) were added to the mixed solution of acetonitrile and water (8 mL, v![[thin space (1/6-em)]](https://www.rsc.org/images/entities/char_2009.gif) :v = 4:4). The mixture was stirred in a 25 mL Teflon reactor for five minutes and heated to 120 °C for 72 hours. After cooling to room temperature at a rate of 5 °C h−1, colorless block crystals were collected by filtration, and the yield was 68% (based on 4-BCBPY·2Cl). Anal. calcd for C46H28N4O18Zn3: C, 49.25; H, 2.50; N, 5.00%. Found: C, 50.32; H, 2.64; N, 5.62%.
:v = 4:4). The mixture was stirred in a 25 mL Teflon reactor for five minutes and heated to 120 °C for 72 hours. After cooling to room temperature at a rate of 5 °C h−1, colorless block crystals were collected by filtration, and the yield was 68% (based on 4-BCBPY·2Cl). Anal. calcd for C46H28N4O18Zn3: C, 49.25; H, 2.50; N, 5.00%. Found: C, 50.32; H, 2.64; N, 5.62%.
Synthesis of 2
The synthesis process is similar to compound 1 except that ZnCl2 (0.007 g, 0.05 mmol) is used instead of Zn(NO3)2·6H2O (0.015 g, 0.05 mmol). Collect colorless block crystals by filtration. The yield was 76% (based on 4-BCBPY·2Cl). Anal. calcd for C46H28N4O18Zn3: C, 49.25; H, 2.50; N, 5.00%. Found: C, 50.36; H, 2.85; N, 5.46%.Synthesis of 3
The synthesis process is similar to compound 1 except that ZnSO4·7H2O (0.014 g, 0.05 mmol) is used instead of Zn(NO3)2·6H2O (0.015 g, 0.05 mmol). Collect colorless block crystals by filtration. The yield was 72% (based on 4-BCBPY·2Cl). Anal. calcd for C46H28N4O18Zn3: C, 49.25; H, 2.50; N, 5.00%. Found: C, 50.57; H, 2.96; N, 5.34%.X-ray crystallography
Data were collected for compounds 1–3 on a Bruker SMART APEX II single crystal X-ray diffractometer equipped with graphite monochromatic Mo-Kα radiation (λ = 0.71073 Å). Solve the structure by the direct method. Using SHELXTL-2014 and Olex2 programs, the structure is optimized on F2 through the full matrix least square method.44,45 All non-hydrogen atoms are anisotropically refined. The hydrogen atoms of the organic ligands are in theoretical positions and are refined isotropically. At the same time, an OMIT operation was performed on the bad reflections. Table S1 lists the crystallographic data of compounds 1, 2 and 3.† Tables S2–S4 list the selected bond lengths and bond angles for compounds 1, 2 and 3.† Table S5 lists the 1, 2, and 3 hydrogen bond interactions. The crystallographic data is stored in the Cambridge Crystal Data Center (CCDC), supplementary publication numbers CCDC 2087817 (1), 2090938 (2), 2124977 (3), 2098345 (1P), 2114330 (2P) and 2114328 (3P).†Results and discussion
Crystal structural description
Compounds 1, 2 and 3 are isomorphic, so 1 was discussed in detail. Single crystal X-ray diffraction analysis shows that compound 1 crystallized in monoclinic crystal system, P2/c space group. As shown in Fig. S3,† compound 1 has an anion skeleton [Zn3(BTEC)2]2−, two half 4-BCBPY2+ cations and a free water molecule exist in the channel, which constitute the main body of the crystal and realize the charge balance. Zn1 coordinates with four oxygen atoms (O2, O4, O116, O152) and one water molecule (O3) to form a twisted triangular bipyramid configuration (Fig. 1a). Zn2 is coordinated with four oxygen atoms (O5, O6, O91, O162) in a twisted tetrahedral configuration. Zn3 is coordinated by four oxygen atoms (O23, O101, O13, O14) in a twisted tetrahedral configuration. Each BTEC4− ligand is connected to five Zn atoms, and three O atoms are not coordinated to Zn. At the same time, the carboxylic acid arm from the BTEC4− ligand connects the adjacent Zn16 and Zn35 ions to form a binuclear zinc building unit (Fig. 1a). The Zn–O bond ranges from 1.908(5) Å to 2.142(5) Å, which are all normal. Each Zn metal center is connected to the O atom of the carboxylic group to form a 1D chain along the b-axis (Fig. 1b). The chain is further linked with BTEC4− to produce a 3D framework. As shown in Fig. 1c, the connection between the BTEC4− bridging ligand and the Zn metal center creates a 3D framework with a square cavity (estimated size (Fig. 1d): 10.904 Å × 10.924 Å and 10.829 Å × 10.809 Å). The channel sizes formed by the three compounds are not the same (Fig. S6†). The estimated sizes of compound 2 are 10.814 Å × 10.833 Å and 10.913 Å × 10.932 Å. The estimated sizes of compound 3 are 10.932 Å × 10.913 Å and 10.835 Å × 10.816 Å. The two inserted 4-BCBPY2+ cations are in two different chair configurations and pass through the four cavities (Fig. 1c). One is similar to a normal chair configuration, and the other is a twisted chair configuration. All pyridine ring atoms are on the same plane, parallel to the ring of the BTEC4− ligand in the host framework. Lattice water molecules are contained in the crystal lattice and form hydrogen bonds (Fig. S7†) with BTEC4− and viologen groups, which contribute to the stability of the resulting 3D structure. | ||
| Fig. 1 (a) The coordination environment around BTEC4− in compound 1. The inset on the right shows the binuclear Zn building unit in compound 1 (symmetry codes: 1 + x, 1 + y, +z; 2 + x, 1 − y, −1/2 + z; 3 + x, 1 − y, 1/2 + z; 4 + x, −y, −1/2 + z; 5 + x, −1 + y, +z; 6 + x, −y, 1/2 + z); (b) 1D Zn(II)-carboxylate chain along the b axis in compound 1; (c) 3D packing structure of compound 1. The illustration on the right is a schematic diagram of the two chair configurations of 4-BCBPY2+; (d) estimated channel size for compound 1. | ||
PXRD and TGA
The purity of compounds 1, 2 and 3 was tested by powder X-ray diffraction analysis. It can be seen from Fig. S8† that the experimental data and simulation data of compounds 1, 2 and 3 have almost the same diffraction patterns. It shows that compounds 1, 2 and 3 have similar phase purity. In addition, the thermal stability of compounds 1, 2 and 3 were also tested. As shown in Fig. S9,† compounds 1, 2 and 3 gradually lost their solvent molecules at 28–402 °C. After 402 °C, the skeleton began to collapse.Photochromism
Generally, materials containing viologen will change color under light conditions. Therefore, the photochromic behavior of compounds 1, 2 and 3 were studied. As expected, all three compounds exhibit photochromism in the air. Under the sunlight, 365 nm UV light, and blue ray, the three compounds changed from the original white to blue with different shades (Fig. 2a–c). Under 365 nm UV light irradiation, compounds 1, 2 and 3 changed colors within 3 s, 5 s and 6 s, respectively. The order of color change rate is 1 > 2 > 3. After irradiation, the UV-vis absorption spectrum gradually showed new bands near 404 nm, 615 nm and 740 nm, which are the typical absorption peaks of viologen radicals (Fig. 2d–f). The samples irradiated by the three compounds remained blue for at least 45 days under dark conditions. In addition, the reversible color can be generated when heated to 140 °C. The color development and fading process can be repeated at least five times, indicating that the three compounds have reversible photochromic properties. | ||
| Fig. 2 Photographs of compounds 1–3 before and after illumination (a–c), and UV-vis spectra (d–f). | ||
The PXRD and FT-IR spectra of compounds 1, 2 and 3 showed that there was no obvious structural change during the photochromic process, indicating that the structures of the three compounds remained unchanged before and after irradiation (Fig. S8 and S10†). To further study the color change mechanism of compounds 1, 2 and 3 in response to light, ESR spectrum analysis was carried out. As shown in Fig. 3, the irradiated samples of the three compounds showed strong single radical signals at g = 2.0160, 2.0156 and 2.0181, which are similar to the g value of free electrons. It should be noted that because light cannot be completely avoided during the operation, the weak g values of compounds 1, 2 and 3 already existed before the irradiation. This indicates that compounds 1, 2 and 3 are very sensitive to light.16,19,47–49 These results indicate that the photochromic behavior of compounds 1, 2 and 3 originated from the electron transfer process, forming viologen radicals, rather than photoisomerization or photolysis.
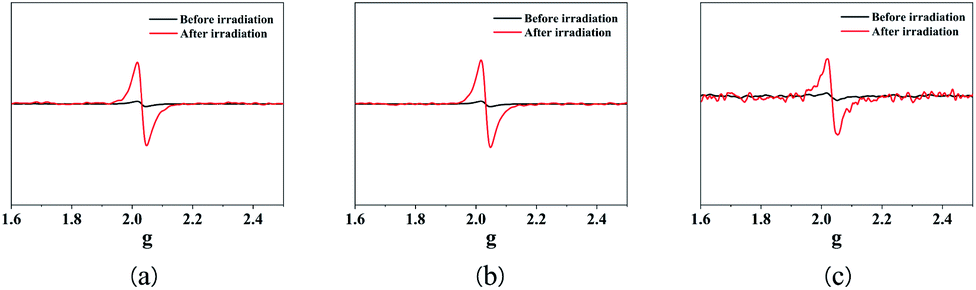 | ||
| Fig. 3 ESR spectra of compounds 1 (a), 2 (b) and 3 (c). | ||
In addition, the structures of compounds 1, 2 and 3 were analyzed to explore the reasons for the different discoloration times of the three compounds. As we all know, the key reason for the light-induced reduction and free radical stability of viologen derivatives is the short distance and plane orientation between the electron donor and the electron acceptor. The distances from the oxygen atom of the carboxylic acid group to the nitrogen atom of the pyridine ring in the three compounds are 2.905 Å [O(17)⋯N(3)], 2.900 Å [O(1)⋯N(2)] and 2.911 Å [O(2)⋯N(2)], which provide a suitable way for electron transfer (Fig. 4). The order of D–A distance is 2 < 1 < 3. In some cases, the π⋯π stacking interaction can significantly affect the photochromic behavior. The study found that there are π⋯π stacking interactions (3.754, 3.758 and 3.759 Å) between BTEC4− and 4-BCBPY2+ in all three compounds, the order is 1 < 2 < 3 (Fig. 4). After comparison, it is found that the D–A distance of compound 1 is farther than that of compound 2, but the distance of π⋯π stacking is closer than that of compound 1. However, the color change of compound 1 is faster than that of compound 2, which proves that in these two compounds, π⋯π stacking is the main factor affecting the color change behavior of the compound. The D–A distance and π⋯π stacking interaction distance of compound 3 is the farthest, so the discoloration speed is the slowest. Therefore, it can be inferred that the key factors affecting the photochromic behavior of the three compounds are the π⋯π stacking interaction and D–A distance. At the same time, the three compounds are synthesized using different metal salts of the same metal. It can be inferred that the metal salt affects the distance between the electron donor–acceptor and the π⋯π stacking interaction distance of the three compounds, resulting in the different photochromic behavior of the three compounds.
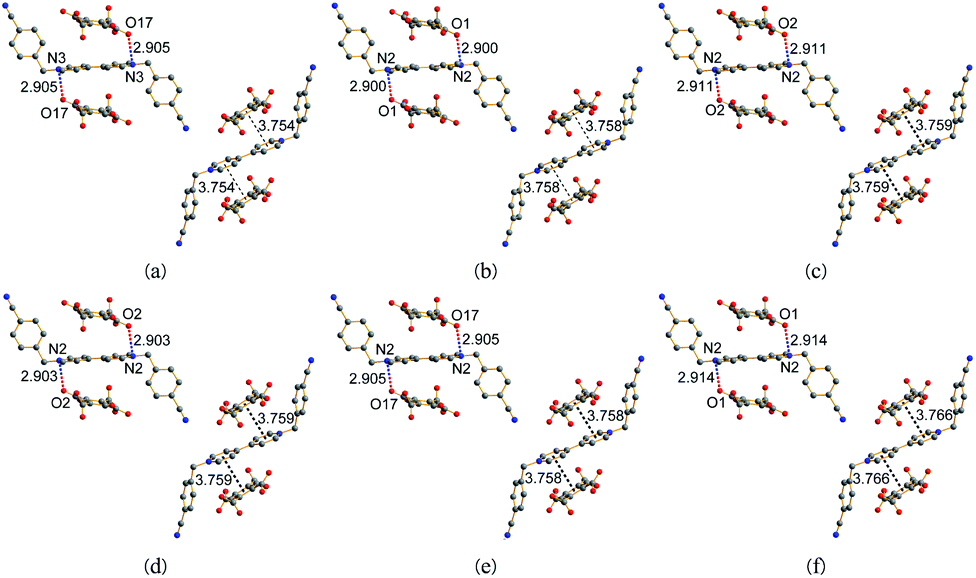 | ||
| Fig. 4 The ET distance and π–π interaction distance of compounds 1 (a), 2 (b), 3 (c), 1P (d), 2P (e) and 3P (f). | ||
To further understand the changes in the crystal structure during the discoloration process, we fortunately obtained the structures of the three compounds after being irradiated with UV light. The basic data of the crystal after discoloration (Table S6†) has not changed much compared with that before discoloration. Comparing the structure of the discolored compounds 1 (1P), 2 (2P) and 3 (3P) with those of 1, 2 and 3, it is found that the distance between the O atom on the carboxyl group and the N atom on the pyridine ring are 2.903 Å, 2.905 Å and 2.914 Å, and the distance of π⋯π stacking action are 3.759 Å, 3.758 Å and 3.766 Å, respectively (Fig. 4). The photochromic rate of compound 1 is the fastest, which means that it is the easiest for compound 1 to reach 1P from its original state. This was confirmed due to the change of D–A distance and π–π stacking distance before and after the discoloration.
XPS analysis showed that under UV light irradiation, the peak on O 1s shifted to a higher binding energy (531.4 eV → 531.6 eV), indicating that O on the carboxylic acid group lost electrons as an electron donor (Fig. S11†). The peak of N 1s moved to a lower binding energy position (399.2 eV → 398.9 eV), indicating that the N on the bipyridyl group should be an electron acceptor. Before and after coloring, the core energy level spectra of Zn 2p and C 1s are almost the same. It can be seen that the photochromic process of these compounds may originate from the electron transfer from the O atom of the carboxylic acid group to the N atom of the bipyridyl group.
In compounds 1, 2 and 3, 4-BCBPY2+ and benzene carboxylic acid groups act as a typical electron donor–acceptor mode, which plays the role of electron donation and electron absorption, respectively. Through time-dependent density functional theory (TDDFT) calculations, we have an in-depth understanding of the donor–acceptor structure and matching rules between 4-BCBPY2+ and acidic groups. Multiwfn software was used to obtain the charge density difference diagrams of compounds 1, 2 and 3 (Fig. S12†).46 For compound 1, the results show that the absorption at 405 nm and 626 nm is related to the n–π* transition from BTEC4− to 4-BCBPY2+ and the π–π* transition from 4-BCBPY2+ to 4-BCBPY2+, respectively. The absorption at 740 nm may be related to the transition of the metal to the 4-BCBPY2+ ligand (Table S7†). The results are in good agreement with the results of structural analysis.
Detection of ammonia
When the original samples of compounds 1, 2 and 3 were exposed to ammonia vapor, they experienced a clear and rapid color change from white to blue (Fig. 5). The discoloration time is 3 s, 6 s and 15 s respectively. Like the difference in photochromic behavior, metal salts may also affect the different ammonia response behaviors of the three compounds. The discolored compound faded from blue to yellow after 3–6 h. The yellow sample can repeatedly adsorb ammonia at least five times, and no obvious color loss is observed. The solid-state UV-vis spectra of NH3-treated compounds 1, 2 and 3 (referred to as 1@NH3, 2@NH3 and 3@NH3) showed peaks near 410 nm, 637 nm and 740 nm (Fig. 5). This may be due to the intermolecular electron transfer from ammonia to the electron-accepting viologen part of the protonated 4-BCBPY2+ ligand. As shown in Fig. S13,† 1@NH3, 2@NH3 and 3@NH3 show obvious fluorescence quenching. | ||
| Fig. 5 Discoloration photos (illustration) and UV-vis spectra (a–c) of 1@NH3, 2@NH3 and 3@NH3. | ||
Further study of the sensing mechanism of ammonia. Study the FT-IR spectra of compounds 1, 2 and 3 (Fig. S14†). Compared with compounds 1, 2 and 3, the FT-IR spectra of 1@NH3, 2@NH3 and 3@NH3 showed significant changes. In the FT-IR spectra of compounds 1, 2 and 3, the bands around 1620 cm−1 and 1556 cm−1 can be attributed to the C![[double bond, length as m-dash]](https://www.rsc.org/images/entities/char_e001.gif) C and CN stretching vibrations of the pyridine ring. For 1@NH3, 2@NH3 and 3@NH3, there are some obvious changes. The band around 1427 cm−1 is strengthened, indicating that the nucleophilic attack of the pyridine ring of the viologen part by the ammonia molecule affects the stretching vibration of the pyridine ring. In addition, the band near 1141 cm−1 disappear, and two bands appear near 1076 cm−1 and 1011 cm−1, which can be attributed to the erosion of ammonia. At the same time, the UV-vis spectra of the three compounds and 1@NH3, 2@NH3 and 3@NH3 were compared (Fig. 5). UV-vis spectra show that the discoloration of 1@NH3, 2@NH3 and 3@NH3 is due to the interaction between ammonia molecules and compounds 1, 2 and 3. In addition, ESR studies were conducted on 1@NH3, 2@NH3 and 3@NH3. As shown in Fig. 6, a symmetric singlet radical signal was observed, with g values of 2.0156, 2.0146 and 2.0160, which are similar to the value of free electrons (2.0023). It is well known that ammonia molecules with good electron donating ability can interact with the Lewis acid centers of viologen-containing compounds 1, 2 and 3 through acid–base interactions.11,25,37,38 The results indicate that the color changes of compounds 1, 2 and 3 during ammonia sensing may be the result of electron transfer from electron-rich ammonia molecules to viologen. The response time is basically the same as that of ammonia vapor sensors that have been reported in recent years (Table S8†).
C and CN stretching vibrations of the pyridine ring. For 1@NH3, 2@NH3 and 3@NH3, there are some obvious changes. The band around 1427 cm−1 is strengthened, indicating that the nucleophilic attack of the pyridine ring of the viologen part by the ammonia molecule affects the stretching vibration of the pyridine ring. In addition, the band near 1141 cm−1 disappear, and two bands appear near 1076 cm−1 and 1011 cm−1, which can be attributed to the erosion of ammonia. At the same time, the UV-vis spectra of the three compounds and 1@NH3, 2@NH3 and 3@NH3 were compared (Fig. 5). UV-vis spectra show that the discoloration of 1@NH3, 2@NH3 and 3@NH3 is due to the interaction between ammonia molecules and compounds 1, 2 and 3. In addition, ESR studies were conducted on 1@NH3, 2@NH3 and 3@NH3. As shown in Fig. 6, a symmetric singlet radical signal was observed, with g values of 2.0156, 2.0146 and 2.0160, which are similar to the value of free electrons (2.0023). It is well known that ammonia molecules with good electron donating ability can interact with the Lewis acid centers of viologen-containing compounds 1, 2 and 3 through acid–base interactions.11,25,37,38 The results indicate that the color changes of compounds 1, 2 and 3 during ammonia sensing may be the result of electron transfer from electron-rich ammonia molecules to viologen. The response time is basically the same as that of ammonia vapor sensors that have been reported in recent years (Table S8†).
 | ||
| Fig. 6 ESR spectra of 1@NH3 (a), 2@NH3 (b) and 3@NH3 (c). | ||
Detection of Cr2O72−
Considering that compounds 1, 2 and 3 are three-dimensional framework structures with channels, they can be applied to ion exchange of ionic pollutants.11,33,39,40 First, the dichromate ion was selected, and the fluorescence detection performance of compounds 1, 2 and 3 on Cr2O72− were studied. The synthesized sample (15 mg) was placed in solutions of different concentrations of Cr2O72−. After some time, the sample is filtered out and allowed to dry. The sample is then monitored by fluorescence spectroscopy. As shown in Fig. S15,† the intensity of the fluorescence spectrum gradually decreases as the concentration increases. It shows that the three compounds can detect very low concentration (10−5 M) Cr2O72−. In the low concentration range, the relationship between light intensity and [Cr2O72−] conforms to the linear Stern–Volmer equation I0/I = Ksv[Cr2O72−] + 1, and the values of Ksv are 9.12 × 10³ M−1, 1.56 × 10⁴ M−1 and 8.60 × 10³ M−1, respectively (Fig. 7). The detection limits (DLs) calculated from 3s/k (k, slope; s, standard) are about 3.28, 7.69 and 10.40 μM, respectively. It is basically the same as the fluorescent sensors for detecting Cr2O72− that have been reported in recent years (Table S9†). | ||
| Fig. 7 The Stern–Volmer plots of I0/I versus Cr2O72− concentrations of compound 1 (a), 2 (b) and 3 (c) in the low concentration region, the values of R2 are 0.9971, 0.9822 and 0.9719, respectively. | ||
To clarify its sensing mechanism, further experimental studies were carried out. The above phenomenon may be due to the interaction between Cr2O72− and compounds 1, 2 and 3. Compare the PXRD patterns of the three compounds with Cr2O72− treated samples (referred to as 1@Cr2O72−, 2@Cr2O72− and 3@Cr2O72−). It is found that some changes have occurred in the spectrum, indicating that the fluorescence quenching phenomenon may be caused by structural changes (Fig. S16†). From the FT-IR spectrum (Fig. S17†), it can be seen that the band near 1427 cm−1 is strengthened, and the band at 1141 cm−1 is split into two bands of 1158 cm−1 and 1078 cm−1. This shows that Cr2O72− has an effect on compounds 1, 2 and 3. During the detection process, the three compounds formed a chemical bond interaction with Cr2O72−. The solid UV-vis spectra of 1@Cr2O72−, 2@Cr2O72− and 3@Cr2O72− show that there is an absorption band at 420–550 nm, which shows a large overlap with the absorption of compounds 1, 2 and 3 (Fig. S18†). Considering the above factors, it can be considered that two factors affect the fluorescence quenching, the first is the structural change, and the second is the competitive absorption between 1, 2 and 3 and Cr2O72−.
Conclusions
In summary, under the heat of solution conditions, by introducing cyano-viologen into the channel formed by the Zn-BTEC host skeleton, three host and guest compounds based on MOF were prepared and characterized. Compounds 1, 2 and 3 exhibited ET photochromism under the irradiation of sunlight, UV light and blue ray. Stable free radicals can survive in the air for several weeks, and the three compounds all show good stability at 402 °C. Further studies have shown that compounds 1, 2 and 3 can sensitively detect ammonia vapor due to the transfer of electrons from electron-rich ammonia molecules to viologen. It also shows a rapid color change from white to blue-gray, which can be observed with the naked eye. It is worth noting that compounds 1, 2 and 3 can also sensitively detect Cr2O72−. Further mechanism exploration confirmed that the color change can be attributed to the structural change and the competitive absorption between the three compounds and Cr2O72−. At the same time, we also found an interesting phenomenon. The D–A distance and the π–π stacking distance of the compounds are different due to the metal salt, and the order is 2 < 1 < 3 and 1 < 2 < 3, respectively. The π–π stacking interaction is dominant. This affects their photochromic behavior, resulting in the order of the rate of color change is 1 > 2 > 3. In addition, the ammonia sensing behavior of the compounds is in the same order as the photochromic behavior. It is proved that the metal salt can affect the photochromic behavior and ammonia sensing behavior of the compounds. Future work will focus on the construction of new fluorescent MOFs based on viologen ligands as multifunctional sensing materials.Author contributions
S.-X. Cui conceived and supervised the project and edited and revised the manuscript. M.-H. Zuo supervised the project. B.-L. Zhu planned and implemented the synthesis and characterization of materials, wrote the manuscript and analysed the data. Y.-P. Jin and J.-Y. Chu analysed the data. All authors discussed the results and commented on the manuscript.Conflicts of interest
There are no conflicts to declare.Acknowledgements
Thanks to the Natural Science Foundation of Heilongjiang Province (QC2014C009), the Fundamental Research Fund for the Heilongjiang Provincial Universities (1451ZD001), the Mudanjiang Normal University Key Project (GP2021001) and the Open project of Inner Mongolia Key Laboratory of Photoelectric Functional Materials (Chifeng University).Notes and references
- T. Gong, Q. Sui, P. Li, X. F. Meng, L. J. Zhou, J. Chen, J. Xu, L. Wang and E. Q. Gao, Small, 2019, 15, e1803468 CrossRef PubMed.
- J. Liu, ChemistrySelect, 2018, 3, 8356–8362 CrossRef CAS.
- S. L. Li, M. Li, Y. Zhang, H. M. Xu and X. M. Zhang, Inorg. Chem., 2020, 59, 9047–9054 CrossRef CAS PubMed.
- P. Li, Q. Sui, M. Y. Guo, S. L. Yang, R. Bu and E. Q. Gao, Chem. Commun., 2020, 56, 5929–5932 RSC.
- Q. Shi, S. Y. Wu, X. T. Qiu, Y. Q. Sun and S. T. Zheng, Dalton Trans., 2019, 48, 954–963 RSC.
- P.-H. Wang, C.-M. Yu, M.-S. Wang and G.-C. Guo, Dyes Pigm., 2021, 185, 108888 CrossRef CAS.
- Y. Xue, S. Zheng, H. Xue and H. Pang, J. Mater. Chem. A, 2019, 7, 7301–7327 RSC.
- B. Li, H. M. Wen, Y. Cui, W. Zhou, G. Qian and B. Chen, Adv. Mater., 2016, 28, 8819–8860 CrossRef CAS PubMed.
- L. Shi, N. Li, D. Wang, M. Fan, S. Zhang and Z. Gong, TrAC, Trends Anal. Chem., 2021, 134, 116131 CrossRef CAS.
- P. Li, L.-J. Zhou, N.-N. Yang, Q. Sui, T. Gong and E.-Q. Gao, Cryst. Growth Des., 2018, 18, 7191–7198 CrossRef CAS.
- Z. Li, W. Cai, X. Yang, A. Zhou, Y. Zhu, H. Wang, X. Zhou, K. Xiong, Q. Zhang and Y. Gai, Cryst. Growth Des., 2020, 20, 3466–3473 CrossRef CAS.
- J. Zhang, Y. Zeng, H. Lu, X. Chen, X. Yuan and Z. Fu, Cryst. Growth Des., 2020, 20, 2617–2622 CrossRef CAS.
- J. Zhao, X. Qu, J. Wang and B. Yan, Ind. Eng. Chem. Res., 2019, 58, 18533–18539 CrossRef CAS.
- J.-J. Liu, Dyes Pigm., 2019, 163, 496–501 CrossRef CAS.
- Y. S. Liu, Y. H. Luo, L. Li and H. Zhang, Photochem. Photobiol. Sci., 2017, 16, 753–758 CrossRef CAS PubMed.
- J. Y. Zou, J. Ji, M. H. Fan, J. Y. Li, H. Y. Wang and G. D. Li, Dalton Trans., 2021, 50, 10237–10242 RSC.
- W. Q. Kan, Y. C. He, S. Z. Wen and P. S. Zhao, Dalton Trans., 2019, 48, 17770–17779 RSC.
- L. Li, Z.-M. Tu, Y. Hua, X.-N. Li, H.-Y. Wang and H. Zhang, Inorg. Chem. Front., 2019, 6, 3077–3082 RSC.
- L. Li, Y. C. Zou, Y. Hua, X. N. Li, Z. H. Wang and H. Zhang, Dalton Trans., 2020, 49, 89–94 RSC.
- J.-J. Liu, S.-B. Xia, Y. Liu, H. Suo, J. Liu and X. Shen, Cryst. Growth Des., 2020, 20, 1729–1737 CrossRef CAS.
- J. Liu, Y. Lu and W. Lu, CrystEngComm, 2020, 22, 2121–2127 RSC.
- L. Liu, Y. Ren, J. Pan, Z. Liu, B. Wu and F. Yan, ACS Appl. Mater. Inter, 2020, 12, 1495–1503 CrossRef CAS PubMed.
- Y. Yang, X.-J. Zhou, N. Zhao, Y.-C. He, G. Zhang and J.-J. Yang, Inorg. Chim. Acta, 2020, 502, 119292 CrossRef CAS.
- J. Liu, J. Li and W. Lu, RSC Adv., 2019, 9, 33155–33162 RSC.
- M. Chen, L. Sun, X.-D. Yang, R.-Y. Guo, Q.-Q. Zhang and J. Zhang, Inorg. Chem. Commun., 2018, 87, 53–56 CrossRef CAS.
- C. Chen, H. Rao, S. Lin and J. Zhang, Dalton Trans., 2018, 47, 8204–8208 RSC.
- Y.-L. Wang, X.-H. Chen, W. Shu, H.-G. Qin, J.-D. Lin, R.-G. Lin and N. Wen, J. Coord. Chem., 2019, 72, 573–583 CrossRef CAS.
- J.-J. Liu, J. Li and G.-Z. Zhao, Polyhedron, 2019, 161, 237–242 CrossRef CAS.
- J.-J. Liu, J. Li and G.-Z. Zhao, New J. Chem., 2019, 43, 6607–6614 RSC.
- J. Liu, J. Li, G. Zhao and W. Lu, Dyes Pigm., 2020, 174, 108101 CrossRef CAS.
- H. Chen, M. Li, G. Zheng, Y. Wang, Y. Song, C. Han, Z. Fu, S. Liao and J. Dai, RSC Adv., 2014, 4, 42983–42990 RSC.
- J.-J. Liu and J. Li, Dyes Pigm., 2019, 170, 107565 CrossRef CAS.
- M. H. Li, S. L. Lv, M. H. You and M. J. Lin, Dalton Trans., 2020, 49, 13083–13089 RSC.
- Q. Sui, N. N. Yang, T. Gong, P. Li, Y. Yuan, E. Q. Gao and L. Wang, J. Phys. Chem. Lett., 2017, 8, 5450–5455 CrossRef CAS PubMed.
- Q. Sui, P. Li, R. Sun, Y. H. Fang, L. Wang, B. W. Wang, E. Q. Gao and S. Gao, J. Phys. Chem. Lett., 2020, 11, 9282–9288 CrossRef CAS PubMed.
- Q. Sui, X. T. Ren, Y. X. Dai, K. Wang, W. T. Li, T. Gong, J. J. Fang, B. Zou, E. Q. Gao and L. Wang, Chem. Sci., 2017, 8, 2758–2768 RSC.
- C. Chen, L. X. Cai, B. Tan, Y. J. Zhang, X. D. Yang and J. Zhang, Chem. Commun., 2015, 51, 8189–8192 RSC.
- Q. Sui, P. Li, N. N. Yang, T. Gong, R. Bu and E. Q. Gao, ACS Appl. Mater. Inter, 2018, 10, 11056–11062 CrossRef CAS PubMed.
- C. Zhang, L. Sun, Y. Yan, H. Shi, B. Wang, Z. Liang and J. Li, J. Mater. Chem. C, 2017, 5, 8999–9004 RSC.
- P. Li, X.-M. Yin, L.-L. Gao, S.-L. Yang, Q. Sui, T. Gong and E.-Q. Gao, ACS Appl. Nano Mater., 2019, 2, 4646–4654 CrossRef CAS.
- W.-W. Zhang, Y.-P. Jin, J.-H. Yu, B.-L. Zhu, J. Jiang, M.-H. Zuo, Y.-F. Chen, J.-J. Li and S.-X. Cui, J. Solid State Chem., 2021, 304, 122597 CrossRef CAS.
- B.-L. Zhu, Y.-P. Jin, J. Jiang, M.-H. Zuo and S.-X. Cui, New J. Chem., 2022, 46, 1905–1911 RSC.
- M.-H. Zuo, Y. Liu, N.-N. Yuan, Y. Gao, Y.-Y. Li, Y.-J. Ma, M.-Y. Sun and S.-X. Cui, J. Solid State Chem., 2022, 307, 122868 CrossRef CAS.
- O. V. Dolomanov, L. J. Bourhis, R. J. Gildea, J. A. K. Howard and H. Puschmann, J. Appl. Crystallogr., 2009, 42, 339–341 CrossRef CAS.
- G. Sheldrick, Acta Crystallogr., Sect. A: Found. Crystallogr., 2008, 64, 112–122 CrossRef CAS PubMed.
- T. Lu and F. Chen, J. Comput. Chem., 2012, 33, 580–592 CrossRef CAS PubMed.
- H. Zhang, F. He, X. Li, Z. Wang and H. Zhang, New J. Chem., 2021, 45, 15851–15856 RSC.
- G. Zhao, W. Liu, F. Yuan and J. Liu, New J. Chem., 2021, 45, 6787–6795 RSC.
- M. H. Li, M. H. You and M. J. Lin, Dalton Trans., 2021, 50, 4959–4966 RSC.
Footnote |
| † Electronic supplementary information (ESI) available: Graphics (Fig. S1–S17) and tables (Tables S1–S7). CCDC 2087817, 2090938, 2124977, 2098345, 2114330 and 2114328. For ESI and crystallographic data in CIF or other electronic format see DOI: 10.1039/d2ra00599a |
| This journal is © The Royal Society of Chemistry 2022 |